Using combined measurements of gas exchange and chlorophyll fluorescence
to investigate the photosynthetic light responses of plant species adapted to
different light regimes
Shau-Lian Wong *,***, Chung-Wei Chen **, Hsien-Wen Huang* , and Jen-Hsien Weng **,***,+
Division of Botany, Endemic Species Research Institute, Chichi, Nantou, Taiwan *
Graduate Institute of Ecology and Evolutionary Biology, China Medical University, Taichung, Taiwan **
Department of Life Science, National Chung-Hsing University, Taichung, Taiwan ***
Abstract
One broad-leaved pioneer tree, Alnus formosana, 2 broad-leaved understory shrubs, Ardisia
crenata and Ardisia cornudentata, and 4 ferns with different light adaptation capabilities
(ranked from high to low, Pyrrosia lingus, Asplenium antiquum, Diplazium donianum,
Archangiopteris somai) were used to elucidate the light responses of photosynthetic rate and
electron transport rate (ETR). Pot-grown materials received up to 3 levels of light intensity, i.e.,
100%, 50% and 10% sunlight. Both gas exchange and chlorophyll fluorescence were measured
simultaneously by an equipment under constant temperature and 7 levels (0–2,000 mol m–2 s–1)
of photosynthetic photon flux density (PPFD). Plants adapted to or acclimated to high light
always had higher light saturation point and maximal photosynthetic rate. Even materials had a
broad range of photosynthetic capacity (maximal photosynthetic rate ranging from 2to 23 μmol 1 2 3 4 5 6 7 8 9 10 11 12 13 14 15 16 17 18 19 20
CO2 m–2 s–1), the ratio of ETR to gross photosynthetic rate (PG) was close for A. formosana and
the 4 fern species when measured under constant temperature, but the PPFD varied. In addition,
P. lingus and A. formosana grown under 100% sunlight and measured at different seasonal
temperatures (15, 20, 25 and 30°C) showed increased ETR/PG ratio with increasing temperature
and could be fitted by first- and second-order equations, respectively. With this equation,
estimated and measured PG were closely correlated (r2 = 0.916 and r2 = 0.964 for P. lingus and A.
formosana, respectively, p<0.001). These equations contain only the 2 easily obtained dynamic
indicators, ETR and leaf temperature. Therefore, for some species with near ETR/PG ratio in
differential levels of PPFD, these equations could be used to simulate dynamic variation of leaf
scale photosynthetic rate under different temperature and PPFD conditions.
Additional key words: electron transport rate; fern; gross photosynthetic rate; light intensity;
temperature; woody plant. __________
+Author for correspondence; fax: +886 4 22071507, e-mail: [email protected]
Abbreviations: ETR – electron transport rate; Fv/Fm – potential quantum efficiency of PSII; gs – stomatal conductance; PG – gross photosynthetic rate; PN – net photosynthetic CO2 exchange rate;
PPFD – photosynthetic photon flux density; PSII – photosystem II; ФPSII – PSII efficiency.
Introduction
21 22 23 24 25 26 27 28 29 30 31 32 33 34 35 36 37 38 39 40Sunlight is the energy source for plant photosynthesis and one of the major environmental factors
influencing growth and distribution of plant species (Boardman 1977, Lambers et al. 1998).
Studying photosynthesis–irradiance relationships is fundamental to plant eco-physiological
research and rare species management, because the photosynthetic light-response curve could be
used to assess the light-utilizing ability and optimal habitat light condition of plants (Bazzaz and
Carlson 1982, Lüttge 1997, Aleric and Kirkman 2005).
Plant species adapted to different light regimes show differential photosynthetic
characteristics. Species adapted to high light often have a high light compensation point and light
saturation point and maximal photosynthetic rate (Givnish 1988, Hölscher et al. 2006). In
addition, the same plant species grown under different light environments should be able to
acclimate to the habitat by morphological and physiological changes (Griffin et al. 2004, Aleric
and Kirkman 2005, Huang et al. 2007, Zhang et al. 2007, Dai et al. 2009). However, the
capability of photosynthetic adaptation and acclimation is species-specific. For example, in sun
plants, the maximal rate of photosynthesis for sun leaves is always greater than for shade leaves
(Pearcy and Sims 1994). In contrast, this rate for medium-light-grown individuals of species
adapted to the shade (Chabot and Chabot 1977, Dai et al. 2009) or a broad light range (Aleric and
Kirkman 2005, Zhang et al. 2007) is generally higher than that for high- and low-light-grown
plants. Yet, some shade species have a similar rate of photosynthesis if grown in the shade or full
sun (Griffin et al. 2004). 41 42 43 44 45 46 47 48 49 50 51 52 53 54 55 56 57 58 59
Photosynthesis is a combination of light and carbon reactions. The former converts light
energy to the generation of ATP and NADPH, which are consumed by the carbon reaction (Taiz
and Zeiger 2006). Insufficient light may limit photosynthesis, thus resulting in reduced net
carbon gain and plant growth. In contrast, under high irradiance, e.g., leaves in the top canopy
layer exposed to sun, or leaves in the shade exposed to sunflecks, the light reaction may absorb
more photons than the dark reaction can use, and this excessively absorbed energy often leads to
reduced efficiency of the photosystem, especially photosystem II (PSII) (Demmig-Adams et al.
1996, Kato et al. 2003, Adams et al. 2004). Plants have developed a number of strategies to
balance the captured photon energy and protect the photosynthetic apparatus against
photodamage. Among them, xanthophylls-dependent non-photochemical quenching can play an
important role to dissipate the excess energy as heat (Demmig-Adams and Adams 1996, Li et al.
2000, Adams et al. 2004). Thus, the light energy absorbed by the photosystem can be consumed
by photochemical and non-photochemical processes. With increasing light intensity, the
proportion of excess light energy increases. Therefore, under high light, often the xanthophyll
cycle is enhanced and PSII efficiency decreased. Nevertheless, the xanthophyll cycle and PSII
efficiency gradually recover when light becomes weak (Demmig-Adams et al. 1996, Verhoeven
et al. 1999). As well, PSII efficiency might decrease with decreased photosynthetic rate, when
photosynthesis is inhibited by environmental or physiological factors (Ghannoum et al. 2003,
Adams et al. 2004, Weng 2009). Stomatal conductance (gs) is another important limiting factor 60 61 62 63 64 65 66 67 68 69 70 71 72 73 74 75 76 77 78
for photosynthesis. Photosynthesis and gs may be tightly coupled in many conditions
involving at different light intensity and temperature (Yu et al. 2004, Huang et al. 2007).
The traditional measurement of photosynthetic rate, especially in the field, is not easy
because it requires expensive equipment and intensive labor. Nevertheless, chlorophyll
fluorescence quenching analysis is a fast, simple, non-invasive, and reliable method to assess
changes in function of PSII under different environmental and physiological conditions (Roháček
and Barták 1999, Maxwell and Johnson 2000). Electron transport rate (ETR), calculated from the
product of PSII efficiency and absorbed light, expresses the relative rate of electron transport
through PSII (Krall and Edwards 1992). Because photosynthetic CO2 fixation is a major sink for
electrons from PSII, ETR is related to the rate of photosynthesis (e.g., Krall and Edwards 1992),
with similar patterns between the light-response curve of ETR and CO2 fixation (Earl and
Tollenaar 1998, Franco and Lüttge 2002, Coopman et al. 2008). However, except for CO2
fixation, electrons from PSII have several energy sinks, such as photorespiration (Peterson 1994),
water-water cycle (Asada 1999) and the cyclic electron flow within PSII (Miyake and Okamura
2003), as well as nitrogen assimilation (Robinson 1990). Because alternative electron paths,
mostly photorespiration, are restricted in C4 plans, numerous studies have concluded a strong
linear relationship between ETR and the gross photosynthetic rate (PG). This relationship appears
to be stable under many conditions, even when merging data from different genotypes (Earl and
Tollenaar 1998) or from differences in both CO2 partial pressure and temperature (Kakani et al. 79 80 81 82 83 84 85 86 87 88 89 90 91 92 93 94 95 96 97
2008) across a broad range of light intensity.
In C3 plants, both CO2 fixation and photorespiration are major sinks for electrons from PSII.
Therefore, the ratio of ETR to PG [or PSII efficiency (ФPSII)/photosynthetic rate per absorbed
quantum (ФCO2)] greatly increases with decreasing CO2 partial pressure (Krall and Edwards 1990,
Cornic and Briantais 1991) or increasing temperature (Oberhuber and Edwards 1993) and O2
partial pressure (Ripley et al. 2007) because of the increase in photorespiration. Thus, in C3
plants, ETR and photosynthetic rate are significantly correlated only under conditions of
non-photorespiratory or with approximate temperature as well as CO2 and O2 concentrations (Cheng
et al. 2001, Pérez-Torresa et al. 2007, Ripley et al. 2007).
From the reports previously mentioned, photosynthetic light response varies by plant
species, and chlorophyll fluorescence measurement is a simple and reliable method for estimating
photosynthesis. Eco-physiological studies require knowledge of photosynthetic rate of plants
under different environments and with a broad range of light intensity. However, few studies of
species with different taxa and capabilities of light adaptation and acclimation have compared the
light response patterns of ETR and CO2 fixation of C3 plants (Franco and Lüttge 2002, Sun et al.
2007). In this study, we used 3 woody and 4 fern species with different light adaptation
capabilities to elucidate the light response patterns of ETR and CO2 fixation.
Materials and Methods
Plant materials: We used as materials 1 leaved pioneer tree, Alnus formosana; 2 broad-98 99 100 101 102 103 104 105 106 107 108 109 110 111 112 113 114 115 116 117
leaved understory shrubs, Ardisia crenata and Ardisia cornudentata; and 4 ferns with different
light adaptation capabilities (ranked from high to low, Pyrrosia lingus, Asplenium antiquum,
Diplazium donianum, Archangiopteris somai). Adult plants of D. donianum and Arc. somai,
about 30 cm tall, were collected from Yuchi Township, Nantou County, Taiwan (23°49’N,
120°54’E, 560 m a.s.l.). One- to 2-year-old A. formosana seedlings about 30–50 cm tall, and
adult plants of the other 4 species, about 30 cm tall (P. lingus, As. antiquum) to 60 cm tall (Ard.
crenata, Ard. cornudentata) were collected from Hueishun Forest Recreation Area, Ren’ai
Township, Nantou County, Taiwan (24°05’N, 121°01’E, 800 m a.s.l.). All plants were collected
in March 2010 and then transplanted to pots (16-cm diameter, 12-cm depth, 1 plant per pot for
the 3 woody species and As. antiquum, and 1 rhizome with 3–4 leaves per pot for the other 3
ferns) filled with organic soil and maintained outdoors in the nursery at the Endemic Species
Research Institute, Chichi Township, Nantou County, Taiwan (23°49’N, 120°48’E, 250 m a.s.l.).
Materials were regularly watered and fertilized (half-strength Hoagland’s nutrient solution per
month) and received up to 3 levels of light intensity, i.e., 100%, 50% and 10% (beneath shade
cloth) sunlight. Detailed information for each material and light condition are in Table 1. During
the growth period of the materials (March 2010to February 2011), the average hourly values of
daily maximum photosynthetic photon flux density (PPFD) ranged from 1,296−1,456 μmol m–2
s–1 (Mar.−Aug.) and 1,150−750−1,171 μmol m–2 s–1 (Sept.−Dec.−Feb.) (data from the Endemic
Species Research Institute). 118 119 120 121 122 123 124 125 126 127 128 129 130 131 132 133 134 135 136
Measurements: Measurements were taken from September 2010 to February 2011,under eaves
of a cottage at the Endemic Species Research Institute. At dawn of the measurement day, fully
expanded younger leaves were selected and dark-adapted by covering with aluminum film until
measurement. From 9:30 h to 15:00 h, photosynthesis, stomatal conductance and chlorophyll
fluorescence were measured by use of a portable, open-flow gas exchange system (6400,
LI-COR, Lincoln, NE, USA) and an integrated fluorescence chamber head (LI-6400-40), stepwise
from low to high levels of PPFD, i.e., 0, 100, 200, 400, 800, 1,200 and 2,000 μmol m–2 s–1. Leaf
temperature was kept at 15, 20, 25 and 30°C for 100% sunlight-grown A. formosana and P.
lingus, and 25°C for the other materials (Table 1). Plants were measured in the season with the
climate temperature close to the leaf temperature. The 30°C measurement was in September, the
25°C measurement from October to November and the 15–20°C measurement from January to
February. Throughout the measurements, CO2 concentration and relative humidity in the chamber
were kept at 350–400 μmol mol–1 (no control) and 75% (air entering chamber controlled by
passing temperature-controlled water), respectively.
The values of CO2 exchange, gs and chlorophyll fluorescence were recorded every 2 min, until
CO2 exchange was stable (about 4 min in the dark, and 8−16 min under each level of
illumination). PG was calculated from PN + dark respiration rate. The former is the stable CO2
exchange rate under each level of PPFD, and the latter is the CO2 exchange rate measured in the 137 138 139 140 141 142 143 144 145 146 147 148 149 150 151 152 153 154 155
dark before illumination. The potential quantum efficiency of PSII (Fv/Fm) of dark-adapted
leaves was calculated by (Fm–F0)/Fm. F0 and Fm, the minimal and maximal fluorescence, were
determined by applying a weak pulse of light (0.1 μmol quanta m–2 s–1) and a 0.8-s pulse of
saturating flashes of approximately 6,000 μmol quanta m–2 s–1, respectively. For leaves under
each level of illumination, the actual PSII efficiency (∆F/Fm’) was calculated as (Fm’ –F)/Fm’. F
and Fm’ are the actual and the maximal levels of fluorescence during illumination, respectively.
The former was determined under each PPFD level of CO2 exchange measurement, and the latter
was determined by the same process as for Fm. ETR was calculated as ∆F/Fm’×PPFD×0.5×α
(Maxwell and Johnson 2000). The average value of leaf absorption (α) for green leaves of 0.84
(Björkman and Demmig 1987) was used.
Statistics: Four to 6 leaves from 4 plants of each species grown each light condition were measured. Each leaf was taken as one replicate in statistical analyses. The light-response curve
of photosynthetic rate was fitted by sigmoidal or hyperbolic equations. We used these equations
to estimate the light saturation point (PPFD of PN to reach 90% of maximum, Hölscher et al.
2006, Huang et al. 2007). The other data were analyzed by linear or curve-linear regressions. All
statistical analyses involved use of Sigma Plot v10.0.
Results
For the light-response curves of gas exchange measured at 25°C, the net photosynthetic CO2 156 157 158 159 160 161 162 163 164 165 166 167 168 169 170 171 172 173 174 175
exchange rate (PN) of all materials was increased in a curve-linear fashion with increasing PPFD
(Fig. 1). The relation of PN and PPFD for Arc. somai could be best fitted by the equation y = a (1
–e–bx),and the others could be best fitted by the equation y = ax/(b + x) (y = PN, x = PPFD, r2 =
0.779–0.963, p<0.001 for all). Woody plants or ferns adapted or acclimated to high light always
had higher light saturation point and maximal photosynthetic rate. A. formosana, a pioneer tree,
had the highest PN (23 μmol(CO2) m–2 s–1 in maximum) and did not reach saturation under 2,000
μmol m–2 s–1 PPFD (Fig. 1A). P. lingus, a slight shade fern, had the second highest PN and light
saturation point (Fig. 1B), followed by the other medium-shade plants, As. antiquum (Fig. 1C), D.
donianum (Fig. 1A), Ard. crenata and Ard. cornudentata (Fig. 1D), whose maximal PN and light saturation point ranged from 3.1 to 6.7 μmol(CO2) m–2 s–1 and 694 to 1,698 μmol m–2 s–1 PPFD ,
respectively. For Arc. somai, a heavy shade fern, the maximal PN was only 2 μmol(CO2) m–2 s–1,
and the curve reached saturation at about 300 μmol m–2 s–1 PPFD. For the effect of light condition
on PN of the same species, we found that all tested species always had higher photosynthetic rate
and light saturation point when grown in high sunlight (Fig. 1A–D). For PSII efficiency, before
illumination, Fv/Fm of all dark-adapted leaves was about 0.8, with no significant difference among
tested materials (Fig. 1). However, ∆F/Fm’ was decreased curve linearly with increasing PPFD
and was greater for materials with low PN. Thus, the light-response curve of ETR was near to the
curve of PN (data not shown), and ETR was closely related to PN, even when data for low to high
PPFD were merged (Fig. 3B,D,F). In addition, gs also increased asymptotically with 176 177 178 179 180 181 182 183 184 185 186 187 188 189 190 191 192 193 194
increasing PPFD. However, the increase in gs was more rapid than that of PN (Fig. 1A–D and I–
L). Materials with higher PN always showed higher gs under high PPFD. However, Arc. somai and
D. donianum, heavy- and medium- to heavy-shade adaptable ferns, had higher gs than the other 2 tested ferns, and even lower PN.
Ard. crenata and Ard. cornudentata had the highest ETR/PG ratio (25.9–40.4) at 100 μmol m–
2 s–1 PPFD (Fig. 2), and the ratio decreased greatly to 7.2–24.9 with PPFD increased to 400–800
μmol m–2 s–1; then the ratio decreased gradually and was between 7.3–11.9 with PPFD increased
to 2,000 μmol m–2 s–1 (Fig. 2D). For 50% sunlight-grown As. antiquum, the ratio of ETR/PG under
100 μmol m–2 s–1 PPFD was 18.2, but decreased slowly to 12.2 with PPFD increased to 800 μmol
m–2 s–1 and then to 16.3 with 2,000 μmol m–2 s–1 PPFD (Fig. 2C). However, the other materials
showed no significant difference in ETR/PG ratio, even under different PPFD. Among them, A.
formosana has the lowest ETR/PG ratio (average 6.8 from 100 to 2,000 μmol m–2 s–1 PPFD). For
fern species, except for the 50% sunlight-grown As. antiquum, the ETR/PG ratio ranged from 7.4
(50% sunlight-grown P. lingus) to 12.1 (10% sunlight-grown Arc. somai) (Fig. 2A–D).
Because the ETR/PG ratio was close for most tested materials, from low to high PPFD, ETR
was strongly correlated with PG (Fig. 3A,C) and even PN (Fig. 3B,D). According to the ETR/PG
ratio, the PG-ETR and PN-ETR relations could be divided into 3 groups by species: A. formosana,
4 ferns and 2 understory shrubs. At the same levels of ETR, PG and PN was higher for A.
formosana than did the 4 ferns and 2 understory shrubs. However, the regression lines between
195 196 197 198 199 200 201 202 203 204 205 206 207 208 209 210 211 212 213
the 4 ferns and 2 understory shrubs were similar. Thus, even data obtained from the 2 groups (4
ferns and 2 understory shrubs) merged revealed stronger correlation between PG and ETR (y = –
0.064 + 0.104 x, r2 = 0.896, p<0.001) (Fig. 3E) and between PN and ETR (y = –0.835 + 0.102 x ,
r2 = 0.878, p<0.001)(Fig. 3F).
At 15, 20 and 30°C, the ETR for the 2 tested species was still parallel to the variation in CO2
fixation when measured under differential levels of PPFD (data not shown). However, the ETR/PG
ratio for both P. lingus and A. formosana was increased with increasing temperature from 15 to
30°C and could be fitted by first- and second-order order equations, respectively (Fig. 4). Figure 5
shows that the PG estimated from these 2 regression equations [PG = ETR/(3.036 + 0.272T) for P.
lingus, and PG = ETR/(6.633 – 0.162T + 0.007T2) for A. formosana, where T is leaf temperature
(°C)] was closely correlated with measured PG (r2 = 0.916 and 0.964, respectively, p<0.001). These
relationships remained under 15–30°C and 0–2,000 μmol m–2 s–1 PPFD.
Discussion
We tested 3 woody plants and 4 fern species with different light adaptation capabilities. The plant
species adapted to or acclimated to high light always had a higher light saturation point and
maximal photosynthetic rate (Fig. 1). Therefore, sun plants or sun leaves tend to efficiently use
light energy by increasing their efficiency of CO2 fixation, whereas shade plants or shaded leaves
tended to have the opposite behavior. These results generally agree with previous results (e.g.,
Givnish 1988, Pearcy and Sims 1994, Hölscher et al. 2006, Huang et al. 2007). 214 215 216 217 218 219 220 221 222 223 224 225 226 227 228 229 230 231 232 233
Some reports noted the light-response curve of gs close to that of PN (Yu et al. 2004, Huang
et al. 2007), and late successional species or shade-grown plants showed low PN and gs (Hölscher
et al. 2006, Huang et al. 2007). The physiological role of stomata is to prevent water loss and to
facilitate CO2 diffusion to mesophyll cells. Guard cells respond to intercellular CO2 concentration,
which is determined by atmospheric CO2 and by the mesophyll assimilation rate (Vavasseur and
Raghavendra 2005), which allows for a tight coupling between gs and PN. Our materials with high
PN under high PPFD always showed high gs (Fig. 1), which agrees with the previous works. However, the PN–gs relationship may vary with species. Especially, ferns have low ability for
detecting and responding to increases in CO2 concentration, which leads to lower PN/gs ratio than
those of angiosperms (Brodribb et al. 2005, Haworth et al. 2011). We found the same tendency
for Arc. somai and D. donianum, heavy- and medium- to heavy-shade adaptable ferns (Fig.1). In
addition, with PPFD increased from 0 to ca. 400 μmol m–2 s–1, the increased rate of gs was higher
than that of PN (Fig 1). Thus, in the well water condition of the present study, gs might be not a
main limiting factor for photosynthesis, in combining all obtained data.
High light often leads to absorption of more photons than can be consumed (Stuhlfauth et al.
1990, Valladares and Pearcy 1997). To avoid the damage caused by excessive absorbed energy,
plants often downregulate the efficiency of the photosystem, especially PSII (Demmig-Adams et
al. 1996, Kato et al. 2003, Adams et al. 2004). Thus, especially in C4 plants, PSII efficiency (or ETR) is always parallel to variation in quantum yield of CO2 fixation (or photosynthetic rate) 234 235 236 237 238 239 240 241 242 243 244 245 246 247 248 249 250 251 252
under many cases (Earl and Tollenaar 1998, Kakani et al. 2008). In contrast, in C3 plants, a
significant correlation was found between ETR and PG only under limited conditions because of
the interference of photorespiration and other alternative pathways for electrons (Oberhuber et al.
1993, Cheng et al. 2001, Pérez-Torresa et al. 2007, Ripley et al. 2007).
Although the rates of both CO2 fixation and photorespiration may vary with temperature and
PPFD, Ripley et al. (2007) indicated that C3 Alloteropsis semialata could maintain a
near-constant ratio of PSII efficiency to true quantum yield of CO2 fixation under both
photorespiratory and non-photorespiratory conditions. In addition, this ratio measured under
photorespiratory conditions was 1.8 times higher than that under non-photorespiratory conditions.
Therefore, under a constant temperature but varied PPFD conditions, the allocation of absorbed
photons between CO2 fixation and photorespiration may not be affected by photosynthetic rate.
Thus, for some C3 plants, a near-constant ratio of PSII efficiency to true quantum yield of CO2
fixation or a significant linear correlation between quantum yield of CO2 fixation (or
photosynthetic rate) and PSII efficiency (or ETR) occurs under a constant temperature and
non-photorespiratory but varied PPFD (Pérez-Torres et al. 2007, Ripley et al. 2007, Sun et al. 2007).
We found similar results in the present study. Moreover, with measurements under 25°C and
100−2,000 μmol m–2 s–1 PPFD, A. formosana and the 4 ferns, adapted to different light regimes,
still showed a close (7–10) ETR/PG ratio, even at differential levels of light intensity and maximal
photosynthetic rate ranging from 2 to 23 μmol(CO2) m–2 s–1 (Fig. 2). Thus, the photosynthetic rate 253 254 255 256 257 258 259 260 261 262 263 264 265 266 267 268 269 270 271
of these 5 species may not lead to a different allocation between CO2 fixation and alternative
pathways of photons absorbed by the photosystem, even if PG is influenced broadly by the PPFD
of measurement or by species-specific morphological or physiological factors or light conditions
of their growth. Of note, in previous (Pérez-Torres et al. 2007, Ripley et al. 2007, Sun et al. 2007)
and the present studies, both CO2 exchange and ETR were obtained simultaneously under a
constant temperature but varied PPFD. Environmental and physiological factors did not differ
during the measurement of the two characteristics. This situation may explain why we could
obtain a close ETR/PG ratio with low to high PPFD.
Even with measurements under the same conditions, the ratio of ETR/PG or PSII
efficiency/true quantum yield of CO2 fixation may vary by species because of differences in
allocation portion between CO2 fixation and alternative electronic pathways (Oberhuber and
Edwards 1993, Franco and Lüttge 2002, Cavender-Bares and Bazzaz 2004, Pérez-Torres et al.
2007,Sun et al. 2007). We found the ETR/PG ratio lower for A. formosana, a sun woody plant,
than for the other 6 tested species under each level of PPFD (Fig. 2). As well, Ard. crenata and
Ard. cornudentata, both broad-leaved understory shrubs, showed a higher (20–57) ETR/PG ratio with PPFD lower than 800 μmol m–2 s–1 (Fig. 2). Probably, Rubisco may not be fully activated
during the early period of the measurements and resulted in the greater electron flow partitioning
for the alternative electron pathways (Makino et al. 2002). This situation may explain the
significantly higher ETR/PG ratio during the early period of measurement. We found the ETR/PG 272 273 274 275 276 277 278 279 280 281 282 283 284 285 286 287 288 289 290
ratios similar for the 4 ferns throughout the light courses of measurements, and the ratio for Ard.
crenata and Ard. cornudentata could be reduced close to that of the 4 ferns with PPFD higher
than 800 μmol m–2 s–1. Thus, even when merging data from the 2 groups (4 ferns and 2 understory
shrub species), we found a stronger correlation between PG and ETR (Fig. 3E). In addition,
because of the small difference in dark respiration rate among species and light environment of
their growth, we found the same tendency for the PG–ETR relation as for the PN–ETR relation
(Fig. 3F). Thus, we may use these relations to estimate photosynthetic rate under different PPFD. For C3 plants, variations in temperature can affect the efficiency of both CO2 fixation and
alternative electron pathways (Hall and Keys 1983, Oberhuber and Edwards 1993, D’Ambrosio
et al. 2006). However, with atmospheric CO2 and O2 concentrations, the temperature response of ETR/PG ratio (or ETR/PN and ФPSII/ФCO2) varies by species. Oberhuber and Edwards (1993)
reported that, in a broad temperature range (15–35°C), the ФPSII/ФCO2 ratio of Flaveria pringlei
was increased with increasing temperature. In contrast, D’Ambrosio et al. (2006) pointed out that
the ETR/PN of Beta vulgar was unaffected by temperature under 5–25°C but was increased with
increasing temperature from 30 to 35°C. In addition, Kubien and Sage (2004) reported no
variation in ETR/PN ratio of 14/10°C (day/night)-grown Calamogrostis canadensis when
measured at 5–35°C. Yet, this ratio of 26/22°C-grown C. canadensis increased with increasing
temperature from 5 to 35°C. We found the ETR/PG ratio for the 2 tested species increased with
increasing temperature from 15 to 30°C but also found specific variation of the temperature 291 292 293 294 295 296 297 298 299 300 301 302 303 304 305 306 307 308 309
response of the ETR/PG ratio. Nevertheless, the temperature responses of the ETR/PG ratio in P.
lingus and A. formosana could be fitted by first- and second-order equations, respectively (Fig.
4). These equations contain only 2 easily obtained dynamic indicators, ETR and leaf temperature.
Therefore, they could be used to estimate photosynthetic rate under different temperature and
PPFD conditions. From the close correlation between the estimated and measured PG, under
different seasonal temperature (15–30°C) and 0–2,000 μmol m–2 s–1 PPFD conditions(Fig. 5), we
conclude that these empirical regression models, developed from temperature responses of the
ETR/PG ratio could be used to simulate dynamic variation of leaf scale photosynthetic rate at
different temperature and PPFD conditions. However, this empirical regression model might vary
by species, because of different temperature responses of ETR/PG ratio. In addition, this empirical
regression model was unsuitable for some species, such as Ard. crenata and Ard. cornudentata,
whose ETR/PG ratio varied with PPFD.
References
Adams, W.W., III, Zarter, C.R., Ebbert, V., Demmig-Adams, B.: Photoprotective strategies of
overwintering evergreens. – Bio Science 54: 41-49, 2004.
Aleric, K.M., Kirkman, L.K.: Growth and photosynthetic responses of the federally endangered shrub, Lindera melissifolia (Lauraceae), to varied light environments. – Am. J. Bot. 92:
682-689, 2005.
Asada, K.: The water-water cycle in chloroplasts: Scavenging of active oxygens and dissipation of excess photons. – Annu. Rev. Plant Phys. Plant Mol. Biol. 50: 601-639, 1999.
310 311 312 313 314 315 316 317 318 319 320 321 322 323 324 325 326 327 328 329
Bazzaz, F.A., Carlson, R.W.: Photosynthetic acclimation to variability in the light environment of
early and late successional plants. – Oecologia 54: 313-316, 1982.
Björkman, O., Demmig, B.: Photon yield of O2 evolution and chlorophyll fluorescence
characteristics at 77 K among vascular plants of diverse origins. – Planta 170: 489-504, 1987. Boardman, N.K.: Comparative photosynthesis of sun and shade plants. – Annu. Rev. Plant
Physiol. 28: 355-377, 1977.
Brodribb, T.J., McAdam, S.A.M., Jordan, G.J., Field, T.S.: Evolution of stomatal responsiveness to CO2 and optimization of water-use efficiency among land plants. – New Phytol. 165: 839-846, 2005.
Cavender-Bares, J., Bazzaz, F.A.: From leaves to ecosystems: Using chlorophyll fluorescence to
assess photosynthesis and plant function in ecological studies. – In: Papageorgiou, G.C.,
Govindjee (eds.): Chlorophyll Fluorescence: A Signature of Photosynthesis. Pp. 737-755.
Kluwer Academic Publ., Dordrecht 2004.
Chabot, B.F., Chabot, J.F.: Effects of light and temperature on leaf anatomy and photosynthesis in
Fragaria vesca. – Oecologia 26: 363-377, 1977.
Cheng, L., Fuchigami, L.H., Breen, P.J.: The relationship between photosystem II efficiency and
quantum yield for CO2 assimilation is not affected by nitrogen content in apple leaves. – J.
Exp. Bot. 52: 1865-1872, 2001.
Coopman, R.E., Reyes-Díaz, M., Briceño, V.F., Corcuera, L.J., Cabrera, H.M., Bravo, L.A.:
Changes during early development in photosynthetic light acclimation capacity explain the
shade to sun transition in Nothofagus nitida. – Tree Physiol. 28: 1561-1571, 2008. 330 331 332 333 334 335 336 337 338 339 340 341 342 343 344 345 346 347 348 349 350
Cornic, G., Briantais, J.M.: Partitioning of photosynthetic electron flow between CO2 and O2
reduction in a C3 leaf (Phaseolus vulgaris L.) at different CO2 concentrations and during
drought stress. – Planta 183: 178-184, 1991.
D’Ambrosio, N., Arena, C., Virzo De Santo, A.: Temperature response of photosynthesis,
excitation energy dissipation and alternative electron sinks to carbon assimilation in Beta
vulgaris L. – Environ. Exp. Bot. 55: 248-257, 2006.
Dai, Y., Shen, Z., Liu, Y., Wang, L., Hannaway, D., Lu, H.: Effects of shade treatments on the
photosynthetic capacity, chlorophyll fluorescence, and chlorophyll content of Tetrastigma
hemsleyanum Diels et Gilg. – Environ. Exp. Bot. 65: 177-182, 2009.
Demmig-Adams, B., Adams, W.W., III: The role of xanthophyll cycle carotenoids in the
protection of photosynthesis. – Trends Plant Sci. 1: 21-26, 1996.
Demmig-Adams, B., Adams, W.W., III, Barker, D.H., Logan, B.A., Bowling, D.R., Verhoeven,
A.S.: Using chlorophyll fluorescence to assess the fraction of absorbed light allocated to
thermal dissipation of excess excitation. – Physiol. Plant. 98: 253-264, 1996.
Earl, H.J., Tollenaar, M.: Relationship between thylakoid electron transport and photosynthetic CO2
uptake in leaves of three maize (Zea mays L.) hybrids. – Photosynth. Res. 58: 245-257, 1998. Franco, A., Lüttge, U.: Midday depression in savanna trees: Coordinated adjustments in
photochemical efficiency, photorespiration, CO2 assimilation and water use efficiency. –
Oecologia 131: 356-365, 2002.
Givnish, T.J.: Adaptation to sun and shade: A whole-plant perspective. – Aust. J. Plant Physiol. 351 352 353 354 355 356 357 358 359 360 361 362 363 364 365 366 367 368 369 370
15: 63-92, 1988.
Ghannoum, O., Conroy, J.P., Driscoll, S.P., Paul, M.J., Foyer, C.H., Lawlor, D.W.: Nonstomatal
limitations are responsible for drought-induced photosynthetic inhibition in four C4 grasses. –
New Phytol. 159: 599-608, 2003.
Griffin, J.J., Ranney, T.G., Pharr, D.M.: Photosynthesis, chlorophyll fluorescence, and
carbohydrate content of Illicium taxa grown under varied irradiance. – J. Amer. Soc. Hort.
Sci. 129: 46-53, 2004.
Hall, N.P., Keys, A.J.: Temperature dependence of the enzymic carboxylation and oxygenation of
ribulose 1,5-bisphosphate in relation to effects of temperature on photosynthesis. – Plant
Physiol. 72: 945-948, 1983.
Haworth, M., Elliott-Kingston, C., McElwain, J.C.: Stomatal control as a driver of plant
evolution. – J. Exp. Bot. 62: 2419-2423, 2011.
Hölscher, D., Leuschner, C., Bohman, K., Hagemeier, M., Juhrbandt, J., Tjitrosemito, S.: Leaf
gas exchange of trees in old-growth and young secondary forest stands in Sulawesi,
Indonesia. – Trees 20: 278-285, 2006.
Huang, J., Boerner, R.E.J., Rebbeck, J.: Ecophysiological responses of two herbaceous species to
prescribed burning, alone or in combination with overstory thinning. – Am. J. Bot. 94:
755-763, 2007.
Kakani, V.G., Surabhi, G.K., Reddy, K.R.: Photosynthesis and fluorescence responses of C4 plant
Andropogon gerardii acclimated to temperature and carbon dioxide. – Photosynthetica 46:
371 372 373 374 375 376 377 378 379 380 381 382 383 384 385 386 387 388 389 390
420-430, 2008.
Kato, M.C., Hikosaka, K., Hirotsu, N., Makino, A., Hirose, T.: The excess light energy that is
neither utilized in photosynthesis nor dissipated by photoprotective mechanisms determines
the rate of photoinactivation in photosystem II. – Plant Cell Physiol. 44: 318-325, 2003. Krall, J.P., Edwards, G.E.: Quantum yields of photosystem II electron transport and carbon
dioxide fixation in C4 plants. – Aust. J. Plant Physiol. 17: 579-588, 1990.
Krall, J.P., Edwards, G.E.: Relationship between photosystem II activity and CO2 fixation in
leaves. – Physiol. Plant. 86: 180-187, 1992.
Kubien , D.S., Sage, R.F.: Low-temperature photosynthetic performance of a C4 grass and a
co-occurring C3 grass native to high latitudes. – Plant Cell Environ. 27: 907-916, 2004.
Lambers, H., Chapin, F.S., Pons, T.L.: Plant Physiological Ecology. – Springer, New York 1998. Li, X.P., Björkman, O., Shih, C., Grossman, A.R., Rosenquist, M., Jansson, S., Niyogi, K.K.: A
pigment-binding protein essential for regulation of photosynthetic light harvesting. – Nature
403: 391-395, 2000.
Lüttge, U.: Cyanobacterial Tintenstrich communities and their ecology. – Naturwissenschaften
84: 526-534, 1997.
Makino, A., Miyake, C., Yokota, A.: Physiological functions of the water-water cycle (Mehler
reaction) and the cyclic electron flow around PSI in rice leaves. – Plant Cell Physiol. 43:
1017-1026, 2002.
Maxwell, K., Johnson, G.N.: Chlorophyll fluorescence- a practical guide. – J. Exp. Bot. 51: 659-391 392 393 394 395 396 397 398 399 400 401 402 403 404 405 406 407 408 409 410
668, 2000.
Miyake, C., Okamura, M.: Cyclic electron flow within PSII protects PSII from its photoinhibition
in thylakoid membranes from spinach chloroplasts. – Plant Cell Physiol. 44: 457-462, 2003. Oberhuber, W., Dai, Z.Y., Edwards, G.E.: Light dependence of quantum yields of Photosystem II
and CO2 fixation in C3 and C4 plants. – Photosynth. Res. 35: 265-274, 1993.
Oberhuber, W., Edwards, G.E.: Temperature dependence of the linkage of quantum yield of
photosystem II to CO2 fixation in C4 and C3 plants. – Plant Physiol. 101: 507-512, 1993. Pearcy, R.W., Sims, D.A.: (1994) Photosynthetic acclimation to changing light environments:
Scaling from the leaf to the whole plant. – In: Caldwell, M.M., Pearcy, R.W. (eds):
Exploitation of Environmental Heterogeneity by Plants: Ecophysiological Processes
Above-and Belowground. Pp. 145-174. Academic Press, San Diego 1994.
Pérez-Torres, E., Bravo, L.A., Corcuera, L.J., Johnson, G.N.: Is electron transport to oxygen an
important mechanism in photoprotection? Contrasting responses from Antarctic vascular
plants. – Physiol. Plant. 130: 185-194, 2007.
Peterson, R.B.: Regulation of electron transport in photosystems I and II in C3, C3-C4, and C4
species of Panicum in response to changing irradiance and O2 levels. – Plant Physiol. 105:
349-356, 1994.
Ripley, B.S., Gilbert, M.E., Ibrahim, D.G., Osborne, C.P.: Drought constraints on C4
photosynthesis: Stomatal and metabolic limitations in C3 and C4 subspecies of Alloteropsis
semialata. – J. Exp. Bot. 58: 1351-1363, 2007.
411 412 413 414 415 416 417 418 419 420 421 422 423 424 425 426 427 428 429 430
Robinson, J.M.: Nitrite photoreduction in vivo is inhibited by oxygen. – Plant Physiol. 92:
862-865, 1990.
Roháček, K., Barták, M.: Technique of the modulated chlorophyll fluorescence: Basic concepts,
useful parameters, and some applications. – Photosynthetica 37: 339-363, 1999.
Stuhlfauth, T., Scheuermann, R., Fock, H.P.: Light energy dissipation under water stress
conditions: Contribution of reassimilation and evidence for additional processes. – Plant
Physiol. 92: 1053-1061, 1990.
Sun, G.C., Zeng, X.P., Liu, X.J., Zhao, P.: Effects of moderate high-temperature stress on
photosynthesis in three saplings of the constructive tree species of subtropical forest. – Acta
Ecol. Sin. 27: 1283-1290, 2007.
Taiz, L., Zeiger, E. (eds.): Photosynthesis. Plant Physiology 4rd. Pp. 126-158. Sinauer Associates
Inc. Publ., Sunderland 2006.
Valladares, F., Pearcy, R.W.: Interactions between water stress, sun-shade acclimation, heat
tolerance and photoinhibition in the sclerophyll Heteromeles arbutifolia. – Plant Cell Environ.
20: 25-36, 1997.
Vavasseur, A., Raghavendra, A.S.: Guard cell metabolism and CO2 sensing. – New Phytol. 165: 665-682, 2005.
Verhoeven, A.S., Adams, W.W., III, Demmig-Adams, B.: The xanthophyll cycle and acclimation
of Pinus ponderosa and Malva neglecta to winter stress. – Oecologia 118: 277-287, 1999. Weng, J.H.: Relationship between allocation of absorbed light energy in PSII and photosynthetic 431 432 433 434 435 436 437 438 439 440 441 442 443 444 445 446 447 448 449 450
rates of C3 and C4 plants. – Acta Physiol. Plant. 31: 639-647, 2009.
Yu, Q., Zhang, Y.-Q., Liu, Y.-F., Shi, P.-L.: Simulation of the stomatal conductance of winter
wheat in response to light temperature and CO2 changes. – Ann. Bot. 93: 435-441, 2004. Zhang, S.B., Hu, H., Xu, K., Li, Z.R., Yang, Y.P.: Flexible and reversible responses to different
irradiance levels during photosynthetic acclimation of Cypripedium guttatum. – J. Plant
Physiol. 164: 611-620, 2007.
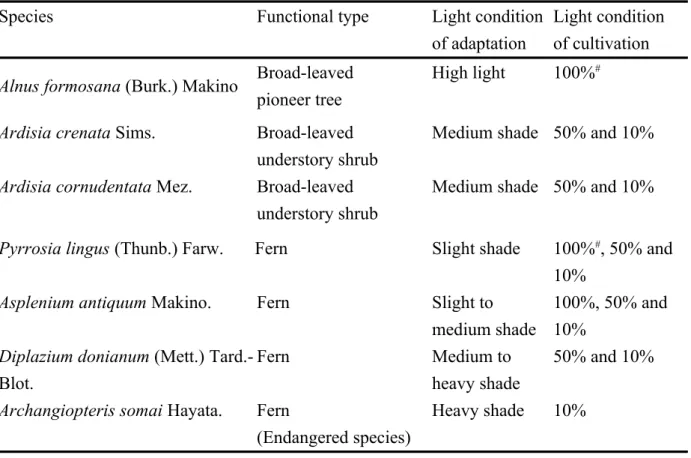
Table 1. Tested species and their functional type, adapted light condition and light condition of
cultivation (% of full sunlight) of materials.
Species Functional type Light condition
of adaptation
Light condition of cultivation
Alnus formosana (Burk.) Makino Broad-leaved
pioneer tree
High light 100%#
Ardisia crenata Sims. Broad-leaved
understory shrub
Medium shade 50% and 10%
Ardisia cornudentata Mez. Broad-leaved understory shrub
Medium shade 50% and 10%
Pyrrosia lingus (Thunb.) Farw. Fern Slight shade 100%#, 50% and
10%
Asplenium antiquum Makino. Fern Slight to
medium shade
100%, 50% and 10%
Diplazium donianum (Mett.)
Tard.-Blot.
Fern Medium to
heavy shade
50% and 10%
Archangiopteris somai Hayata. Fern
(Endangered species)
Heavy shade 10%
#: measured under 15, 20, 25 and 30°C, the others were measured under 25°C. 451 452 453 454 455 456 457 458 459
PPFD 0 500 1000 1500 2000 0 5 10 15 20 25 PPFD 0 500 1000 1500 2000 0.0 0.2 0.4 0.6 0.8 PPFD 0 500 1000 1500 2000 PPFD 0 500 1000 1500 2000 PPFD 0 500 1000 1500 2000 PPFD 0 500 1000 1500 2000 PN [ m ol (C O2 ) m -2 s -1] P S II PPFD [mol m-2 s-1] 0 500 1000 1500 2000 -0.1 0.0 0.1 0.2 0.3 0.4 0 500 1000 1500 2000 0 500 1000 1500 2000 0 500 1000 1500 2000 gs [m ol (H 2 O ) m -2 s -1] A B C D E F G H I J K L
Fig. 1. The responses of net photosynthetic rate (PN), PSII efficiency (ΦPSII) and stomatal
conductance (gs) to photosynthetical photon flux density (PPFD) for Alnus formosana( ),
Pyrrosia lingus (squares), Asplenium antiquum (circles), Diplazium donianum (diamonds), Archangiopteris somai (stars), Ardisia cornudentata (upward triangles) and Ardisia crenata
(downward triangles) cultivated under 100% (open symbols), 50% (cross symbols) and 10%
(closed symbols) of sunlight. Measurements were made from 0 to 2,000 μmol m–2 s–1 PPFD and
25°C. Each point represents the mean value of 4–6 leaves. Data are mean SD. 460 461 462 463 464 465 466 467 468 469
10 20 30 40 60 80 0 500 1000 1500 2000 10 20 30 40 60 80 0 500 1000 1500 2000 A B C D E T R / P G PPFD [mol m-2 s-1]
Fig. 2. The responses of ratio of electron transport rate to gross photosynthetic rate (ETR/PG) to
photosynthetic photon flux density (PPFD) for Alnus formosana ( ), Pyrrosia lingus (squares),
Asplenium antiquum (circles), Diplazium donianum (diamonds), Archangiopteris somai (stars), Ardisia cornudentata (upward triangles) and Ardisia crenata (downward triangles) cultivated
under 100% (open symbols), 50% (cross symbols) and 10% (closed symbols) of sunlight.
Measurements were made from 100 to 2,000 μmol m–2 s–1 PPFD and 25°C. Each point represents
the mean value of 4–6 leaves. Data are mean SD. 470 471 472 473 474 475 476 477
ETR 0 50 100 150 200 0 5 10 15 20 25 ETR 0 50 100 150 200 0 5 10 15 20 25 0 50 100 150 200 PG [ m ol (C O2 ) m -2 s -1 ] 0 5 10 15 20 25 0 50 100 150 200 0 5 10 15 20 25 ETR ( mol e- m-2 s-1 ) y = 1.001+ 0.134 x r2 = 0.990*** Y = 0.207 + 0.099 X r2 = 0.941*** (for 4 ferns, solid line)
y = -0.341 + 0.134 x r2 = 0.990***
y = -0.635 + 0.097 x r2 = 0.934*** (for 4 ferns, solid line)
y = -0.724 + 0.117 x r2 = 0.832*** y = -1.366 + 0.117 x r2 = 0.796*** ETR [mol(e-) m-2 s-1 ] 0 50 100 150 200 0 5 10 15 20 25 0 50 100 150 200 0 5 10 15 20 25 y = -0.064 + 0.104 x r2 = 0.896*** y = -0.835 + 0.102 x r2 = 0.878*** A B C D E F PN [ m ol (C O2 ) m -2 s -1 ]
Fig. 3. The relationships between gross photosynthetic rate (PG) and electron transport rate (ETR),
and between net photosynthetic rate (PN) and ETR for Alnus formosana ( ), Pyrrosia lingus
(squares), Asplenium antiquum (circles), Diplazium donianum (diamonds), Archangiopteris
somai (stars), Ardisia cornudentata (upward triangles) and Ardisia crenata (downward triangles)
cultivated under 100% (open symbols), 50% (cross symbols) and 10% (closed symbols) of
sunlight. Measurements were made under 25°C and from 0 to 2,000 μmol m–2 s–1 photon flux 478 479 480 481 482 483 484
density. Each point represents the mean value of 4–6 leaves. The dotted line in panel A and B was
copied from panels C and D, respectively. ***: p < 0.001.
TEMPERATURE [oC] 15 20 25 30 E T R /P G 4 6 8 10 12 y = 3.036 + 0.272 x r2 = 0.985** y = 6.633 - 0.162 x + 0.007 x2 r2 = 0.998*
Fig. 4. The relationship between ratio of ETR/PG and leaf temperature of 100% sunlight-grown
Alnus formosana ( ) and Pyrrosia lingus (
□
). Each point represents the mean value of 4–6 leaves measured at 100, 200, 400, 800, 1,200 and 2,000 μmol m–2 s–1 photon flux density. Data aremean SD. * and **: p < 0.05, p < 0.01, respectively. 485 486 487 488 489 490 491 492
25¥þ
ESTIMATED P
G[mol(CO
2) m
-2s
-1]
0
5
10
15
20
25
30
M
EA
SU
R
ED
P
G[
m
ol
(C
O
2) m
-2s
-1]
0
5
10
15
20
25
r
2= 0.916***
0
5
10
15
20
25
30
r
2= 0.964***
Pyrrosia lingus
Alnus formosana
Fig. 5. Relationship between measured and estimated gross photosynthetic rate (PG) [from PG =
ETR/(3.036 + 0.272T) for Pyrrosia lingus, and PG = ETR/(6.633 – 0.162T + 0.007T2) for Alnus
formosana, where T is leaf temperature].
●
, ▲, △ and○
were measured at 15, 20, 25 and 30°C, respectively; each point represents the value of each leaf measured under each level (0–2,000μmol m–2 s–1) of photon flux density. ***: p < 0.001. 493 494 495 496 497 498


![Fig. 5. Relationship between measured and estimated gross photosynthetic rate (P G ) [from P G = ETR/(3.036 + 0.272T) for Pyrrosia lingus, and P G = ETR/(6.633 – 0.162T + 0.007T 2 ) for Alnus formosana, where T is leaf temperature]](https://thumb-ap.123doks.com/thumbv2/9libinfo/8987686.283006/29.892.106.537.119.844/relationship-measured-estimated-photosynthetic-pyrrosia-alnus-formosana-temperature.webp)
