Investigation of Netw
Department of m09 Abstract—Many factors affected the supply c almost based on inter-organizational relations supply chain scholars used social network anal communication between partners and figure ou network communication pattern, especially au With SNA, the study finds out core-periphe explores four sub-groups (competition, co-desig knowledge-sharing and proprietorship) in a network. Centrality is associated with perceiv function positively. The research suggested th organizational performance are associated with network; central firms are more likely to perceiv performs well than those on the periphery. Keywords-IORs; social network analysis; autom
I. INTRODUCTION (HEADIN What makes a supply chain work suc common-sense and empirical evidence following features to supply chain suc having a formal structure, strong leadership participation, collaboration, well informati information quality, IT enabler, partnership, [34] [48] [50] [51]. Many factors are almost organizational relationships (IORs)” for Social network analysis (SNA), a set techniques designed to study connections am and organizations [12] [18] [30] [40] [47]. F scholars used SNA to map communication and figure out the supply chain network pattern, especially automobile industry. Thi study which illustrates the application of SN if organization position in supply chain netw with perception of supply chain network p success and explore whether network affect IORs and information-sharing?
II. AUTOMOBILE INDUSTRY IN T
In 1953, the first Taiwanese ca corporation, Yulon Motors, was founded by Yen. Automobile industry needs cross-ind from other industry such as chemicals, ste electrical engineering etc. At present, there auto-assemblers who are responsible to fab Kuozui Motor Ltd., Yulon Motors,
work Structure in Taiwan Automobile In
Chang-Jan Yu Ting-Lin LEE
of Asia-Pacific Industrial and Business Management
National University of Kaohsiung Kaohsiung, Taiwan
67105@nuk.edu.twlinda_lee@nuk.edu.tw
chain network are ships (IORs). Few lysis (SNA) to map ut the supply chain utomobile industry. ery structure, and gn and developing,
large automobile ved organizational hat perceptions of the position in the ve the organization mobile industry NG 1) ccessfully? With suggesting the cessful running: p, active member ion sharing, well , etc [4] [28] [29] t based on “inter-further progress.
of theories and mong individuals Few supply chain between partners k communication s article is a case NA to determine work is associated performance and structure/features TAIWAN ar manufacturer y Mr. Tjing-Ling dustry supporting eel, rubber, glass, e are eight major abricate including China Motors
Corporation, Ford Lio Ho Motor Taiwan Co., Ltd., SANYANG In Motors Co., LTD., and Taiwan ISU to Industrial Economics & Know production value of automobile indu 120.7 billion whose growth rate compared to 2007[11].There ar accounting automobile shrinking instance, increasing material cost, so global economy and domestic polit forth. These causes affect consum Moreover, both auto-assemblers manufacturer also encounter the p competition individually, especia competition from China and other na
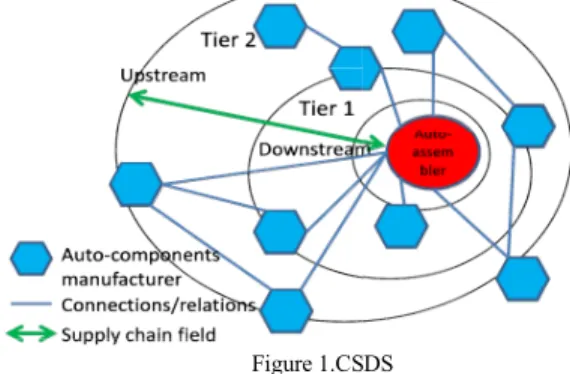
The auto industry has the effects Meanwhile, it needs long-term coop with upstream suppliers. This featu relationship supply chains for a long between auto-assemblers a manufacturers is like a relationsh provide reciprocal supporting. In T organizational connection network development system (CSDS)”whic assemblers [41]. Refer to Fig.1.
Figure 1.CS
That means each auto-assembl CSDS [41]. The author will attemp CSDS from the sample lists (more obtained difficulty from three auto-a They may support each othe techniques and personnel. The risi
ndustry
r Company Ltd., Honda ndustry Co., Ltd., Prince UZU. In 2008, according
ledge Center (IEK), the ustry approaches to NTˀ
decreases almost 14.7% re several causes for
sales in Taiwan, for oaring oil price, declining
tical chaos and so on so ers purchasing behavior. and auto-components pressure of international ally for the low-price
ations of Southeast Asia. s of the economy of scale. peration and development ure has resulted in close-g time. Close connections and auto-components hip network which may Taiwan, we call the
inter-k as “corporate synergy h is conducted by
DS
ler would have its own pt to analyze the different
detail in later paragraph) assemblers.
er in finance, logistics, ing and declining of car 2009 Advances in Social Network Analysis and Mining
industry in a country has an inseparable connection with its local upstream auto-component manufacturers.
Moreover, CSDS is a complicated multi-echelon network [41]. It has influence on operation activities in different tiers member of supply chain and possesses many uncertainties, integration, challenges as well. So, information sharing plays a critical role in the CSDS which can improve production efficiency and establish better collaboration and integration. However, information sharing alone is insufficient to guarantee superior supply chain performance [4]. For instance, divergent and opportunistic behavior of partners, informational asymmetries, willingness of sharing and fear of power loss in supply chain etc. would cause information quality. Therefore, bull-effect and collaboration-related problem in supply chain has possibility to be resolved imperfectly. Besides, without a foundation of great inter-organizational relationship, any efforts to manage the flow of information or material across the supply chain are likely to be failed [19].
All in all, the study adopts the inter-organizational relationship (IOR) issue and explores the connection situation within the industry with social network analysis approaches and techniques. Finally, we try to figure out whether organization position in CSDS is associated with perception of CSDS performance and success. The network approach generates unique information regarding structural features of communication and collaboration networks. It is important to explore the coordination, collaboration, competition, knowledge-sharing and even proprietorship among the organizations involved in CSDS. The study also provides valuable information for understanding what the ecosystem of CSDSs and tries to figure out the interaction between two CSDSs belong to different auto-assemblers.
While the CSDS members presumably share a primary goal (increasing competence, stable and long-tem transaction etc.), alliances among member or organizations may be partitioned by organization characteristics such as organization type, profit goal, sourcing of technology/skill, or different shareholder. To realize the factors that might guide communication and collaboration patterns of CSDS members, the study maps the inter-organizational collaborative relationships among the organizations in CSDS. In addition to collaborative relationship, we also measure coordination, competition, knowledge-sharing and proprietorship.
CSDS of automobile is the most consolidated and the most effective one [41]. Under massive competition from other nations and fluctuating/ unstable economy situation, the study would try to examine among members in the degree of that perceived success, perception of how well the CSDS functions, and perceptions of benefits that behind the progress.
III. INTER-ORGANIZATIONAL RELATIONSHIPS
Since the study considers the aspect of “relationship” as an important issue, we must realize inter-organizational relationship in order to capture the inter-firm relationship in CSDS.
Because of been exposing to extreme competition and dynamic environment recently, many firms are faced to great uncertainty about resources flow such as capital, material, equipment, and information. Under this condition, uncertainty prompts firms to establish and manage relationships in order to achieve stability, predictability, and dependability in their relations with others [33].
Inter-organizational relationships are the relatively enduring transactions, flows, and linkages that occur among or between organizations and one or more organizations in its environment [33].
Relationship starts with exchange behaviors in capturing critical or scarce resources between two or more organizations, which is the best way to share or learn special knowledge or skills [5]. By leveraging relationship among organizations, it can create competitive advantages for organization [13] [21]. That is to say, relationship in business environment have significantly impact on many firm’s operating strategies [49].
IT can be used to easily link physical supply chain process with partners, but not inter-organizational relationships. Handfield and Nichols Jr. addressed that “without a foundation of effective inter-organizational relationship, any effort to manage the flow of information or materials across the supply chain is likely to be unsuccessful” [19]. Trust and commitment played necessary factors to build long-term cooperative relationship between supply chain partners [36] [42]. Achrol et al. indentified commitment, trust, group cohesiveness, and motivation of alliance partnership as critical to inter-organizational strategic alliance [2]. Also, good inter-organizational relationships based on trust, commitment, and shared vision is necessary to overcome information sharing-related problems in supply chain [6]. And, inter-organization relationship refers to the degree of trust, commitment, and shared vision between supplier companions [28].In this research, following the antecedent literature studies, we will consider inter-organizational relationships as containing three sub-dimensions: trust in trading partners, commitment of trading partners, and shared vision among trading partners.
IV. THE SOCIAL NETWORK APPROACH
Social network analysis (SNA) has recently become of interest to scientists from a broad range of different fields as well as in management [9] and has been used to model many complex real world phenomena. Also, it is a methodology for describing and analyzing the interrelationships of units or nodes within a network. The nodes of the networks can be individuals, a group of individual such as a department within an organization, or organizations within a larger network such as supply chain [10]. It contains set of techniques developed to study how individuals, communities, organizations, and other entities connect and interact with one another [12] [22] [40] [47]. Thus, formal measures of networks characteristics have been developed by social network theorists that facilitate the development of
testable models (see Wasserman and Faust, 1994) and several frameworks in economics and management are increasingly incorporating a network-based perspective in their analysis. Measures are available at the node level, the group level, and at the network-level. [31] The two concepts or measures most used in network analysis are network density and centrality (degree, closeness and betweenness) [47]. It lets us to know how to locate central agents, find groups, identify positions, and describe overall network properties.
A. Density
Social networks often include dense area of nodes who “stick together” [32]. The density of a network is an examination of how many correlations there are between actors compared to the maximum possible number of connections that exist between actors. It takes on a value between 0 and 1. When density is close to 1, the network is considered dense; otherwise it is sparse.
In the social network literatures there are a lot of debates about the impact of network structures and their features, that is, sparse (dense) networks and strong (weak) ties, on firm performance. Dense networks may provide communication pathways by which information and resources can be channeled effectively. Other research has shown that too much density can restrict access to outside resources or sources of information and retard adoption of best practices [44]. And, in some cases, larger and more communicative coalition networks might not lead to effective collaborations [20]. About string and weak ties, according to one view, strong ties in a highly interconnected alliances network negatively impact firm performance [38] and weak ties positively impact firm technological performance [23][39]. And according to an alternative viewpoint, however, strong network ties provide better impact on firm performance than weak ties [21] [25] [27] [43].
Quite few researches discussed the relationship between inter-organizational relationships (IORs) and network structure/features simultaneously.
The first research question is whether network structure/features in the CSDS affect IORs and information-sharing?
B. Centrality
Centrality indicates the degree to which a firm has succeeded in developing a dominant position in the overall network of inter-firm partnerships. The centralization, or the centrality, of the entire network measures the distribution of centrality among firms in a network. It measures the extent to which a focal firm is more central than all other firms in the network.
Social network scholars distinguish between three measures of centrality: degree, closeness and betweenness [47]. Degree centrality simply reflects the total number of collaborative ties (scores) that a firm formed in a period. A firm with more ties is considered to be closer to the center of the network and have more opportunities to play an essential role in the network. In contrast, a firm with a low
degree of centrality is considered to be isolated from other firms, and consequently expected to play a marginal role in the network. While the degree centrality takes into account only the number of direct ties that a node has, the closeness centrality also considers indirect ties (which are not directly connected to that node). In formal terms, closeness measures the centrality of a point by summing the geodesic distances from that point to all other points in the network. If a firm has high closeness centrality in a network, this means that it is close to most of the other firms, and hence is able to avoid the control of others [15]. To explain betweenness centrality, we have already known degree and closeness centrality are based on the reachability of an actor in the network, however, betweenness centrality may be to what extent an actor dominates the flow of information because of his position within a network. A node with few ties may play an important intermediary role and so be very central to the network. It measures the number of geodesics (a geodesic is the shortest path between any particular pair of nodes in a network), and consequently the extent to which a firm, landing on the shortest path between two other companies, has a potential for control. So Betweenness centrality finds the node in a position where it is acting as a” bridge “from one node/group of nodes to another.
Following the statement of centrality concept above, we might known that many positions can be indentified including isolates, group members, bridges, and central nodes. A lot of studies suggested that centrality is correlated with perceived organizational performance (e.g. [14] [26] [35]). According to the diffusion of innovations theory [37], central nodes in the organization would be associated with positive perceptions of organizational functioning and performance for several reasons: first central nodes learn about information and others’ attitudes and actions at much quicker than other nodes and thus may have more positive perceptions of organizational functioning [37]. Second, central nodes possess an inherent bias to support the status quo of the organization so their advantage positions are maintained [46]. Third, central nodes may utilize inappropriate influence on others in the network such that their perceptions become the dominant view of the organizational culture [16].
The second question of study is network position in the CSDS is associated with perceptions/evaluations of CSDS function and performance? Thus, it is hypothesized that central organizations in the CSDS will perceive that the network functions well by being inclusive, has clear leadership, and can effectively take actions. It is also hypothesized that members of central organizations will be less likely to perceive problems attaining CSDS goals and more likely to perceive the CSDS to be successful compared to members of non-central organizations.
The industry may have sub-groups or clusters that might impede the flow of information within industry.
Finally, the third question of study is there any sub-group (-relationship) within automobile industry? If yes, are
they positively/negatively correlated with information-sharing?
V. METHODOLOGY
A. Questionnaire design
Before designed the questionnaire, we arranged three times interview with three major auto-assemblers (two times for two auto-assemblers by face to face; one for one by e-mail). We provide interview outline in advance, which about the present situation of CSDS, the way to interact with auto-components manufacturers, the way to maintain the relationship with auto-components manufacturers, how to collaborate with auto-components manufacturers, what relationship types exist between them such as competition, co-design and developing, knowledge-sharing and proprietorship, and the perception of function or success in the CSDS.
The questionnaire of study is modified from and refers to other researchers’ works [17] [45]. The questionnaire includes three main parts. And the questionnaire will be filled by at least one representative one firm who is responsible for procurement department or sales department (those have the experience or familiar to CSDS operations and activities and manager preferred). The first part is about network measurement. The study measures the transaction network with suppliers and buyers, and asks firm representative to write down the transaction partners and rate the frequency of contact ranging from 1 to 7. Also, four types of relationship the study arranged will be used to find out the sub-group in the automobile industry. These four types of relationship are based on the interview with three major auto-assemblers. The same way, firm representative are ask to write down the firms for each type of relationship respectively without rating contacting frequency.
The second part of questionnaire is about the survey of inter-organizational relationships (IORs) within the automobile industry. We use Likert-type scales to measure IORs, including trust, commitment, and shared vision. Trust is measured with five 7-points Likert items. Commitment and shared vision are measured with five and three 7-points Likert items respectively. These items are based on Li & Lin, 2006. Third part is about degree of that perceived success, perception of how well the CSDS functions, and perceptions of benefits that behind the progress. Organizational function is measured with seven 5-points Likert items asking firm representatives to indicate how much they agree or disagree with following statements: (1) every CSDS members is involved in discussion, not just a few; (2) the CSDS is hierarchically managed (top-down decision-making); (3) the CSDS meetings are organized and efficient; and so on [20][45]. Perception of benefits is measured with five 5-points Likert items asking “how well the benefits that firms obtained from CSDS such as financial, human resources, physical support, power of negotiation with government, and flexible reaction?” [45]
Perception of success is measured with seven 5-points Likert items asking “how successful has firm achieved the
specific performance within CSDS such as implementing cost-leading strategies, shortening the delivering time, quality improvement, learning about dynamic industrial information, obtaining management or production techniques, stable order/sourcing, and becoming more competitive?”
In addition to three parts above, the survey measured organizational characteristics (firm name, size, capital, major product, length of time been involved in CSDS, attendance meeting frequency in CSDS) and firm position (auto-assembler or auto-component manufacturer) and firm representative information (department, job position).
The pre-testing is necessary for the data collection. In pre-testing stage, all items for each construct and items for network data collection were reviewed by two academicians and revaluated through structured interviews with three practitioners who were asked to comment on the appropriateness of the whole questionnaire structure. Based on the feedback from these academicians and practitioners, redundant and ambiguous items were modified, simplified or eliminated. Since items were modified by practitioners who are familiar to CSDS operations and activities, it is believed that this could have lowered method variance and avoided unnecessary errors.
B. Sample
The firm list is collected from three major auto-assemblers. They provided their firm list partially. Boundary specification may seriously influence the structure of a network, so it is worth to consider if carefully [32]. We also refer to the membership directory 2008 published by Taiwan transportation vehicle manufacturers association (TTVMA) [1].The directory include only manufacturers who have registered for membership prior to the end of December 2007. The amounts of auto-assemblers and auto-components manufacturers are 476. If research proceeds to study the entire world, the network will too large to be carried out [32]. So, the study will use the member list provided from three majors which about 330. Due to the survey item (perceptions of CSDS function and performance) of this study, we cannot help deleting some firm who did not have the operations/activities experience within the CSDS through phone check. What’s more, some list is not domestic company in Taiwan, some is bankrupt and some is overlapping. All of above not qualified should be discarded. Adding the rest of five auto-assemblers, our final sample includes 8 auto-assemblers and 192 auto-components manufacturers, 200 in sum. There are 32 qualified lists is not membership in TTVMA. Besides the assemblers, sample list include engine, engine electronics, fueling system, intake &exhaust system, cooling system, lubrication system, air-conditioning system, body stamping, transmission, steering system, suspension system, braking system, wheeling system, lamp, electric & electronic, exterior trim, interior trim, fastener, raw material companies as well.
In the first stage, some of the firms received the questionnaire by mail, and the rest were delivered directly in person. Meanwhile, we collected a few personally. At the same time, the author reminded company to fill the
questionnaire, and send it back as soon as possible. Then, in the second stage, because of extremely low response rate, we are going to deliver the questionnaire directly. At the same moment, one of three auto-assembler help authors to deliver questionnaire. Finally, authors got acceptable response rate.
C. Analytical approach
The study will use factor analysis to determine whether the scales were uni-demensional or multi-dimensional such as perception of function, benefit and performance/success and IOR items as well. In addition to factor analysis, we also conduct the Cronbach’s alphas coefficient to measure internal consistency reliability, and check whether items belonging to each construct such as trust, commitment, and shared vision. And see if each construct are reliable within the acceptable interval (upper to 0.7 high reliability; 0.7~0.35 acceptable; lower than 0.35 low reliability). Non-response bias will be assessed by verifying that early and late respondents were not significantly different based on respondent’s return date [3].
The research uses the network software UCINET 6.205[8] to analyze firm’s network indicators, including degree, closeness, and betweenness centrality. Dou to different stress on network, these indicators separately provide insight on how and for what they communicate with one another. We will report density and centralization scores, and conduct the core-periphery analysis [7] [8] for understanding the network position. As soon as possible, these variables will be used to construct network structure graph and data with Pajek [32]. We are also eager to explore the different CSDS, and to figure out and compare the network characteristics belonging to them. Then, the study is going to analyze the four possible sub-groups with some SNA techniques for further insight.
Finally, we will regress perceived function, benefit, and success on participation and centrality in three possible CSDS. The analysis is exploratory and since this is a case study. With the approach, the author hopes to presume that the structure or pattern of ties in a social network is meaningful to the researcher and even practitioners.
VI. CURRENT ANALYSIS RESULT
A. Sample charactristics
Of the 71 respondents, returning from mail (n=26), e-mail (n=2), in person (n=21) and one auto-assembler help (n=22), representing 56 firms completed the survey. At least one representative stands for one firm. That means there are proportional overlaps of firms from above four returning methods. Three respondents is invalid response and one firm is excluded. The total response rate is 27.5% (55/200), containing 3 auto-assemblers and 52 auto-component manufacturers.
The table I will present the characteristics of the responding firms. On average, firms’ employee amount falls into 50-100 people (average 2.91where 1=less than 50, 2=50-100, 3=101-300, 4=301-500, 5=more than 501). It is about 38.2 percent of responding firms have employee in the interval 100-300. Many responding firms’ capital is more
than 10 million (average4.80 where 1=less than 1million, 2=more than 1million, 3=more than 5 million, 4=more than 10 million, 5=more than 30 million NT$). Most of firms have over 30 million capitals which are close to 86%. Firms’ established years is about11-15years (average 3.91 where 1=less than 5 years, 2=6-10 years, 3=11-15 years, 4=more than 16 years). And 92.7 percent of firms have established for over 16 years. Respondents have attended CSDS for 11-15years (average 3.60 where 1=less than 5 years, 2=6-10 years, 3=11-15 years, 4=more than 16 years).76.4 percent of firms have attended for over 16 years. Respondents indicated 1-6 times CSDS meeting last years (average 2.65 where 1=less than 5 times, 2=6-10 times, 3=11-20 times,4=21-30 times ,5=more than 31 times). And 32.7 percent of firms are in interval 11-20 times, 30.9 percent of firms are in interval 6-10 times.
TABLE I. DEMOGRAFICS STATISTICS
Mean(S.D.) Range
employee 2.91(1.251) 1-5
capital 4.80(.524) 1-5
Established years 3.91(.348) 1-4 Involved length 3.60(.807) 1-4 Involved frequency/per year 2.65(1.250) 1-5
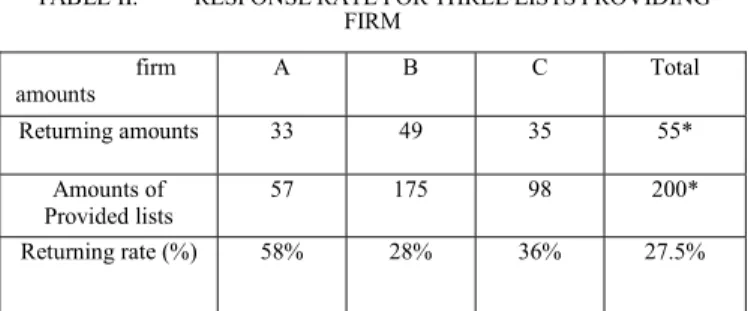
The following table II stands for each CSDS response rate from three auto-assemblers respectively. Firm A has highest response rate 58%, firm C is second highest about 28% and firm B get lowest 36% which might be caused by too large amounts of provided lists.
TABLE II. RESPONSE RATE FOR THREE LISTS PROVIDING FIRM firm amounts A B C Total Returning amounts 33 49 35 55* Amounts of Provided lists 57 175 98 200* Returning rate (%) 58% 28% 36% 27.5%
Footnote:*There are overlaps in total returning amounts and provided lists by these three firms
Next, we conduct the statistics analysis to make certain that nonresponse bias is absent. The respondents were separated into two groups relied on the specific date of return. It shows no significant difference between the two types based on the independent sample t-test (p=0.51 and 0.711, respectively). Consequently, it is no doubt that non-response bias would not be a trouble in the research.
B. Factor analysis and reliability/validity analysis
The items in the questionnaire are exerted to measure the trust, commitment, and shared vision. In addition to IOR items, we also exam whether the scales were uni-demensional or multi-dimensional such as perception of function, benefit and performance/success which extraction method is principle component method, and rotation method is varimax method. After factor analysis, we conduct the Cronbach’s alphas coefficient to measure internal
consistency reliability for each construct. Following tables III shows the result of factor analysis and cronbach’s alpha coefficient for each construct. The study subtracted two items from trust and commitment construct because of too small factor loadings (<0.5).
TABLE III. ANALYSIS OF IOR CONSTRUCT Construct Original number of items Number of Items after factor analysis Cronbach’s alpha Trust 5 4 0.792 Commitment 5 4 0.667 Shared vision 3 3 0.928
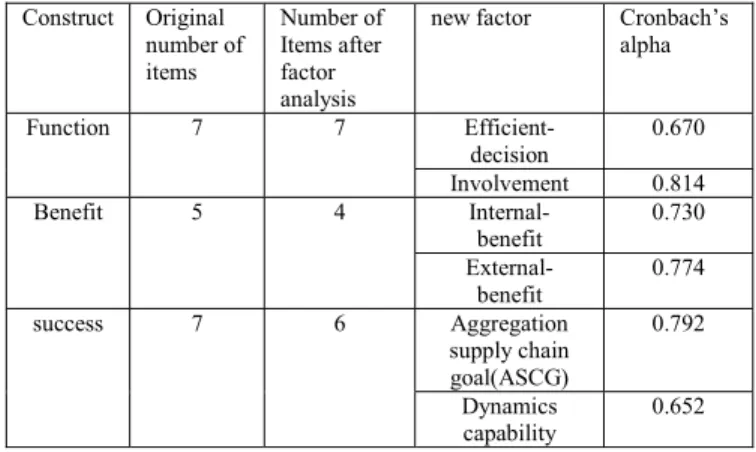
The study deleted two items from perception of benefit and success and extracted six new factors from these three sections. The internal-benefit contains financial and human resources; the external includes negotiation power with government and common flexible reaction. The aggregation supply chain goal stands for implementing cost-leading strategies, shortening the delivering time, and quality improvement. Dynamics capability represents learning about dynamic industrial information, obtaining management or production techniques, and becoming more competitive. Refer to table IV.
TABLE IV. ANALYSIS OF FUNCTION, BENEFIT AND SUCCESS Construct Original number of items Number of Items after factor analysis
new factor Cronbach’s alpha Function 7 7 Efficient- decision 0.670 Involvement 0.814 Benefit 5 4 Internal- benefit 0.730 External- benefit 0.774 success 7 6 Aggregation supply chain goal(ASCG) 0.792 Dynamics capability 0.652
All above of cronbach’s alpha were located within the acceptable range. In light of validity, the content of the questionnaire is based on both theories and past similar research. Besides, questionnaire was pretested with two academicians and revaluated through structured interviews with three practitioners in automobile industry. The procedures lead to some item modification. From this view, validity should be established.
VII. ADVANCED ANALYSIS AND ANTICIPATED OUTCOME
A. Advanced analysis
After current confirmatory factor analysis, the study will conduct further network analysis such as following:
• All of firms should be classified into 5 categories based on practitioners such as frame, engine, body
stamping, electric & electronic, and exterior &interior trim.
• We will report density and centralization scores for these 3 CSDS network.
• The study will figure out the firm’s network indicators, including degree, closeness, and betweenness centrality. Dou to different stress on network, these indicators separately provide insight on how and for what they communicate with one another.
• Conducting network data extraction and ego network analysis in order to separate 3 auto-assemblers (focal firm) for advanced understanding variation in the behavior of focal firm and taking closer look at their local circumstance.
• conducting the core-periphery analysis for understanding the network position
• The study will regress efficient decision, involvement, internal-benefit, external-benefit, ASCG, dynamics capability and centrality in three possible CSDS.
B. Anticipated outcome
This is the first time that the study combines the sociological theory and inter-organizational relationship theory to investigate the supply chain issue. With the network perspective, it would give us totally different insight into industry structure from micro to macro. Traditionally, most see supply chain as single vertical or horizontal relation, however, network perspective bring a brand new insight--embedding. Differences among firms are traced to the constraint and opportunities that arise from how they are embedded in network. So, the competence is only come from the firm’s self operation capability but also advantageous position in the industry. A firm with the position that can control or be powerful to others and not to be constrained would have much more social capital or valued information. The authors hope these outcomes would be meaningful to the researcher for future research and even practitioners for strategic thinking and decision.
REFERENCES
[1] "Member Directory," Taipei: Taiwan transportation vehicle manufacturers association, 2008.
[2] R. S. Achrol, L. K. Scheer, and L. W. Stern, "Designing successful Trans-Organizational Marketing Alliance," Marketing Science Institute, Cambridge, MA 1990.
[3] J. S. Armstrong and T. Overton, "Estimating nonreponse bias in mail surveys," Journal of Marketing Research, vol. 19, pp. 396-402, 1977.
[4] K. Bailey and M. Francis, "Managing information flows for improved value chain performance," International Journal of Production Economics, vol. 111, pp. 2-12, 2008.
[5] J. Baranson, "Transnational strategic alliance: why, what, where, and how," Multinational Business, vol. 2, pp. 54-61, 1990. [6] D. Boddy, D. Macbeth, and B. Wagner, "Implementing
collaboration between organizations: An empirical study of supply chain partnering," Journal of Management Studies, vol. 37, pp. 1003-1017, 2000.
[7] S. P. Borgatti and M. G. Everett, "Models of core/ periphery structures," Social Networks, vol. 21, pp. 375-395, 1999. [8] S. P. Borgatti, M. G. Everett, and L. C. Freeman, "Ucinet for
Windows: Software for Social Network Analysis," Harvard: MA: Analytic Technologies, 2002.
[9] S. P. Borgatti and P. C. Foster, "The network paradigm in organizational research: A review and typology," Journal of Management, vol. 29, pp. 991-1013, 2003.
[10] C. R. Carter, L. M. Ellram, and W. Tate, The use of social network analysis in logistics research vol. 28, 2007.
[11] L.-J. Chen, "The prospect and retrospect of Taiwan's automotive industry in the fourth quarter," Hsin Chu, Taiwan: Industrial Economics & Knowledge Center, 2008.
[12] M. M. Durland and K. A. fredericks, Social network analysis in program evaluation: New directions for evaluation. New York: NY: Jossey-Bass, 2006.
[13] J. H. Dyer and H. Singh, "The Relational view: cooperative strategy and sources of inter-organizational competitive advantage," Academy of Management Review, vol. 23, pp. 660-679, 1998.
[14] S. W. Floyd and B. Wooldridge, "Middle management's strategic influence and organizational performance," Journal of Management Studies, vol. 34, pp. 465-485, 1997.
[15] L. C. Freeman, "Centrality in social networks: conceptual clarification," Social Networks, vol. 1, 1979.
[16] N. E. Friedkin, A structural theory of social influence. New York Cambridge University Press, 1998.
[17] S. R. Friedman, J. Reynolds, M. A. Quan, S. Call, C. A. Crusto, and J. S. Kaufman, "Measuring changes in interagency collaboration: An examination of the bridgeport safe start initiative," Evaluation and Program Planning, vol. 30, pp. 294-306, 2007.
[18] J. Galaskiewicz and R. Burt, "Interorganizational contagion in corporate philanthropy," Administrative Science Quarterly, vol. 36, pp. 88-105, 1991.
[19] R. B. Handfield and E. L. N. Jr., Introduction to supply chain management. New Jersey, Upper Saddle River: Prentice Hall, 1999.
[20] G. K. Jasuja, C. P. Chou, K. Bernstein, E. Wang, M. McClure, and M. A. Pentz, "Using structural characteristics of community coalitions to predict progress in adopting evidence-based prevention programs," Evaluation and Program Planning, vol. 28, 2005.
[21] P. Kale, S. H., and H. Perlmutter, "Learning and protection of proprietary assets in strategic alliances: Building relational capital," Strategic Management Journal, vol. 21, pp. 217-237, 2000.
[22] M. Kilduff and W. Tsai, Social networks and organizations. Thousand Oaks: Sage publications, 2003.
[23] B. Kogut, "The network as knowledge: Generative rules and the emergence of structure," Strategic management journal, vol. 21, pp. 405-425, 2000.
[24] B. kogut, G. Walker, and D.-J. Kim, "Cooperation and entry induction as an extension of technological rivalry," Research Policy, vol. 24, 1995.
[25] D. Krackhardt, The strength of string tie: The importance of philos in organization. Boston: Harvard Business School Press, 1992.
[26] D. Krackhardt and D. Brass, "Intraorganizational networks: The micro side," in Advances in social network analysis, S. Wasserman and J. Galaskiewicz, Eds. Newberry Park: CA: Sage, 1994.
[27] P. Leun-Kwong Wong and P. Ellis, "Social ties and partner identification in Sino-Hong Kong international joint ventures," Journal of International Business Studies, vol. 33, pp. 267-289, 2000.
[28] S. Li and B. Lin, "Accessing information sharing and information quality in supply chain management," Decision support system, vol. 42, pp. 1642-1656, 2006.
[29] F.-R. Lin, Y.-P. Lo, and Y.-W. Sung, "Effects of switching cost, trust, and information sharing on supply chain performance for
B2B e-commerce: A multi-agent simulation study," in Hawaii International Conference on System Science, 2006.
[30] D. Luke and J. Harris, "Network analysis in Public health: History, methods and application," Annual Review of Public Health, vol. 28, pp. 69-93, 2007.
[31] Z. M'Chirgui, "The smart card firms' network positions: a social network analysis," European Management Journal, vol. 25, pp. 36-49, 2007.
[32] W. D. Nooy, A. Mrvar, and V. Batagelj, Exploratory Social Network Analysis with Pajek. New York: Cambridge University Press, 2005.
[33] C. Oliver, "Determinants of interorganizational relationships: Integration and future directions," Academy of Management Review, vol. 15, pp. 245-265, 1990.
[34] A. Paulraj, A. A. Lado, and I. J. Chen, "Inter-organizational communication as a relational competency: Antecedents and performance outcomes in collaborative buyer-supplier relationships," Journal of Operations Management, vol. 26, pp. 45-64, 2008.
[35] W. W. Powell, K. W. Koput, D. R. White, and J. Owen-Smith, "Network dynamics and field evolution: The growth of interorgniational collaboration in the life sciences," American Journal of Sociology, vol. 110, pp. 1132-1205, 2005.
[36] R.E.Spekman, J. W. Kamauff, and N.Myhr, "An empirical investigation into supply chain management: a perspective on partnerships " supply Chain Management, vol. 3, pp. 53-67, 1998.
[37] E. M. Roger, Diffusion of innovations, 5th Ed. New York: The free press, 2003.
[38] T. Rowley, D. Behrens, and D. Krackhardt, "Redundant governance structures: An analysis of structural and relational embeddedness in the steel and semi-conductor industries," Strategic Management Journal, vol. 21, pp. 369-386, 2000. [39] M. Ruef, "Strong ties, weak ties and islands: structural and
cultural predictors of organizational innovation," Industrial and Corporate Change, vol. 11, pp. 427-449, 2002
[40] J. Scott, Network analysis: A handbook, 2nd ed. Newbury Park: CA: Sage, 2000.
[41] J.-H. Su, Synergy. Taipei: The Commercial Press, 2004. [42] K. C. Tan, V. R. Kannan, and R. B. Handfeild, "Supply chain
management: supplier performance and firm performance," International Journal of Purchasing and Material Management, vol. 34, pp. 2-9, 1998.
[43] B. Uzzi, "Social structure and competition in interfirm networks: The paradox of embeddedness " Administrative Science Quarterly, vol. 42, pp. 35-67, 1997.
[44] T. W. Valente, C. P. Chou, and M. A. Pentz, "Community coalition networks as systems: Effects of network change on adoption of the evidence-based prevention," American Journal of Public Health, vol. 97, pp. 880-886, 2007.
[45] T. W. Valente, K. A. Coronges, G. D. Stevens, and M. R. Cousineau, "Collaboration and Competition in a children's health initiative coalition: A network analysis," Evaluation and Program Planning, vol. 31, pp. 392-402, 2008.
[46] T. W. Valente and R. L. Davis, "Accelerating the diffusion of innovations using opinion leaders," The Annuals of the American Academy of the Political and Social Sciences, vol. 556, pp. 55-67, 1999.
[47] S. Wasserman and K. Faust, Social network analysis: Methods and applications. New York: Cambridge University Press, 1994. [48] G. A. Welker, T. v. d. Vaart, and D. P. V. Donk, "The influence
of business conditions on supply chain information-sharing mechanisms: A study among supply chain links of SMEs," International Journal of Production Economics, vol. 113, pp. 706-720, 2008.
[49] D. T. Wilson and R. P. Vlosky, "Interorganizational information system technology and buyer-seller relationships," Journal of Business & Industrial Marketing, vol. 13, p. 215, 1998.
[50] Y. N. Wu and T. C. Edwin Cheng, "The impact of information sharing in a multiple-echelon supply chain," International Journal of Production Economics, 2008.
[51] H. Zhou and W. C. B. Jr., "Supply chain practice and information sharing," Journal of Operations Management, vol. 25, pp. 1348-1365, 2007.