http://mcr.sagepub.com
Review
Medical Care Research and
DOI: 10.1177/1077558708317759
2008; 65; 450 originally published online May 19, 2008;
Med Care Res Rev Martin
Janice C. Probst, Jong-Yi Wang, Charity G. Moore, M. Paige Powell and Amy Brock
Continuity of Health Insurance Coverage and Perceived Health at Age 40
http://mcr.sagepub.com/cgi/content/abstract/65/4/450The online version of this article can be found at:
Published by:
http://www.sagepublications.com
can be found at:
Medical Care Research and Review
Additional services and information for
http://mcr.sagepub.com/cgi/alerts Email Alerts: http://mcr.sagepub.com/subscriptions Subscriptions: http://www.sagepub.com/journalsReprints.nav Reprints: http://www.sagepub.com/journalsPermissions.nav Permissions: http://mcr.sagepub.com/cgi/content/refs/65/4/450 SAGE Journals Online and HighWire Press platforms):Citations (this article cites 45 articles hosted on the
450
Authors’ Note: This article, submitted to Medical Care Research and Review on January 19, 2006, was revised and accepted for publication on January 25, 2008.
This research was supported in part by a grant from the Office of Rural Health Policy, Health Resources and Services Administration, USDHHS (Grant No. 6 U1C RH 00045-03). The funder took no role in the design and conduct of the study; collection, management, analysis, and interpretation of the data; or prepara-tion, review, or approval of the manuscript. The opinions expressed are solely those of the authors.
Medical Care Research and Review
Volume 65 Number 4 August 2008 450-477 © 2008 Sage Publications 10.1177/1077558708317759 http://mcr.sagepub.com hosted at http://online.sagepub.com
Continuity of Health Insurance
Coverage and Perceived Health
at Age 40
Janice C. Probst
University of South Carolina
Jong-Yi Wang
China Medical University, Taiwan
Charity G. Moore
University of Pittsburgh
M. Paige Powell
University of Alabama at Birmingham
Amy Brock Martin
University of South Carolina
While a lack of health insurance or interrupted coverage has been shown to lead to poorer health status among preretirement populations, this phenomenon has not been examined among a large population of younger, working-age adults. We analyzed a nationally representative data set of persons born between 1957 and 1961, the National Longitudinal Survey of Youth–1979, to examine the links between insurance continu-ity and self-assessed physical and mental health at age 40. Among respondents turning 40 in 1998 or 2000, 59.8% had been continuously insured during the decade before they reached age 40. In unadjusted analysis, persons who were continuously covered had the highest scores for both physical and mental health. After controlling for respon-dent characteristics, insurance coverage was not significantly associated with perceived physical or mental health.
Keywords: health insurance coverage; physical health status; mental health status;
minority health
A
fundamental assumption in health services research is that being uninsured leads to poorer health status because of a lack of access to care (Davis, 1997). Individuals with interrupted health insurance coverage experience significant accessProbst et al. / Health Insurance Coverage and Perceived Health at Age 40 451
barriers (Kasper, Giovannini, & Hoffman, 2000; Schoen & DesRoches, 2000) and make fewer sick or preventive visits than the continuously insured (Comer, Mueller, & Blankenau, 2000; Sudano & Baker, 2003). Reduced visit frequency was associ-ated with poorer outcomes in the Rand Health Insurance Experiment (Keeler, Brook, Goldberg, Kamberg, & Newhouse, 1985; Lurie, Kamberg, Brook, Keeler, & Newhouse, 1989). More recent longitudinal research among persons in late middle age (51-61) has found worse health outcomes among continuously or intermittently uninsured persons than continuously insured individuals (Baker, Sudano, Albert, Borawski, & Dor, 2001, 2002; Dor, Sudano, & Baker, 2006). Declines in health among uninsured persons nearing Medicare eligibility exceed those of privately insured persons, but improve to match those of insured persons after 2 years of Medicare participation (Baker, Schootman, Barnidge, & Kelly, 2006). Overall, evi-dence supports the principle that health insurance is related to health (Hadley, 2003).
New Contribution
Longitudinal analyses of health insurance among younger adults, using the National Longitudinal Survey of Youth–1979 (NLSY79), are beginning to appear in the literature. The NLSY79 is a long-running panel study whose participants, recruited at ages 14-21 in 1979, have been tracked continuously since then. The old-est members of this cohort began to reach age 40 in 1998. Using NLSY79 data, Anderson and Eamon (2005) documented instability in insurance coverage among low-income working women. An innovative study examined the effects of health insurance among sibling clusters, as a means of holding developmental factors con-stant; findings suggested that lack of health insurance was associated with poorer self-reported health (Quesnel-Vallee, 2004). By design, both these studies accessed only a portion of NLSY79 participants: Low-income women or individuals for whom a sibling from the same household was also sampled.
The present study expands upon work examining insurance effects among adults approaching retirement age (Baker et al., 2001, 2002; Dor et al., 2006) by examin-ing the effects of insurance durexamin-ing the precedexamin-ing decade on health at age 40. Validated self-report measures of physical and mental health status, not available to earlier researchers (e.g., Quesnel-Vallee, 2004) were administered to NLSY79 par-ticipants beginning at that age. Our research thus constitutes the first analysis to explore the effects of health insurance on self-perceived health among a nationally representative cohort of adults entering middle age.
Conceptual Model
The behavioral model of health services use (Andersen, 1995) serves as a frame-work for examining the possible effects of insurance coverage on health status. As
452 Medical Care Research and Review
formulated by Andersen (1995), outcomes such as health status are affected by health behaviors, which are influenced by the predisposing characteristics, enabling resources, and need of individuals. Individual characteristics in turn are themselves influenced by the external environment. Multiple feedback loops characterize the relationships among elements in Andersen’s model. Use of health services, for example, can affect subsequent need and thus eventual health status.
Andersen’s (1995) model refers to both “perceived” and “evaluated” health status as its outcomes. Perceived health status is advocated as a population-level measure of health that correlates well with external measures (Burdine, Felix, Abel, Wiltraut, & Musselman, 2000). Poorer perceived health status has been linked to mortality among older adults (Hurd & McGarry, 1995). Lower scores on two self-report instruments, the Short Form–12 (SF-12) Physical Component Score (PCS) and Mental Component Score (MCS), have each been associated with both mortality and hospitalization among community-dwelling elders (Dorr et al., 2006) and among veterans (DeSalvo, Fan, McDonell, & Fihn, 2005), suggesting that these instruments are effective proxies for objectively evaluated health status.
Potential access to health services, in Andersen’s (1995) model, is defined as “the presence of enabling resources.” Insurance is an enabling variable at the individual level and is the subject of the present article; relevant longitudinal studies of insur-ance effects were presented earlier. Education and financial resources constitute fur-ther enabling variables. In the present research, proportion of life lived in a rural area is included as an additional enabling factor (or barrier) that may place the individual at risk for poorer self-perceived health status. Rural counties, defined as those situ-ated outside a metropolitan statistical area, have markedly fewer physicians per 100,000 population than urban counties. In 1998, for example, rural counties aver-aged 110.4 physicians per 100,000 persons, versus 226.7 physicians in urban coun-ties (Eberhardt et al., 2001). While much of the difference is attributable to the presence of specialists in large urban areas, rural counties also had lower rates for the primary care specialties. Individuals living in areas with high population to physician ratios are more likely to report long travel and, if poor or uninsured, to report other barriers to care than individuals with better access to services (Pathman, Ricketts, & Konrad, 2006). Among children, reduced availability of providers is linked to reduced primary care visits (Adams, Bronstein, & Florence, 2006).
In urban counties, physician supply has been inversely linked to hospitalization rates for ambulatory care sensitive (ACS) conditions (Laditka, Laditka, & Probst, 2005), although other researchers have argued that characteristics of the population and service area other than service supply are more important in rural areas (Ricketts, Randolph, Howard, Pathman, & Carey, 2001). Medicare beneficiaries liv-ing in primary care professional shortage areas are more likely to experience ACS hospitalizations than are their peers in areas with more health care resources (Parchman & Culler, 1999). Policies such as differential Medicare reimbursement for critical access hospitals and loan repayment through the National Health Service Corps seek to retain the supply of services in rural areas (Hartley, 2004).
Probst et al. / Health Insurance Coverage and Perceived Health at Age 40 453
The present research examines whether continuous health insurance over the pre-ceding 10-12 years results in better self-reported physical and mental health status at age 40, compared to lower levels of coverage. Facilitating and enabling characteris-tics of the individual and the community of residence are held constant through mul-tivariable analysis.
Method
Study Population
The NLSY79, commissioned by the Bureau of Labor Statistics of the U.S. Department of Labor, is one of the nation’s longest running panel surveys (Center for Human Resource Research, 2004). The NLSY79 was originally designed to track the trajectories of young persons as they completed their education and transitioned to the workforce, and thus focused on individuals from age 14 to 21. The core NLSY79 questions across survey years address educational investment and labor force experience (work situation, benefits, and wages) and remain unchanged from year to year. During the nearly 30 years of the NLSY79’s existence, however, the topic base has broadened as multiple federal agencies have funded additional ques-tions. The U.S. Departments of Defense and Health and Human Services and vari-ous institutes within the National Institutes of Health have contributed to the evolution of NLSY79 content. A separate substudy follows a panel of NSLY79 par-ticipants’ children (Center for Human Resource Research, 2004). Data are collected by the Census Bureau via an interagency agreement with the Bureau of Labor Statistics, and data files are managed by the Center for Human Resource Research at the Ohio State University.
A multistage, stratified clustered sample, the NLSY79 was initiated in 1979 with 12,686 respondents divided across three components: a sample representative of the population of persons born between 1957 and 1964 (ages 14-21); supplemental sam-ples of African Americans, Hispanics, and economically disadvantaged Whites (cor-rected through weighting to achieve national representativeness); and a sample of active duty military, all within the same age parameters. The last two groups, mili-tary and disadvantaged Whites, were dropped from follow-up after 1990. Participants were interviewed annually from 1979 through 1994, and biannually through 2000, with an 83.2% retention rate through 2000 (Center for Human Resource Research, 2004, p. 28). Retention rates did not differ by race. In all except one survey round (1987), most interviews were conducted in person, with some indi-viduals who were difficult to reach interviewed by telephone. A Spanish version of the questionnaire was developed and used if the respondent requested.
Across all waves of the NLSY79, information on the health of each participant was collected to ascertain fitness for labor force participation. This information has included height, weight, and health conditions that would prevent the person from being active in the labor market. Beginning in 1998, as the oldest members of the cohort reached the age of 40, an expanded health section was added to the interview. This section included the mental health and physical health components of the SF-12 along with other health outcomes measures.
The current analysis uses the NLSY79 to examine the relationship between con-tinuity of health insurance coverage over an extended period of time (10-12 years) and health at age 40. Thus, the population is limited to the subset of NLSY79 par-ticipants who reached the age of 40 by 2000 (3,164 persons). Because the analysis used longitudinal data on health insurance coverage, it was further restricted to respondents with fewer than three missing interviews between 1989 and 2000 (3,104 persons). The study was approved by the institutional review board of the University of South Carolina.
Health Status Measures
Two NLSY79 health status measures were selected: the PCS and the MCS from the SF-12. These scores can range from 0 to 100 and are designed to have a mean value of 50 in a representative U.S. population (Ware, Kosinski, & Keller, 1995). Higher values are associated with better physical or mental health. The test was first administered when the respondent reached age 40; this occurred in either 1998 or 2000, depending on the respondent’s age at intake into the NLSY79.
Insurance Status
Insurance status is measured as the proportion of time that an individual was insured from 1989 through age 40 (1998 or 2000). From 1979 through the present, the NLSY79 has consistently asked whether the respondent’s current or most recent job provided health insurance benefits (Center for Human Resource Research, 2004, p. 188). However, the presence or absence of health insurance as a fringe benefit does not address whether the individual is personally insured. Beginning in 1989, a new series of questions directly asked whether the individual was insured and if so, the source of insurance. The insurance measure in the present study is based on the survey years in which these questions were asked: 1989, 1990, 1992, 1993, 1994, 1996, 1998, and 2000 (seven surveys for respon-dents turning 40 in 1998). We calculated the percentage of time an individual had cover-age across the 10- to 12-year period by summing up the number of years with a “yes” response to the above questions and then dividing by the number of years surveyed. We added a second variable characterizing insurance by type, as public (Medicaid, MediCal, and other public sources) versus no public coverage. Receipt of public insurance was cat-egorized as none, 1 year only, 2-4 years, and 5-8 years across the period.
As noted, responses were excluded if 3 or more years of data were missing. For persons with one or two missing responses, imputation was used for the missing val-ues using a random binomial number generator in SAS (SAS Institute Inc., Cary, NC) and the percentage coverage based on those survey years with complete data.
Covariates
In defining covariates to be held constant in our analysis, we chose factors that were immutable or relatively unchangeable, in Andersen’s (1995) framework, and which preceded in time our outcomes of interest, physical, and mental health status at age 40. Covariates held constant began with sex and race. Race/ethnicity was characterized as White, African American, and Hispanic. Persons of other race/ ethnicity are not well captured in the data set and were excluded. The Hispanic sub-group within our analysis (571 unweighted observations) was principally of Mexican (54.0%) heritage, followed by Puerto Rican (13.3%), Cuban (6.5%), with other groups being present in only small numbers. By comparison, the total Hispanic population in the United States in 2000 was 58.5% Mexican in background, fol-lowed by Puerto Rican (9.6%) and Cuban (3.5%; Guzman, 2001).
Rural residence, defined as living in a county outside a Standard Metropolitan Statistical Area (SMSA), was of interest because of the reduced health resources available in most rural counties (Rosenblatt, 2004). For each individual, we calcu-lated the percentage time spent outside an SMSA during 1989-2000 (1998 for appro-priate respondents). For dichotomous analyses, we defined “rural resident” as a person who had lived less than half of the time in an SMSA.
Factors such as education, marital status, and number of children, while change-able, are relatively fixed by the time a person has reached age 40. Other personal characteristics were drawn from the individual’s history, and thus both unchangeable and not simultaneous in time with outcomes at age 40. Family background measures were obtained from the 1979 survey and included family structure (two parent vs other), parental education, and parental natality (U.S. vs foreign born). Poverty sta-tus was measured as a proportion of the period 1979-1988 in which the respondent’s household income fell below poverty. For respondents still living in the parental household, the NLSY uses parental income to determine poverty; as respondents transitioned to independence, their own household incomes were used. When respondents did not provide full information, and poverty status could not be calcu-lated, they were defined as “not in poverty.” The number of years during 1979-1987 in which the individual reported health limitations that impeded employment was used as a proxy for prior health status. The Rosenberg Self-Esteem Score (Rosenberg, 1965) was used to capture psychological health in 1980. Self-esteem has been linked to positive health behaviors in adolescence (McGee & Williams, 2000), and thus may affect adult health. Self-esteem scores were dichotomized at 18, with low self-esteem considered to be the at-risk state. Three measures of substance Probst et al. / Health Insurance Coverage and Perceived Health at Age 40 455
use during early adulthood were employed as measures of health risk behaviors. Cigarette smoking was first ascertained by the NLSY79 in 1984, when respondents were in their mid-20s. Persons reporting smoking at that time were defined as posi-tive for smoking. Illicit drug use was measured by reported use of marijuana or hashish in 1980, the 1st year in which this topic was addressed; these were the only illicit drugs queried. The NLSY has been deemed effective at ascertaining marijuana use, though perhaps less sensitive for other illicit drugs (Mensch & Kandel, 1988). High risk alcohol use is defined as adverse effects due to alcohol (drinking interfered with school or job) in any of 3 years (1982-1984).
To assess the effects of current community resources on health, we included mea-sures for region and for unemployment rate and physicians per 100,000 persons (1998 or 2000) in the county of residence at age 40.
Statistical Methods
All analyses using the NLSY79 must account for the oversampling of Hispanic and Black youth. For all modeling, we controlled for race/ethnicity (sampling strata). Analyses used weights from the outcome year (1998 or 2000) to take into account design effects from the original sample design in 1979 and subsequent attri-tion. Analyses were conducted using SAS-callable SUDAAN (RTI International, Research Triangle Park, NC).
Chi-square analyses were used to compare categorical outcomes. Means and stan-dard errors were presented for SF-12 PCS and MCS scales and tested using analysis of variance (ANOVA). Multivariable analyses for SF-12 scores used general linear mod-eling, estimating the least squares means for each level of the independent variables.
Results
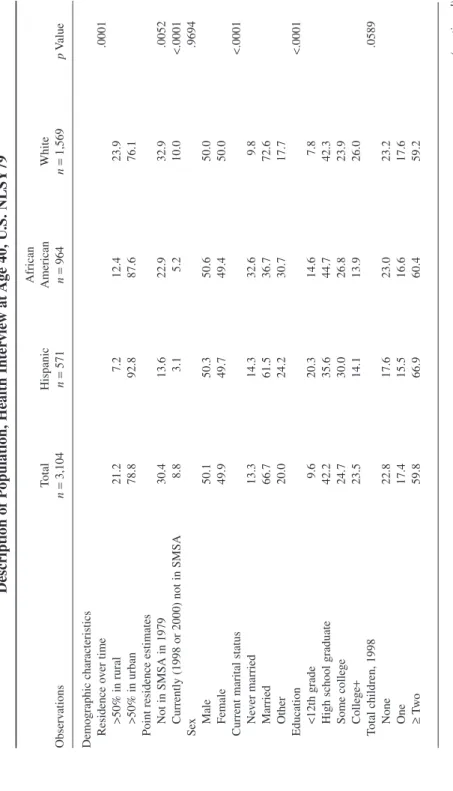
Characteristics of Population Studied: A National Sample of “Youth” in 1979
The demographic characteristics of NLSY79 respondents reaching age 40 in 1998 or 2000 are shown in Table 1, stratified by race. Of note, indicators of social and economic disadvantage were more common among minority respondents. African Americans were about twice as likely and Hispanics were nearly 3 times as likely as Whites to have less than a high school education, while Whites were more likely to have a college degree or better (Table 1). Using point estimates for 1979 (data not shown in table), 37.0% of African American NLSY youths and 27.0% of Hispanic youths were in poverty when young, compared to only 9.5% of Whites. These values are similar to those found by the 1980 census: 40.7% of African American children, 27.4% of Hispanic children, and 11.4% of White children aged 456 Medical Care Research and Review
18 and below were in poverty (U.S. Bureau of the Census, 1981). Individuals were more likely to remain poor than to become poor. Among persons who were poor in 1979, 22.7% remained poor when interviewed at age 40, while among respondents not in poverty, only 7.7% became poor (p< .0001).
Analysis of poverty experience during 1979-1988 suggests that point estimates fail to capture the proportion of persons who spend at least part of their early adult life in poverty. Over the 10-year period, the majority of non-White respondents, and a substantial portion of Whites, spent at least 1 year in poverty (Table 1). Poverty levels were most severe for African American respondents, 43.0% of whom spent 3 or more years in poverty, while only 26.1% had no poverty years (Table 1).
White respondents were more likely than Hispanics or African Americans to report living in a two-parent family during youth (91.6% vs 84.3% and 80.3%, respectively,
p< .0001). Hispanics were markedly more likely to have parents who were born out-side the United States (Table 1). Both Hispanics and African Americans were likely to have parents who had not completed high school, or who declined to describe their edu-cation, than Whites (62.0% and 48.7%, respectively, vs 19.1%, p≤ .0001).
Race/ethnicity was associated with differences in health-related activities during early adulthood (1979-1984; Table 1). Despite these behavioral risk differences, there were no significant race-based differences in health across 1979-1988, as mea-sured by the number of years during which health impaired the individual’s ability to perform activities. Overall, four out of five respondents experienced no periods of impairment (78.7%), while 12.8% had 1 year of impairment, and 8.5% reported health problems in 2 years or more (Table 1).
Insurance Coverage
Three of every five respondents (59.8%) were continuously covered in the decade preceding age 40, with 13.3% covered between 75% and 99% of the time (Table 1). Among the 27.0% respondents with less than 75% coverage, 12.1% had insurance from 50%-75% of the time and only 14.9% of respondents were uninsured for more than half of the time (data not in table). Whites were more likely to be continuously insured than were minority respondents (Table 1).
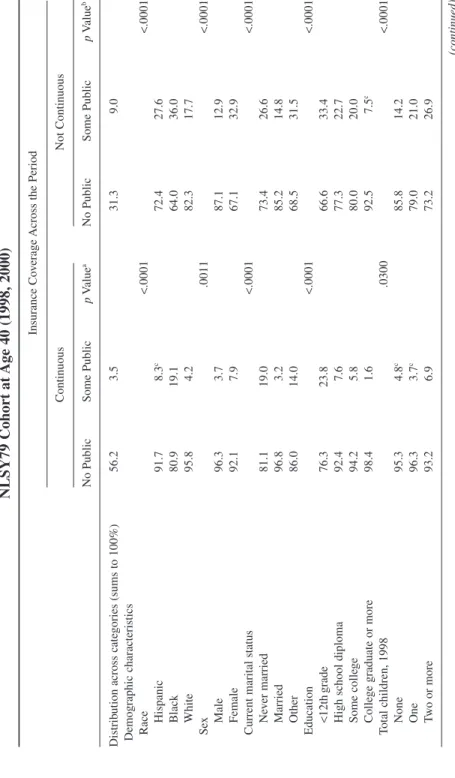
Public insurance (Medicaid, MediCal, and similar programs) was accessed by 12.5% of all respondents across the 1989-2000 period. Overall, slightly more than half of respondents were continuously insured with no receipt of public insurance (56.2%), 3.5% were continuously insured with at least 1 year of public coverage; 31.3% were not continuously insured but had no public coverage, and 9.0% were not continuously insured with some public insurance. Within both the continuously insured and not continuously insured groups, persons who reported public insurance were more likely to be female, not married, of lower educational attainment, and to have reported 2 or more years of living in poverty during 1979-1988 (Table 2). Persons who received public insurance were also more likely than their counterparts Probst et al. / Health Insurance Coverage and Perceived Health at Age 40 457
T able 1 Description of P opulation, Health Inter view at Age 40, U .S. NLSY79 African Total Hispanic American White Observ ations n = 3,104 n = 571 n = 964 n = 1,569 p V alue Demographic characteristics Residence ov er time .0001 >50% in rural 21.2 7.2 12.4 23.9 >50% in urban 78.8 92.8 87.6 76.1 Point residence estimates Not in SMSA in 1979 30.4 13.6 22.9 32.9 .0052 Currently (1998 or 2000) not in SMSA 8.8 3.1 5.2 10.0 <.0001 Se x .9694 Male 50.1 50.3 50.6 50.0 Female 49.9 49.7 49.4 50.0 Current marital status <.0001 Ne ver married 13.3 14.3 32.6 9.8 Married 66.7 61.5 36.7 72.6 Other 20.0 24.2 30.7 17.7 Education <.0001 <12th grade 9.6 20.3 14.6 7.8 High school graduate 42.2 35.6 44.7 42.3 Some colle ge 24.7 30.0 26.8 23.9 Colle ge + 23.5 14.1 13.9 26.0 Total children, 1998 .0589 None 22.8 17.6 23.0 23.2 One 17.4 15.5 16.6 17.6 ≥ Tw o 59.8 66.9 60.4 59.2 (continued) 458
T able 1 (continued) African Total Hispanic American White Observ ations n = 3,104 n = 571 n = 964 n = 1,569 p V alue Experience during their 20s Po verty status, 1979-1988 <.0001 Not in po verty 56.1 44.3 26.1 62.5 Once or twice 27.0 31.3 30.9 25.9 More than twice 16.9 24.4 43.0 11.6 Health limitations, 1979-1988 .3917 No limited years 78.7 79.4 78.7 78.7 Limited in 1 year 12.8 14.4 12.7 12.7 Limited in ≥2 years 8.5 6.3 8.6 8.6 Characteristics, 1979-1984 Self-esteem in 1980 .0222 Lo w ,< 18 21.9 26.7 19.8 21.8 High, ≥18 78.1 73.3 80.2 78.2 Use of marijuana or hashish, 1980 .0261 Y es 48.4 42.5 44.5 49.5 No 51.7 57.6 55.5 50.5 Alcohol interfered with school or w ork 1983-1984 <.0001 Y es 10.0 7.6 4.7 11.2 No 90.0 92.4 95.3 88.9 Cigarette use in 1984 .0005 Y es 41.4 38.3 47.6 40.5 No 58.6 61.7 52.4 59.5 Family background <.0001 Family structure Tw o parent 89.5 84.3 80.3 91.6 Other 10.5 15.8 19.7 8.4 (continued) 459
460 T able 1 (continued) African Total Hispanic American White Observ ations n = 3,104 n = 571 n = 964 n = 1,569 p V alue Parental education <.0001 <12th grade, in valid 26.1 62.0 48.7 19.1 High school graduate or more 73.9 38.0 51.3 80.9 Parental natality <.0001 Foreign born 8.9 46.3 7.2 6.2 Born in the United States 91.1 53.7 92.8 93.8 Ecological variables Physician population ratio, 2000 243.4 249.5 319.6 229.3 <.0001 Unemplo yment rate, 2000 4.4 6.0 4.5 4.2 .0003 Re gion <.0001 Northeast 15.1 15.6 15.0 15.1 North Central 29.6 7.3 19.0 33.3 South 36.8 32.7 56.9 33.4 W est 18.6 44.3 9.2 18.2 Insurance Insurance co verage ov er time <.0001 ≤75% 27.0 38.5 39.0 23.8 75%-99% 13.3 16.6 18.3 12.1 100% co verage 59.8 44.9 42.7 64.0 Receipt of public insurance <.0001 No public insurance 87.5 81.1 71.2 91.0 During 1 year 4.7 5.6 7.0 4.2 During 2-4 years 4.1 8.1 11.1 2.5 During 5-8 years 3.8 5.2 10.7 2.4 Note: NLSY79 = National Longitudinal Surv ey of Y outh–1979; SMSA = Standard Metropolitan Statistical Area.
Probst et al. / Health Insurance Coverage and Perceived Health at Age 40 461
to report 2 or more years in which poor health had limited their ability to work over the 1979-1988 period. Among continuously insured persons, 22.0% of those who received some public insurance reported 2 or more years of poor health; among those without continuous coverage, 44.2% of those with public insurance reported 2 or more years of poor health (Table 2).
Factors Affecting Health Outcomes at Age 40
Without controlling for other characteristics, persons who were continuously cov-ered had the highest scores for both physical and mental health at age 40 (Table 3). Receipt of public insurance, however, was associated with lower self-reported phys-ical and mental health.
Among respondent demographic characteristics, male sex was associated with higher PCS and MCS. Race was not significantly associated with either PCS or MCS. Scores on both scales generally increased with education. For example, respondents who had not competed high school averaged 48.4 on the physical components scale, while those with a college education or more had average scores of 54.1 (Table 3). The experience of poverty during early adulthood was associated with poorer physical and mental health, as was the experience of health limitations on ability to work during the same period.
Among youth behaviors or characteristics, low self-esteem in 1980 was associated with poorer physical and mental health scores approximately 20 years later (Table 3). All health risk behaviors were significantly linked to worse MCS at age 40; however, only cigarette smoking was linked to subsequent poorer PCS. Family structure and parental education both influenced PCS and MCS, with two-parent families and parents who had completed high school being associated with better scores.
Holding Personal Characteristics Equal: Multivariable Analysis
Factors affecting physical health scores. After adjusting for enabling and need characteristics of the individual, continuity of insurance coverage was not linked to PCS (Table 4). Receipt of public insurance during the period was highly associated with perceived physical health, with PCS declining from 53.0 among persons who never received public insurance to 46.4 among persons with 5 or more years of such coverage (Table 4).
Across demographic characteristics of the individual, race, sex, education, and number of children in the household were linked to perceived physical health. Race effects were small; African Americans tended to report slightly higher scores than Hispanics, who in turn had slightly higher scores than Whites. Men reported slightly better health than did women (52.9 vs 52.1, p= .0186). PCS increased with each increment of additional edu-cation (Table 4). With receipt of public insurance held constant, poverty status during the respondent’s twenties was not linked to perceived health at age 40.
T able 2 F actors Signif icantly Associated W ith Receipt of Public Insurance, by Continuity of Co verage (%), NLSY79 Cohort at Age 40 (1998, 2000) Insurance Co verage Across the Period Continuous Not Continuous No Public Some Public p V alue a No Public Some Public p V alue b Distrib ution across cate gories (sums to 100%) 56.2 3.5 31.3 9.0 Demographic characteristics Race <.0001 <.0001 Hispanic 91.7 8.3 c 72.4 27.6 Black 80.9 19.1 64.0 36.0 White 95.8 4.2 82.3 17.7 Se x .0011 <.0001 Male 96.3 3.7 87.1 12.9 Female 92.1 7.9 67.1 32.9 Current marital status <.0001 <.0001 Ne ver married 81.1 19.0 73.4 26.6 Married 96.8 3.2 85.2 14.8 Other 86.0 14.0 68.5 31.5 Education <.0001 <.0001 <12th grade 76.3 23.8 66.6 33.4 High school diploma 92.4 7.6 77.3 22.7 Some colle ge 94.2 5.8 80.0 20.0 Colle ge graduate or more 98.4 1.6 92.5 7.5 c Total children, 1998 .0300 <.0001 None 95.3 4.8 c 85.8 14.2 One 96.3 3.7 c 79.0 21.0 Tw o or more 93.2 6.9 73.2 26.9 (continued) 462
T able 2 (continued) Insurance Co verage Across the Period Continuous Not Continuous No Public Some Public p V alue a No Public Some Public p V alue b Experience during their 20s Po verty status, 1979-1988 <.0001 <.0001 Not in po verty 98.0 2.0 c 89.42 10.6 1 or 2 years 93.5 6.5 82.5 17.5 More than 2 years 64.2 35.9 56.8 43.2 Health limitations, 1979-1988 .0001 .0002 No limited years 95.9 4.1 81.3 18.8 Limited in 1 year 91.7 8.4 c 74.5 25.5 Limited in 2 or more years 78.0 22.0 55.8 44.2 Characteristics, 1979-1984 Self-esteem in 1980 .0001 .0005 Lo w (< 18) 87.6 12.4 70.8 29.2 High (≥ 18) 95.6 4.4 80.2 19.8 Cigarette use in 1984 <.0001 .1081 Y es 89.6 10.4 75.9 24.1 No 96.2 3.8 79.8 20.2 Family background Family structure .0188 .0069 Tw o-parent family 94.6 5.4 79.1 20.9 Other 87.7 12.3 c 69.4 30.7 Parental education <.0001 <.0001 <12th grade, in valid 87.5 12.5 69.8 30.2 High school diploma or better 95.6 4.4 82.4 17.6 Note: NLSY79 = National Longitudinal Surv ey of Y outh–1979. The follo wing characteristics did not dif fer based on whether the indi vidual recei ved public insurance across the period, and so are not sho wn: Residence (percentage time in rural counties), use of marijuana or hashish duri ng youth, reporting that alcohol interfered with school or w ork, 1982-1984, and parental natality (foreign vs U.S. born). a. p value for dif ferences in receipt of public insurance within the continuously insured group. b. p value for dif ferences in receipt of public insurance within the not continuously insured group. c. Cell observ ation <30, unreliable estimation. 463
464 Table 3
Factors Affecting Perceived Physical and Mental Health, Unadjusted Analysis, NLSY79 (Unweighted n== 3,104)
Mean SF-12 Scores
PCS MCS
Mean SE pValue Mean SE pValue
Insurance, 1989-2000
Insurance coverage over time <.0001 <.0001
≤75% 51.3 0.3 51.7 0.3
75%-99% 51.7 0.4 52.6 0.4
100% coverage 53.2 0.2 53.6 0.2
Receipt of public insurance <.0001 <.0001
No public insurance 53.2 0.2 53.4 0.2 During 1 year 49.4 1.0 50.2 1.3 During 2-4 years 48.0 0.9 51.4 0.9 During 5-8 years 44.2 1.2 48.3 1.0 Demographic characteristics Race .0607 .3599 Hispanic 51.8 0.4 53.2 0.4 Black 51.9 0.3 52.5 0.4 White 52.6 0.2 53.0 0.2
Residence over time .1241 .9652
>50% in rural 52.0 0.4 53.0 0.4 >50% in urban 52.6 0.2 53.0 0.2 Residence in 1979 .7171 .5089 Not in SMSA in 1979 52.5 0.2 52.8 0.2 In SMSA 52.3 0.3 53.1 0.3 Sex .0001 <.0001 Male 53.2 0.2 54.1 0.2 Female 51.7 0.3 51.8 0.3 (continued)
© 2008 SAGE Publications. All rights reserved. Not for commercial use or unauthorized distribution.
at UNIV OF SOUTH CAROLINA on July 18, 2008
http://mcr.sagepub.com
Table 3 (continued)
Mean SF-12 Scores
PCS MCS
Mean SE pValue Mean SE pValue
Education <.0001 .0149
<12th grade 48.4 0.8 51.3 0.7
High school diploma 52.2 0.3 52.8 0.3
Some college 53.0 0.3 53.3 0.3
College graduate or more 54.1 0.3 53.6 0.3
Current marital status <.0001 <.0001
Never married 51.5 0.4 52.0 0.5 Married 53.0 0.2 53.6 0.2 Other 51.2 0.4 51.5 0.4 Total children, 1998 .2424 .5252 None 52.3 0.3 53.3 0.3 One 53.0 0.4 52.8 0.4 Two or more 52.4 0.2 52.9 0.2
Experience during their 20s <.0001 <.0001
Poverty status, 1979-1988
Not in poverty 53.4 0.2 53.7 0.2
1 or 2 years 51.9 0.4 53.0 0.3
More than 2 years 50.1 0.4 50.4 0.5
Health limitations, 1979-1988 <.0001 <.0001
No limited years 53.3 0.2 53.4 0.2
Limited in 1 year 51.1 0.6 51.8 0.5
Limited in 2 or more years 46.7 0.9 50.4 0.8
(continued)
465
© 2008 SAGE Publications. All rights reserved. Not for commercial use or unauthorized distribution.
at UNIV OF SOUTH CAROLINA on July 18, 2008
http://mcr.sagepub.com
Table 3 (continued)
Mean SF-12 Scores
PCS MCS
Mean SE pValue Mean SE pValue
Characteristics, 1979-1984
Self-esteem in 1980 <.0001 <.0001
Low (<18) 51.2 0.4 51.4 0.5
High (≥18) 52.8 0.2 53.4 0.2
Use of marijuana or hashish, 1980 .1031 .0070
Yes 52.8 0.2 52.5 0.3
No 52.2 0.3 53.4 0.2
Alcohol interfered with school or work, 1984 .1634 .0496
Yes 51.6 0.7 51.6 0.8 No 52.6 0.2 53.1 0.2 Cigarette use in 1984 <.0001 <.0001 Yes 51.0 0.3 52.2 0.3 No 53.5 0.2 53.5 0.2 Family background Family structure .0101 .0007 Two-parent family 52.6 0.2 53.2 0.2 Other 50.9 0.6 51.3 0.5 Parental education <.0001 .0002 <12th grade, invalid 50.5 0.3 51.8 0.3
High school diploma or better 53.2 0.2 53.4 0.2
Parental natality .4731 .8521 Foreign born 52.1 0.6 52.9 0.5 U.S. born 52.5 0.2 53.0 0.2 Ecological variables Region .4482 .0085 Northeast 52.9 0.5 53.6 0.4 North Central 52.6 0.3 53.6 0.3 South 52.4 0.3 52.7 0.3 West 52.0 0.4 52.0 0.5
Note: NLSY79 = National Longitudinal Survey of Youth–1979; PCS = Physical Component Score; MCS = Mental Component Score; SF-12 = Short Form–12; SMSA = Standard Metropolitan Statistical Area.
466
© 2008 SAGE Publications. All rights reserved. Not for commercial use or unauthorized distribution.
at UNIV OF SOUTH CAROLINA on July 18, 2008
http://mcr.sagepub.com
Table 4
Adjusted Effects of Insurance on SF-12 PCS and MCS, Holding Demographic Characteristics Equal (Unweighted n== 3,104)
Adjusted SF-12 Scores
PCS MCS
LS Mean SE pValue LS Mean SE pValue
Insurance, 1989-2000
Insurance coverage over time 0.8200 0.3118
≤75% 52.6 0.4 52.5 0.5
75-99% 52.6 0.4 53.1 0.5
100% coverage 52.4 0.2 53.1 0.2
Receipt of public insurance <0.0001 0.1917
No public insurance 53.0 0.2 53.1 0.2 During 1 year 50.8 1.1 51.6 1.2 During 2-4 years 49.1 0.9 53.3 0.9 During 5-8 years 46.4 1.3 51.1 1.0 Demographic characteristics Race 0.0484 0.0245 Hispanic 52.9 0.5 54.0 0.5 Black 53.3 0.3 53.8 0.4 White 52.3 0.2 52.7 0.2
Residence over time 0.8817 0.9470
>50% in rural 52.5 0.4 52.9 0.4 >50% in urban 52.5 0.2 53.0 0.2 Sex 0.0186 <0.0001 Male 52.9 0.2 53.9 0.2 Female 52.1 0.2 52.0 0.3 (continued) 467
© 2008 SAGE Publications. All rights reserved. Not for commercial use or unauthorized distribution.
at UNIV OF SOUTH CAROLINA on July 18, 2008
http://mcr.sagepub.com
468 T able 4 (continued) Adjusted SF-12 Scores PCS MCS LS Mean SE p V alue LS Mean SE p V alue Education 0.0322 0.7920 <12th grade 50.1 0.9 52.8 0.7 High school diploma 52.4 0.2 53.0 0.3 Some colle ge 52.8 0.3 53.2 0.3 Colle ge graduate or more 53.2 0.3 52.8 0.3 Current marital status 0.8405 0.0272 Ne ver married 52.5 0.4 52.1 0.5 Married 52.5 0.2 53.4 0.2 Other 52.3 0.3 52.1 0.4 Total children, 1998 0.0434 0.4706 None 51.7 0.3 53.3 0.3 One 52.9 0.3 52.9 0.4 Tw o or more 52.6 0.2 52.8 0.2 Experience during their 20s Po verty status, 79-88 0.0687 0.1711 Not in po verty 52.7 0.2 53.2 0.3 1 or 2 years 51.9 0.3 53.1 0.3 More than 2 years 52.7 0.5 51.9 0.6 Health limitations, 1979-1988 <0.0001 0.0120 No limited years 53.1 0.2 53.2 0.2 Limited in 1 year 51.6 0.5 52.3 0.5 Limited in 2 or more years 48.0 0.8 51.4 0.8 Characteristics, 1979-1984 Self-esteem in 1980 0.9650 0.0068 Lo w (< 18) 52.5 0.33 51.9 0.4 High (≥ 18) 52.5 0.17 53.2 0.2 (continued)
469 T able 4 (continued) Adjusted SF-12 Scores PCS MCS LS Mean SE p V alue LS Mean SE p V alue Use of marijuana or hashish, 1980 0.0115 0.0126 Y es 52.9 0.20 52.6 0.2 No 52.1 0.23 53.3 0.2 Alcohol interfered with school or w ork, 1984 0.2551 0.1273 Y es 51.8 0.6 51.9 0.7 No 52.5 0.2 53.1 0.2 Cigarette use in 1984 <0.0001 0.0803 Y es 51.5 0.3 52.6 0.3 No 53.1 0.2 53.2 0.2 Family background Family structure 0.3595 0.1562 Tw o-parent family 52.5 0.2 53.0 0.2 Other 52.0 0.6 52.3 0.5 Parental education 0.0010 0.1045 <12th grade, in valid 51.5 0.3 52.4 0.4 High school diploma or better 52.8 0.2 53.2 0.2 Ecological variables Re gion 0.2759 0.0093 Northeast 52.7 0.4 53.6 0.4 North Central 52.8 0.2 53.6 0.3 South 52.4 0.3 52.8 0.3 W est 52.0 0.4 51.8 0.5 N ot e: Se e no te t o Ta bl e 3. A ls o in t he m od el b ut n ot s ho w n be ca us e no s ig ni fi ca nt r es ul ts w er e fo un d: pa re nt al n at al ity ( U .S . vs fo re ig n bo rn ), ph ys ic ia n po pu la tio n ra tio in c ou nt y of r es id en ce ,2 00 0 an d un em pl oy m en t r at e in c ou nt y of r es id en ce ,2 00 0. M od el s ta tis tic s: M ul tip le R 2fo r PC S = .1 56 5; m ul tip le R 2 for MCS = .0798.
470 Medical Care Research and Review
Prior health, measured during 1979-1988, had pronounced effects on health at age 40. Respondents who experienced multiple health-limited years had low adjusted PCS (48.0), while those without limitations had markedly higher adjusted scores (53.1; p < .0001; Table 4, Model 2). Among the characteristics of the indi-vidual during early adulthood, two were linked to health at 40. Persons reporting use of marijuana or hashish in 1980 had slightly higher self-reported health scores than others, while persons reporting cigarette smoking in 1984 had lower scores than non-smokers. Self-esteem in 1980 and potentially abusive alcohol use during the 1982-1984 period were not linked to physical health.
Among characteristics of the individual’s family of origin, only parental educa-tion was linked to physical health; persons whose parents had at least a high school diploma reported better health than others (52.79 vs 51.22, p= .0010). None of the three ecological variables had any relationship to perceived physical health.
Factors affecting mental health scores. In multivariable analysis, neither conti-nuity of insurance coverage nor source of coverage (public vs private) was statisti-cally associated with MCS (Table 4). Examining demographic characteristics, Hispanics reported the highest MCS (54.0), followed by African Americans (53.8) and Whites (52.7; p = .0245; Table 4). Men reported better mental health than women, and persons who were currently married reported better mental health than those who were not married (Table 4).
Persons who reported health-related limitations in their ability to work during the 1979-1988 period had worse self-perceived mental health than those without such limitations. Respondents who reported no limitations had the highest adjusted MCS (53.2), followed by those with 1 year of limitations (52.3) and those with multiple limited years (51.4, p= .0120; Table 4).
Among variables relating to the individual’s self-perception and potential risk behaviors during early adulthood, perceived self-esteem and illicit drug use were linked to MCS. Persons falling into the lowest quartile for self-esteem during youth had lower perceived mental health than those with better self-esteem (51.9 vs 53.2,
p= .0068; Table 4). Respondents reporting use of marijuana or hashish in 1980 had lower MCS than those who did not (52.6 vs 53.3, p= .0126; Table 4). No character-istics of the respondent’s family of origin were linked to MCS.
Discussion
Effects of Health Insurance on Physical Health
In general, 40-year-old respondents perceived themselves to be in good physical and mental health, with mean values above 50 on SF-12 PCS and MCS scales. Continuous health insurance coverage across the preceding 9-11 years was not
Probst et al. / Health Insurance Coverage and Perceived Health at Age 40 471
associated with better self-perceived physical health at age 40 in multivariable analy-sis. This finding parallels results achieved by previous researchers looking at adult populations (Kasper et al., 2000; Schoen & DesRoches, 2000). Receipt of public insurance was closely tied to reported physical health, with lower self-reported health among persons with more years of public coverage. Because participation in Medicaid, the principal source of public insurance for persons in their 30s, is closely tied to health status as well as to income, this relationship was not unexpected. Previous work with the NLSY79 sample demonstrated that public insurance, per se, is not detrimental to eventual health status (Quesnel-Vallee, 2004).
Failure of the present research to document a relationship between continuous coverage and physical health, even with receipt of public insurance held constant, may have multiple causes. First, all respondents, even those who lacked health insur-ance, may have received all needed health care. Uninsured persons may rely on char-ity or other discounted sources of care (Johnson & Crystal, 2000). This appears unlikely, as research suggests that individuals reduce their use of care when health insurance is lost or discontinuous (Sudano & Baker, 2003). Second, individuals may fail to assess their own health accurately. However, self-rated health status has been linked to both mortality and health services utilization (Dorr et al., 2006; DeSalvo et al., 2005), suggesting that personal perceptions have reasonable validity. Perhaps most likely, respondents in their 30s may be less susceptible to the effects of fore-gone health care than older populations.
The principal influence on perceived health status at age 40, after receipt of public insurance, was health during the respondent’s 20s. Individuals reporting health limitations on their ability to work at the beginning of their adult careers demonstrated persistent poor physical health. Individuals who were smokers in their mid-20 also reported poorer health at age 40. Whether interventions at younger ages aimed at improving health or changing smoking behavior could have improved health at age 40 cannot be determined.
Poverty during the decade when respondents were in their 20s was not linked to health at age 40, after receipt of public insurance was held constant. Poverty during those years was linked to receipt of public insurance when they were in their 30s. It is likely that the association of prior poverty with subsequent public insurance flows from continued poverty; respondents were more likely to remain in poverty than to enter it. Additional research is needed to clarify both the factors associated with receipt of public insurance and the interrelationship between public insurance and health status.
The long-term effects of family history found in our analysis was striking. Even with multiple present and past factors held constant, individuals whose parents had low education levels reported worse physical health than their counterparts. Health habits and attitudes formed during youth may persist. An emerging literature sug-gests that mortality is affected by childhood social status, in addition to adult status (Beebe-Dimmer et al., 2004; Pensola & Martikainen, 2004; Poulton et al., 2002),
and by financial status at midlife as well as financial status in later life (Hayward & Gorman, 2004). In addition, research is beginning to link childhood experiences with adult morbidity (Blackwell, Hayward, & Crimmins, 2001).
Effects of Health Insurance on Mental Health
Continuous insurance coverage was not associated with better self-perceived men-tal health scores. Principal factors affecting MCS included sex, immutable in Andersen’s (1995) model, baseline mental health as measured by the Rosenberg Self-Esteem Scale, and the experience of poor health during 1979-1988. Elements of the Rosenberg Self-Esteem Scale parallel questions about self-worth used in screening for depression (Beck, Steer, & Garbin, 1988). Thus, self-perceived mental health at age 40 may be a continuation of mental states experienced in 1980. Research has found that many persons testing positive for mental health disorders on screening instruments do not seek care. In 1990, for example, at about the midpoint of the 20 years covered by the present research, only about one fifth of persons with a poten-tial mental health disorder sought treatment from any health professional for this problem (Kessler et al., 1994). Links between prior poor physical health and lower perceived mental health may be related to the persistence of poor health over time. Prior research has found that both concurrent poor physical health and changing physical health status are associated with depression (e.g., Egede & Zheng, 2003). As noted in the preceding section, the degree to which interventions can reduce the occurrence of health limitations that interfere with work remains to be explored.
The relationship between marijuana or hashish use at the beginning of adulthood and mental health scores is intriguing, given the current high prevalence of these behaviors and the potential for intervention. High school students tapped by the Youth Risk Behavioral Survey (YRBS) constitute the population most similar to the NLSY cohort that is currently examined on a regular basis. The 2005 YRBS found that 22.8% of high school seniors had used marijuana within the past 30 days, and 47.6% reported lifetime use (Centers for Disease Control and Prevention, 2006). Continued research is needed to delineate the population of youth engaged in these behaviors and to devise interven-tions which reduce use or serve to mitigate its consequences.
Limitations
Limitations to the present study involve the measurement of insurance coverage, the age of respondents, and the use of self-report measures. The analysis is based on the percentage of time insured between 1989 and 1998/2000, but does not distin-guish between persons whose period of uninsurance was early in the study period and those for whom it might have been recent, or between a single extended period of uninsurance and multiple such periods. However, the definition of “continuous coverage” is fairly straightforward, and the time span covered is greater than that 472 Medical Care Research and Review
Probst et al. / Health Insurance Coverage and Perceived Health at Age 40 473
used by most previous research. Second, age 40 is relatively young for detecting the health effects of undiagnosed or untreated disease. Even persons with diagnosed but asymptomatic medical problems, such as hypertension, may not “feel bad.” Third, all health outcomes were based on respondent self-report, although validated instru-ments were used. The most likely result of using self-report data is that the true preva-lence of disease in the population is underestimated, again biasing the study conservatively. Finally, it should be noted that the models, while significant, do not explain a large part of the variance in PCS (multiple R2= .1565) or MCS (multiple R2 = .0798).
Conclusion
A substantial subset (40.3%) of a nationally representative cohort of adults lacked continuous health insurance coverage in the years before they reached age 40. Among African Americans and Hispanics, nearly three of every five persons experi-enced gaps in coverage, reflecting previous work which suggests that gaps in cover-age disproportionately affect minorities (Hargraves, 2004) and low wcover-age workers (Collins, Davis, Doty, & Ho, 2004). Absent policy change, insurance premiums are projected to increase over the next 10 years, further exacerbating gaps in coverage (Gilmer & Kronick, 2005; Long & Shen, 2004). Intermittent coverage with antici-pated adverse effects on continuity of care and management of chronic disease will be a typical experience for a substantial group of American adults.
The present research did not find that lack of continuous health insurance cover-age was associated with poorer self-rated physical or mental health. However, research suggests that the NLSY79 adults, now in their early 40s, will continue to be at risk for gaps in health insurance coverage as they grow older (Baker & Sudano, 2005), if current levels of insurance in the population do not change. Among persons in their 50s, lack of insurance and intermittent coverage has been associated with adverse health outcomes (Baker, Feinglass, et al., 2006; Baker, Sudano, et al. 2001, 2002; Dor et al., 2006).
The present policy atmosphere is volatile. On one hand, insurance products focusing on demand management have grown, as payors seek to restrain insurance costs. Consumer-driven health plans and other refinements to the present system of employer-sponsored insurance are being marketed to employers (Gabel, Whitmore, Rice, & Lo Sasso, 2004) and proposed by state Medicaid agencies (Sanford, 2005). In the private sector, the number of consumer-driven plans is increasing despite employers’ reservations regarding their long-term efficacy (Gabel et al., 2004). Work examining medical savings accounts, a predecessor of the current consumer-driven offerings, found that they were principally used by persons at the upper end of the income spectrum and thus would not be likely to benefit all workers (Minicozzi, 2006). Our findings suggest that such plans, with their emphasis on reducing first dollar spending, will not have immediately perceived effects on physical health
among employees of age 40 or younger. Effects among persons above age 40, or among persons with longstanding chronic disease, may be markedly different, as indicated by research among older working-age populations (Baker, Sudano, et al., 2001, 2002) and by findings from the Health Insurance Experiment of the late 1970s (Davis, 2004).
Recent actions at the state level suggest the emergence of an alternative policy direction focusing on universal coverage (Davis, 2007). While universal coverage legislation passed in Massachusetts and proposed in California, has garnered the most coverage in the popular press, 17 additional states are exploring legislation or have legislative initiatives under way to expand health insurance access (National Conference of State Legislatures, n.d.). The Massachusetts program combines a requirement that individuals be insured with subsidies for low income persons and fees assessed on business that do not offer insurance to workers (Kaiser Commission, 2006; Rowland, 2006). Whether these and other initiatives will emerge as a viable solution for extending the possible benefits of financial access to care uni-formly across the population remains to be seen.
References
Adams, E. K., Bronstein, J. M., & Florence, C. S. (2006). Effects of primary care case management (PCCM) on Medicaid children in Alabama and Georgia: Provider availability and race/ethnicity. Medical Care Research and Review, 63(2), 58-87.
Andersen, R. (1995). Revisiting the behavioral model and access to medical care: Does it matter? Journal of Health and Social Behavior, 36(3), 1-10.
Anderson, S. G., & Eamon, M. K. (2005). Stability of health care coverage among low-income working women. Health and Social Work, 30(1), 7-17.
Baker, D. W., Feinglass, J., Durzao-Arvizu, R., Witt, W. P., Sudano, J. J., & Thompson, J. A. (2006). Changes in health for the uninsured after reaching age-eligibility for Medicare. Journal of General Internal Medicine, 21(11), 1144-1149.
Baker, D. W., & Sudano, J. J. (2005). Health insurance coverage during the years preceding Medicare eli-gibility. Archives of Internal Medicine, 165(7), 770-776.
Baker, D. W., Sudano, J. J., Albert, J. M., Borawski, E. A., & Dor, A. (2001). Lack of health insurance and decline in overall health in late middle age. New England Journal of Medicine, 345(15), 1106-1112.
Baker, D. W., Sudano, J. J., Albert, J. M., Borawski, E. A., & Dor, A. (2002). Loss of health insurance and the risk for a decline in self-reported health and physical functioning. Medical Care, 40(11), 1126-1131.
Baker, E. A., Schootman, M., Barnidge, E., & Kelly, C. (2006). The role of race and poverty in access to foods that enable individuals to adhere to dietary guidelines. Preventing Chronic Disease, 3(3), A76, 1-11.
Beck, A. T., Steer, R. A., & Garbin, M. G. (1988). Psychometric properties of the Beck Depression Inventory: Twenty-five years of evaluation. Clinical Psychology Review, 8(1), 77-100.
Beebe-Dimmer, J. L., Lynch, J. W., Turrell, G., Lustgarten, S., Raghunathan, T., & Kaplan, G. A. (2004). Childhood and adult socioeconomic conditions and 31-year mortality risk in women. American Journal of Epidemiology, 159(5), 481-490.
Blackwell, D. L., Hayward, M. D., & Crimmins, E. M. (2001). Does childhood health affect chronic mor-bidity in later life? Social Science and Medicine, 52(8), 1269-1284.
Burdine, J. N., Felix, M. R., Abel, A. L., Wiltraut, C. J., & Musselman, Y. J. (2000). The SF-12 as a pop-ulation health measure: An exploratory examination of potential for application. Health Services Research, 35(10), 885-904.
Center for Human Resource Research. (2004). NLSY79 user’s guide. Columbus: Ohio State University. Centers for Disease Control and Prevention. (2006). Youth online: Comprehensive results. Interactive
data base. Retrieved August 1, 2006, from http://apps.nccd.cdc.gov/yrbss/index.asp
Collins, S. R., Davis, K., Doty, M. M., & Ho, A. (2004). Wages, health benefits, and workers’ health. Issue Brief(Commonwealth Fund), 788, 1-16.
Comer, J., Mueller, K., & Blankenau, J. (2000). Losing and acquiring health insurance: Consequences for health care. Journal of Health and Social Policy, 11(3), 1-15.
Davis, K. (1997). Uninsured in an era of managed care. Health Services Research, 31(6), 641-649. Davis, K. (2004). Consumer-directed health care: Will it improve health system performance? Health
Services Research, 39(8 Pt 2), 1219-1234.
Davis, K. (2007). Uninsured in America: Problems and possible solutions. British Medical Journal,
334(7589), 346-348.
DeSalvo, K. B., Fan, V. S., McDonell, M. B., & Fihn, S. D. (2005). Predicting mortality and healthcare utilization with a single question. Health Services Research, 40(8), 1234-1246.
Dor, A., Sudano, J., & Baker, D. W. (2006). The effect of private insurance on the health of older, working age adults: Evidence from the health and retirement study. Health Services Research, 41(6), 759-787.
Dorr, D. A., Jones, S. S., Burns, L., Donnelly, S. M., Brunker, C. P., Wilcox, A., et al. (2006). Use of health-related, quality-of-life metrics to predict mortality and hospitalizations in community-dwelling seniors. Journal of the American Geriatric Society, 54(4), 667-673.
Eberhardt, M. S., Ingram, D. D., Makuc, D. M., Pamuk, E. R., Freid, V. M., Harper, S. B., et al. (2001). Urban and rural health chartbook. health, United States, 2001. Hyattsville, MD: National Center for Health Statistics.
Egede, L. E., & Zheng, D. (2003). Independent factors associated with major depressive disorder in a national sample of individuals with diabetes. Diabetes Care, 26(1), 104-111.
Gabel, J. R., Whitmore, H., Rice, T., & Lo Sasso, A. T. (2004, January-June). Employers’ contradictory views about consumer-driven health care: Results from a national survey. Health Affairs, Supplemental Web Exclusives (W4), 210-218.
Gilmer, T. R., & Kronick, R. (2005, July-December). It’s the premiums, stupid: Projections of the unin-sured through 2013. Health Affairs, Supplemental Web Exclusives (W5), 143-151.
Guzman, B. (2001). The Hispanic population. Census 2000 brief (C2KBR/01-3). Washington, DC: U.S. Census Bureau.
Hadley, J. (2003). Sicker and poorer—The consequences of being uninsured: A review of the research on the relationship between health insurance, medical care use, health, work, and income. Medical Care Research and Review, 60(2 Suppl), 3S-75S.
Hargraves, J. L. (2004). Trends in health insurance coverage and access among black, Latino and white Americans, (2001)-(2003). Tracking Reports, 11, 1-6.
Hartley, D. (2004). Rural health disparities, population health, and rural culture. American Journal of Public Health, 94(10), 1675-1678.
Hayward, M. D., & Gorman, B. K. (2004). The long arm of childhood: The influence of early-life social conditions on men’s mortality. Demography, 41(1), 87-107.
Hurd, M. D., & McGarry, K. (1995). Evaluation of the subjective probabilities of survival in the health and retirement study. Journal of Human Resources, 30(Suppl), S268-S292.
Johnson, R. W., & Crystal, S. (2000). Uninsured status and out-of-pocket costs at midlife. Health Services Research, 35(5 Part1), 911-932.
Kaiser Commission on Medicaid and the Uninsured. (2006). Massachusetts health care reform plan (Publication No. 7494). Washington, DC: Kaiser Family Foundation.
Kasper, J. D., Giovannini, T. A., & Hoffman, C. (2000). Gaining and losing health insurance: Strengthening the evidence for effects on access to care and health outcomes. Medical Care Research and Review, 57(3), 298-318.
Keeler, E. B., Brook, R. H., Goldberg, G. A., Kamberg, C. J., & Newhouse, J. P. (1985, October 11). How free care reduced hypertension in the health insurance experiment. JAMA, 254(14), 1926-1931. Kessler, R. C., McGonagle, K. A., Zhao, S., Nelson, C. B., Hughes, M., Eshleman, S., et al. (1994).
Lifetime and 12-month prevalence of DSM-III-R psychiatric disorders in the United States. Results from the National Comorbidity Survey. Archives of General Psychiatry, 51(1), 8-19.
Laditka, J. N., Laditka, S. B., & Probst, J. C. (2005). More may be better: Evidence of a negative rela-tionship between physician supply and hospitalization for ambulatory care sensitive conditions. Health Services Research, 40(8), 1148-1166.
Long, S. K., & Shen, Y. C. (2004). Low-income workers with employer-sponsored insurance: Who’s at risk when employer coverage is no longer an option? Medical Care Research and Review, 61(4), 474-494. Lurie, N., Kamberg, C. J., Brook, R. H., Keeler, E. B., & Newhouse, J. P. (1989, May). How free care
improved vision in the health insurance experiment [published erratum appears in American Journal of Public Health(1989, December), 79(12), 1677]. American Journal of Public Health, 79(5), 640-642. McGee, R., & Williams, S. (2000). Does low self-esteem predict health compromising behaviours among
adolescents? Journal of Adolescence, 23(10), 569-582.
Mensch, B. S., & Kandel, D. B. (1988). Underreporting of substance use in a national longitudinal youth cohort: Individual and interviewer effects. The Public Opinion Quarterly, 52(1), 100-124.
Minicozzi, A. (2006). Medical savings accounts: What story do the data tell? Health Affairs, 25(1), 256-267.
National Conference of State Legislatures. (n.d.). Access to health care and the uninsured. Retrieved January 29, 2007, from http://www.ncsl.org/programs/health/h-primary.htm
Parchman, M. L., & Culler, S. D. (1999). Preventable hospitalizations in primary care shortage areas. An analysis of vulnerable Medicare beneficiaries. Archives of Family Medicine, 8(6), 487-491. Pathman, D. E., Ricketts, T. C., III, & Konrad, T. R. (2006). How adults’ access to outpatient physician
services relates to the local supply of primary care physicians in the rural Southeast. Health Services Research, 41(2), 79-102.
Pensola, T., & Martikainen, P. (2004). Life-course experiences and mortality by adult social class among young men. Social Science and Medicine, 58(11), 2149-2170.
Poulton, R., Caspi, A., Milne, B. J., Thomson, W. M., Taylor, A., Sears, M. R., et al. (2002). Association between children’s experience of socioeconomic disadvantage and adult health: A life-course study. Lancet, 360(9346), 1640-1645.
Quesnel-Vallee, A. (2004). Is it really worse to have public health insurance than to have no insurance at all? Health insurance and adult health in the United States. Journal of Health and Social Behavior,
45(4), 376-392.
Ricketts, T. C., Randolph, R., Howard, H. A., Pathman, D., & Carey T. (2001). Hospitalization rates as indicators of access to primary care. Health and Place, 7(1), 27-38.
Rosenberg, M. (1965). Society and the adolescent self-image. Princeton, NJ: Princeton University Press. Rosenblatt, R. A. (2004). A view from the periphery—Health care in rural America. New England Journal
of Medicine, 351(11), 1049-1051.
Rowland, C. (2006, April 14). Mass. Health plan seems unlikely to be US model. The Boston Globe. Retrieved January 29, 2007, from http://www.boston.com/news/local/massachusetts/articles/(2006)/ 04/14/mass_health_plan_seems_unlikely_to_be_us_model/
RTI International. (2007). SUDAAN software. Research Triangle Park, NC: Author.
Sanford, M. (2006). South Carolina health connections (1115 waiver proposal). Retrieved January 3, 2006, from http://www.dhhs.state.sc.us/dhhsnew/HealthyConnections/index.asp
SAS Institute. (2007). SAS software v. 9, Cary, NC: Author.
Schoen, C., & DesRoches, C. (2000). Uninsured and unstably insured: The importance of continuous insurance coverage. Health Services Research, 35(1 Pt 2), 187-206.
Sudano, J. J., Jr., & Baker, D. W. (2003). Intermittent lack of health insurance coverage and use of pre-ventive services. American Journal of Public Health, 93(1), 130-137.
U.S. Bureau of the Census. (1981). Characteristics of the population below the poverty level: 1979 (Current Population Reports, Series P-60, No 130). Washington, DC: U.S. Government Printing Office. Ware, J., Kosinski, M., & Keller, S. (1995). SF-12: How to score the SF-12 physical and mental health
summary scales (2nd ed.). Boston: The Health Institute, New England Medical Center.