A Comparison of Block-Matching Algorithms
for VLSI Implementation
Sheu-Chih Cheng and Hsueh-Ming Hang
Dept. of Electronics Eng.
National Chiao-Tung University,
Hsinchu, Taiwan 30010, ROC
ABSTRACT
This paper presents an evaluation of several block-matching motion estimation algorithms from a system-level VLSI design viewpoint. Because a straightforward block-matching algorithm (BMA) demands a very large amount of corn-puting power, many fast algorithms have been developed. However, these fast algorithms are often designed to merely
reduce arithmetic operations without considering their overall performance in VLSI implementation. In this paper, three criteria are used to compare various block-matching algorithms: 1) silicon area, 2) input/output requirement,
and 3) image quality. Several well-known motion estimation algorithms are analyzed under the above criteria. The advantages/disadvantages of these algorithms are discussed. Although our analysis is limited by the preciseness of our silicon area estimation model, it should provide valuable information in selecting a BMA for VLSI implementation. Keywords: Block-matching, VLSI for Motion Estimation, VLSI for Block-matching
1. Introduction
In designing a VLSI chip, there are tradeoffs among various cost factors and chip performance particularly from the entire system viewpoint.' It is thus very desirable to be able to predict the overall system performance of a certain high-level algorithm before its circuit layout being fully deployed. The focus of this paper is to discuss the impact of different block-matching motion estimation algorithms on VLSI design. Because of the complexity of the entire (motion estimation) system, decisions in choosing one algorithm versus another algorithm is often empirical and intuitive. For example, the previous motion estimator design often pay attention to only the processor complexity; however, the I/O pin number and the on-chip buffer memory size are as important in determining the manufacturing cost.
Motion estimation is an essential element in a standard video coder such as 11.261, MPEG1 and MPEG2. A straightforward version of block-matching motion estimation algorithm requires a large amount of hardware. Many fastblock-matchingalgorithms have thus been devised to reduce the computational complexity and in the meanwhile
without degrading the estimation performance significantly. Examples of fast algorithms are described in Musmann et al.2 and Hang and Chou.3 Although these algorithms were devised to use fewer arithmetic operations, they may require additional control circuits and data buffers to implement and thus may not lead lower cost in VLSI fabrication.
The hardware implementation of motion estimation algorithms can be classified into programmable VSP (video signal processor) structures and dedicated special purpose structures. Programmable VSP structures4'5 allow higher degrees of flexibility; however, they often have a lower throughput rate and generally require additional software development effort. Using today's fabrication technology, dedicated structures seem to be more economical. Therefore, we consider only the dedicated structure in this paper.
Typically, a specific motion estimation algorithm is first chosen and then a dedicated hardware architecture is. designed for this specific algorithm. For example, several hardware implementations were dedicated to the exhaustive search algorithm,6'7 and a couple of implementations to the fast algorithms.8 Systolic array architectures are popular in designing motion estimation chips because it has a regular layout and a high throughput rate and it matches the massive computational requirement of block matching. However, it also needs extra control circuitry and a specific data I/O management. We also use systolic array architecture as the basic building block in comparing various block-matching algorithms.
2. Block-Matching Motion Estimation Algorithms
Block-matching motion estimation algorithms are generally considered robust and effective for video coding pur-pose.2'3 The basic operation of a block-matching algorithm is picking up the best candidate image block in the reference image frame by calculating and comparing the matching functions between the current image block and all the candidate blocks in a confined area in the reference frame. The size of block and the confined area (so-called search area) have a strong impact on the performance of motion estimation. Block size of 8 by 8 or 16 by 16 are generally considered adequate by experiments and the international video standards adopt 16 by 16 block size, which is also used in this study. To decide an adequate search area is somewhat involved. It depends on both the contents of pictures and the coding system structure. For videophone applications, small pictures and slow motion are expected and thus the search range is assumed to be small (around 7 pels). On the other hand, the MPEG compression schemes are expected to be used on larger pictures and they often have a longer temporal distance between two predictive frames (P-frames).9 Hence, a much larger search range (say, 47 pels) is necessary. Furthermore, the picture size and frame rate also have a strong impact on the VLSI cost. These parameters are summarized in Table 1 for CCIR-601 and CIF pictures. The former picture format is targeting at MPEG applications and the latter, videophone applications.
Another important factor that affects the block-matching hardware complexity is the matching criterion. To reduce the computational complexity, the mean absolute difference (MAD) criterion is adopted by almost all the VLSI designs in the market and in the literature. It (MAD) provides a nearly comparable motion estimation performance to the other complicated matching criteria such as mean square error.2'3 However, some block-matching algorithms calculate the frame differences only on the decimated pels (described in the following subsections) ,asubsampling pattern inside a block. Hence, we define two terms: SAD(sumof absolute difference) is referred to the ordinary MAD performed on every pel inside a block, and SDAD (sum of decimaied absolnie difference) is the MAD that performs only on the decimated pels. That is,
N—i N—i
SAD(u,v) =
E 1 f(x,y,t)—f(x—u,y—v,t—zt),
—a" <u,v<w—1, (1)3:=O y=O
SDAD(u,v) =
>:
(2)(z,y)E subsampling pattern
where f(x, y, t) and f(x —u,y —v,t —
zt)
are the pel values in the current block and in the reference (frame) block, respectively, (x, y) is the pel coordinate relative to the current block location, (u, v) is the (backward) motion vector, and t is the time difference (temporal distance) between the current and the reference frames. The final motion vector is the one minimizes the MAD criterion:rnin{SAD(u,v)}, or rnin{SDAD(IL,v)}
—w<u,v<w—1.
(3)In general, we need N2subtractions, N2 absolute operations, and Nx (N — 1) additions to compute one point of
SAD(u,v). ForSDAD, all the above operations are reduced nearly by a factor of four.
2.1. Exhaustive Search
The most straightforward searching algorithm is the exhaustive search (full search), which evaluates all the possible displacements (motion vector candidates) inside the search area. In each block time interval, (2 + 1)2SAD search points and (2w + 1)2 two-term comparisons must be calculated to find the best match.
2.2. Three Step Search
This popular fast search algorithm is proposed by Koga.'° It starts with a step size equal to or slightly larger than half of the search range. In the first step, the algorithm compares and selects the minimum SAD from the nine candidate locations located on the corners and the mid-points of the square borders one step size away from the center. In the second step, the step size is halved and a new minimum SAD location is obtained by comparing the SAD values of the new eight locations centered at the minimum point in the previous step. The above procedure is repeated until the step size becomes one-half and the final motion vector is thus found. In total, there are log2(w + 1) search steps and 1 + 8 log2(w + 1) SAD search points for each image block.
2.3. Modified Log Search
This fast search algorithm is proposed by by Kappagantula and Rao." Each search step is broken into two sub-steps. In the first sub-step, five search points are evaluated. They consist of the central point of a diamond-shape region and the 4 search points located one step size away along the four directions of the horizontal and vertical axes. If the minimum-error position is the central point, the step size is halved and the above process is repeated again. Otherwise, one of the corner points is the minimum point and the second sub-step starts. Two additional search points located one step size away from the minimum point are evaluated. These two new search points are located vertically if the first sub-step minimum point is on the horizontal axis. Otherwise, horizontal search points are used. The minimum among these 3 search points becomes the center of the new diamond-shape region with a step size equal to half of the previous step size. Then, the next search step starts. The above procedure continues until the step size becomes one-half. The number of calculations in this algorithm varies depending upon the location of final motion vector. However, we need to consider the worst case situation in VLSI design and thus there are (6 log2(w + 1) + 1) SAD operations for each block.
2.4. Alternate Pd Decimation (APD) Search
This algorithm is proposed by Liu and Zaccarin.'2 It differs from the previous fast algorithms in that it tries to reduce the calculations involved in each SAD operation but maintains the overall motion estimation performance at a comparable level. The basic concept is subsampling the pels inside a block and compute the differences only on the decimated pels. This algorithm can be explained by using Figs. 1 and 2. Figure 1 shows a block of 8 x 8 pels with pels labeled a, b, c, and d in a regular pattern. The subsampling pattern A is made of all a pels. Patterns B, C, and D are similarly defined. Figure 2 shows the pels in (a portion of) the search region. They are labeled 1, 2, 3, and 4. For example, when a 1 pel is a motion vector candidate, pattern A is used as the subsampling pattern to pick up the pels in calculating SDAD. Similarly, pattern B, C,andD are subsampling patterns for candidates located at pels 2, 3, and 4, respectively. For each of the subsampling patterns, the minimum SDAD candidate is retained. Then, the full SAD is computed using all the block pels for these four candidates and the best one becomes the final motion vector.
In the above procedure, (2w + 1)2DSADoperations are needed for each block. In addition, four SAD operations are calculated for the final motion vector selection. However, when the search range becomes large, the four SAD operations become negligible. Essentially, the computational complexity of this algorithm is roughly a quarter of that of the exhaustive search.
3. VLSI Implementation and Complexity Analysis
There are several important factors that have to be considered in choosing an algorithm for VLSI implementation, for example, i) chip area, ii) I/O bandwidth, and iii) image quality. We will discuss the first two issues in this section and the third issue will be discussed in Sec. 5. In implementing block-matching algorithms, the chip area can be approximated by
Atoai = + Abf +
(4)where At,, is the area for the computation kernel, Abf is for the on-chip data buffer, and is for the system controller. In this case, the system controller is essentially a data flow controller, which contains an address generator and a data mapper. A specific data flow controller is needed because the systolic array structure used to compute
SAD requires specific ordering of data. Due to the very massive data used in computing motion vectors, it becomes impractical for the processing array to access image data directly from external memory because it results in a very high bus bandwidth requirement. In addition, the search regions of nearby blocks are largely overlapped; hence, an internal buffer is introduced to relieve of the external memory access. The block diagram of a motion estimation system with internal buffer is shown in Fig. 3. The memory controller reads the current and the reference image blocks from external DRAM. These data are stored in the curreni-block buffer and reference-frame buffer, respectively. The external memory bandwidth depends on the size of internal buffer and this topic will be elaborated in the next section.
3.1. Mapping Algorithms to Architectures
Systolic architectures are good candidates for VLSI realization of block-matching algorithms with regular search procedure.'3 A typical systolic array consists of local connections only and thus does not require significant control circuitry overhead. In this paper, a basic systolic architecture is adopted for estimating the silicon areas of various block-matching algorithms. Its general structure is displayed in Fig. 4. The processor array contains 16 x 16 or 8 x 8 processor elements (PEs) depending on whether the alternate pel decimation (APD) technique is in use. If the number of PEs (NPE )isless than 16, then the system is reduced to one-column architecture as shown in Fig. 5. Four types of computing nodes are used in this structure. The subtraction, absolute, and partial addition in SAD or SDAD operations are performed by the 'PE' node. The summation operations are done in the 'ADD' nodes. The 'CMP' nodes compare the candidates in the searching area and select the minimum one. The 'AP' node which combines the operations of summation and comparator is used when the speed requirement is not critical.
In the 2-D array structure, the current block data, c(k, 1), k, 1 =0,..., 15,are first loaded into each 'PE' node. Then, the reference block data, r(i + k, 1), slide in from the left. The calculation for a reference block starts from the upper-left corner of the processor array. During the first clock cycle, the c(O, 0) node computes the difference between r(i, 0) and c(O, 0). Then the result is passed to the PE node below. During the second clock cycle, the c(1, 0) node computes the absolute difference between r(i + 1, 0) and c(1, 0) and adds its result to the partial sum propagated from above. In the meanwhile, node c(O, 0) computes the absolute difference between r(i, 1) and c(O, 0), and node c(O, 1) computes the absolute difference between r(i, 0) and c(O, 1). After 16 clock cycles, the first partial sum, Ir(i +k, 0) —c(k,0)1 is
completed and placed into the left-most ADD node. In the following clock cycle, this partial sum is passed to the next right ADD node and added together with the second partial sum, Ir(i+k,1)—c(k,1)1. The total sum for the motion vector candidate (i, 0) is completed and propagated to CMP in the following 14 clock cycles. This SAD is compared against the stored SAD resulted from the previous comparison, and then the smaller one is kept in CMP for further comparison. The computation procedure for the one-column array is similar. It is clear that an address generator is needed to generate the proper addresses to retrieve processing data, and then these data have to be distributed properly by a data mapper to the processor array at right timing. The efficiency (EFF) of an array architecture is defined to be the ratio of the effective operating time (of all PEs) to the total operating time (of all PEs) including the idling time for data loading.
The silicon area of the computation kernel used in this architecture can be approximated by
An,, =NPE X APE + NADD X AADD + NCMP X ACMP, (5)
where NPE ,NADD, andNCMP are the numbers of 'PE', 'ADD' and 'CMP' nodes, respectively; and APE ,AADD,and
ACMP are the silicon areas of 'PE', 'ADD' and 'CMP' nodes, respectively. The number of PEs is decided by clock rate and picture size. To increase the utilization efficiency (EFF) of PE, if one-column array is sufficient to process the data in time, it will be chosen. Otherwise, the 2-D array is forced to be used.
Search areas of adjacent blocks overlap quite significantly. This overlapped area data can be stored inside the internal (on-chip) buffer to reduce external memory accesses (bandwidth). Three types of internal buffers are under evaluation: i) type 'A' buffer whose size equals to the search area, (N + 2w) x (N + 2w) bytes; ii) type 'B' buffer that hasthe size of one slice of search area; that is, the height of block (or sub-block) times the width of search area, x bytes; and iii) type 'C' buffer that has the size of a block or a sub-block, x bytes. Note that the parameter D in the above expressions equals to 1 or 2 depending on whether pel decimation technique is used.
An picture frame contains 7- picture slices, and there are -blocks in each slice. In order to derive the I/O
bandwidth requirement, we first calculate the new data size loaded from the external memory to the on-chip butter for each block. Tentatively, let us ignore the initial condition and the blocks near the picture boundary. As shown in Fig. 6(a), the new loading data size for type 'A' buffer is N x (N + 2w) bytes when the next block is on the same picture slice. For processing one picture slice, we need to load the complete buffer at the beginning of a slice; thus, the total external data access is approximately [(N + 2w)2
+ (-
— 1) x N x (2w + N)] bytes if boundary block cases are neglected. Then, for the entire picture, the total external data access is approximately f,. x ¶x[(N+2w)2 -i-( — 1) xN
x (2c,.+N)] bytes. Similar analysis can be carried over to the cases of type 'B' and 'C' buffers as shown in Fig. 6(b)(c). The exact sizes of type 'B' and'C' buffer depend on the search algorithms and will be discussed in the next sub-section.3.2. Implementation Complexity
3.2.1. Exhaustive search In this algorithm, the computation kernel has to perform (2w + 1)2ormore SAD opera-tions in each block time. If we use only one PE, the clock rate has to be higher than 93.57 GHz for encoding a CCIR-601 4:2:2 resolution picture with a search range of 47 pels. This is impractical. Generally, the maximum clock speed is upper bounded by the fabricating technology and I/O limitation. To make our analysis more general, we assume an X-MIIz clock being employed. The efficiency of systolic architecture for the exhaustive search approaches 100% because the input data flow is regular and can be arranged in advance. In this case, the number of PE operations is
OPFUL NSAD X N2 x B = (2w + 1)2xN2 x B, (6)
where NSAD S the number of SAD operations in each block, and B is the number of blocks per second (in Table 1). Thus, the number of PE nodes required in this structure under the maximum system clock constraint becomes
OPFUL B x (2w + 1)2xN2
NPE=
=
x
(7)For type 'B' buffer, each search area contains 2w + 1 horizontal lines and the new loading data size for the next candidate line is (2w + N) bytes. Therefore, the total input data for one block is (N + 2w)2 bytes. For type 'C' buffer, there are (2w + 1) candidate positions on the same line and in this situation, the new data size for the next position on
the same line is N bytes. Thus, the total input data size for one block is (2w + 1) x [N x (2w + N)]x B bytes. The
various parameters under different configurations are listed in Table 2.
3.2.2. Three step search We still use the basic systolic structure described in the previous sub-section to implement this algorithm. There are [8 x log2(w + 1) + 1] SAD operations to be performed for each block. If we choose the one-column architecture, (NPE + 2) data have to be loaded before execution in each search step because we do not know which data to be processed until the completion of the current step. Thus, the efficiency of the one-column structure is approximately
Nacck X NSAD
EFFTSS =
Nacl_ck X NSAD + Nload_ck X Nstep
= N2
NPE x(8log2(w + 1) + 1), (8)
x (8 log2(w + 1) + 1) + (NPE +2) x log2(w + 1)
where NacL.ck, Nloadck, and Nsep are the numbers of active operations (in clock cycle), data loading (in clock cycle), and search steps. Therefore, the total number of FE operations per second is
OPTSS = B x (8log2(c + 1) + 1) x N2 x (EFFTSSY', (9)
and thus the number of PEs becomes
N —OPTSS — — /((xI)2—41og2(w + 1) x [8log2(w + 1) + 1] x N2 x B2
(10)
PE
X —
2 x B x log2(w + 1)where x' = X —2log2(w + 1) X B. The value of NPE iS smaller than 256 for CCIR-601 and CIF format pictures. Hence, the column architecture can be used, which saves chip area. However, the data flow controller in this architecture is more complicated and costs more chip area to implement.
For type 'B' buffer,
at the search step, we need to load (w + 1) x 2' bytes new data. Thus, the total input data per block are roughly (N + 2w)2 bytes. For type 'C' buffer, (8 log(w + 1) + 1) blocks of reference data are needed for computing one current block. All the above parameters are listed in Table 2.
Similar analysis can be applied to the other search architectures. However, due to limited space, we cannot give detailed explanation here, but place the final expressions on Table 2.
4. Chip Area and I/O Requirement
4.1. Chip Area Estimation
In order to obtain the more exact estimate of chip area, we have done two levels of simulations and analysis. One is the behavioral level and the other is the sLrucLure level. At the behavioral level, these algorithms are implemented by C-programs to verify their functionalities. At the structure level, the architectures of key components in each algorithm are implemented using the Verilog hardware description language (HDL) and then we extract the area information from Synopsys design tool. Synopsys tool produces an optimized gate-level description under the constraint of a 0.6 im single poly double metal (SPDM) standard cell library.
As discussed earlier, the search range depends on coding system structure and applications (picture size and content). In a typical MPEG2 encoder, the search range can be empirically decided by (15 + 16 x (d —
i)),'
where 'd' representsthe distance between the target and the reference pictures. Hence, in our first set-up for encoding CCIR-601 pictures, the search range is chosen to be 47 (distance d = 3). The chip area estimates for the computation kernels in various
cases are listed in Table 3. In this table, the meaning of No. of PE operalion, No. of FE node and Archieciure Efficiency are defined in Sec. 3.2. as OF, NPE, and EFF. Item Chosen NPE comes from rounding the number NPE up to the nearest integer number that can fit into the chosen array architecture. The speed requirement of PE node is obtained by diving the number of PE computations (OP) by the C'hosen FE entry. The areas of 'PE', 'ADD', and 'CMP' are provided by the Synopsys tool under the clock rate given in the Speed entry.
In this design, we choose a two-port internal buffer to increase the PE utilization efficiency. The buffer size and access time requirement are determined by the chosen system architecture. However, memory modules are not supported by our ASIC library. Therefore, an area estimation model of two-port memory proposed by Chang'5 is used to generate the parameters in Table 4. When the chosen NPE 5 bigger than the block size, the 2-D systolic structure (Fig. 4) is then used. In the 2-D structure, the current block data can be pre-loaded into each PE; therefore, the internal current buffer can be omitted. It cannot be omitted for the 1-D structure. But in both cases, we always need the reference block buffer, which is Often much bigger.
A list of areas of the critical elements in various block-matching algorithms is shown in Table 4. The area of
computation kernel is derived from Table 3 got with (5). At the end of this table, the total chip area, Atoai specified by (4), is the combination of the computation kernel, the internal buffer, and the data mapper. However, we need to choose one of the buffer types in calculating A2oal. Here, we simply choose type A buffer in all cases (the shadowed row), since it simplifies the array address generator and reduces the I/O bandwidth. From Table 4, we find that the chip area of the full search algorithm is approximately 10 times larger than that of the other algorithms for CCIR-601 pictures. If we consider only the chip area, the three-step search and modified-log search have about the same chip area and seem to be the preferred choices.
The above analysis can to applied to the other sizes of pictures. In the application of video conferencing, we assume that the picture size is CIF running at 10 frames per second, and the maximum search range is 7 pels since slow motion is expected most of the time. The hardware costs of all algorithms are comparable for this particular case; however, due to limited space, we cannot display the results here.
4.2. Chip I/O Configurations
The number of I/O pads is one major factor in chip fabrication cost. The I/O pin counts, PADGE,, in block-matching case can be approximated by
PADa11 PADMEM + PADconroi + PADpower, (11)
where PADMEM is the bus width connected to the external memory, PADconroj and PADPOwC,. are the pads for control signal and power supply. Among them, PADconroi and PADP0we,. are nearly constant. It was reported6 that they are around 28. There are two approaches in calculating the I/O bandwidth requirement. We could assume a minimum external memory access time (decided by the available DRAM, say) and then calculate the minimum bus width, PADMEM. Or, we first assume the PADMEM value, and then calculate the maximum allowable memory access time. In Table 5, the latter approach is taken. We first assume that PADMEM equals to W, then list the maximum allowable memory access time on the table. The larger access time implies an easier situation that either we could find a slower speed DRAM to meet our requirement or we could reduce the memory bus width (smaller W). As one may expect, type A buffer is preferred at the cost of larger internal buffer.
5. Picture Quality
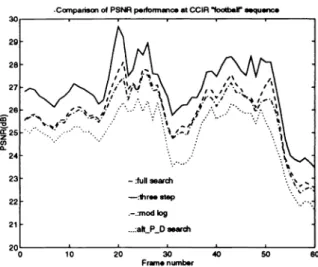
Since different block-matching algorithms are used, their image quality may not be identical. Although PSNR may not be a good measure for the subjective image quality, it may still be a reasonable indicator for quality comparison. The PSNR is defined to be the peak signal power (2552)tothe mean square motion estimation errors. Several sequences have been tested. Limited by space, only two of them are reported here. Figure 7 shows the motion estimation errors for the CCIR-601 image sequence Football using a search range of 15, since the distance between two P-pictures is 1. Figure 8 shows the results of a CIF image sequence Table Tennis with a search range of 7. It is clear that the full search algorithm outperforms all the other algorithms. The three-step search and modified log search are lower by roughly 1 dB in PSNR. The subsampling technique has a better performance on slowly moving pictures (such as Table Tennis) but has a lower performance on fast moving pictures (such as Football). Although there exist a couple of dB differences in estimation errors, they are close to each other in coding performance (bit rate and image quality). Hence, they all seem to be adequate for motion estimation.
6. Conclusions
The purpose of this study is not to propose a VLSI architecture for implementing a specific block-matching algorithm (BMA) but to evaluate various block-matching algorithms from both the VLSI viewpoint and the image coding viewpoint. A procedure is suggested to assist VLSI designers to choose a good block-matching algorithm adequate for their particular applications. Our assessment in this paper is based on silicon area, I/O requirement and image quality. A universal systolic arrays structure is used to realize all the BMA candidates. A distinct feature in our study is to look into the effect of different sizes of the on-chip memory. Although we did not complete the layout of each realization, the key elements in the hardware have been implemented using Verilog language and their silicon areas are extracted with the help of Synopsys tool based on a O.6,um SPDM standard cell library.
Examples of applications at CIF and CCIR-601 picture resolutions are examined. We found that the relative performance in chip area and I/O bandwidth between various algorithms is strongly picture size (and application) dependent. For small pictures (CIF) and slow motion (small search range), all the BMAs under consideration are on a par. However, for larger picture sizes (CCIR-601) and fast motion, certain fast search algorithms have the advantage of smaller chip area. For a specific algorithm, one may tune the hardware structure to achieve a more economical design.
However, our study here should be able to provide a guideline and a methodology in choosing a high-level algorithm from system and application viewpoints.
7. REFERENCES
[1] K. Kucukcaker and A. C. Parker, "A methodology and design tools to support system-level VLSI design," Tech. Rep. Department of Electrical Engineering-Systems, University of Southern California, June 1994.
1001 /LZLZ •I°A 3IdS ococ oocoi
puos
id
3poq jo 1qumu B mUI
1IS
UITtUHXW 91 X9j
91 X 91 N X N Z!S 3poq 01 oc -'JrinDrd
Z!S t1J X "J OL X O9' SC X 3m2Drd dID 109-IJIODjoquIi
SiUI1d
1111d
pJidS
flIA
sinpid
j13
pu
TO91IDD OJsiunid
uoicwis
uoiop
:
66T
Uflf
'IiZ9JH2ZUfl fiUflJ-OVZ?/3 1VUOVN 'fiUZJ2UZfiU3 9dzuoqaj3 Jo d;n;zlsui's!sT
J,sm
'U!9Sa3o1dis
OOpIA JOJ SU!Sp JflpOW AJOU1U!diip-u,,
'''o
s
J
[T166T
dd'
JOA 'UflUL1LLOQ IJVVJJ :fiuz-99OJJ
jvufzg'u!po3
OpTApsuduio
uoioui
pjj/uiiij
A!dpy,,
'I1H
'pulAglyj
'!d
v
[FT] 6g6To
'LL?69? dd 'OT °N'9
j0A 'ftLL79IIg puvspnan
suvij
cisai
'swqoj
uupm
poq
ioj
sinpiipn
iiy,,
'ipsild
d
p'
iuio,j
j
[]
66T
judy
'LTiFT
dd'
°N Is" '7OUtIdLL OpZfl tofswsfig
puvsnaJz3
•suv
¶3jj
'SiOA
UOVOU1 pojq Jo UOi2!1WJS3 H4 JOJSWIjLiO
J
'UU3
V fli'[{iJ
S6TdS
'TOTTTOT dd '-iioc jOA UflUL1UOQ SUV4J33jJ
'UipO
fl1FCiJJUiA!pip1d
psudwo
uoiop,,
'oij
j
pu
[TT}gOTTO
dd AON'v'i
'sui
MM 'fuo[)•unwwo3L
7VNO4f
UI Oap!A JoJ U!pO3U1JJJU!
pOsuadmo-uoi1o} ,,'oiniqsjj
pii
'uiiCq
A'ouuiH
y
'uinuq
'o)j
j
[oil 66T'SSid
!''PY
:YD'oiJ
ires 'spooMMf
P
UH
YH
•P
jVflSZfl Jo yooqpuvj U! Op!Apu
'j
pu!Aiy
.j
[6166T
AVPT'
°N'T
i0
'73
Z3ULflSUO3 9UVJJ¶3H1
'uo;mJs3
uoroui
io;inpupi
IS'TA Y,,'Oi?Sd
d
P
'iq3soqJJ
d
'zojf
U Y '1SO3y
[si 6S6T •PO'9TT6OT
dd 'OT •°M'9
jOA 'stu1sfiS puv SZflaLZ3 SUV4]¶33J
is-nj
uq3w-poq
iojsinpiipi
JS'jA'-is
w
SOAJ
i
[LI 686T •PO 'LL?69g dd'O
°N'9
IO
'SUL7S
puv slzlldJzQ •suvkLI3YiI
uo!su3dwo3
uoom
iojusp
IS'TAjo
puiij
y,,'M
i
pu
un
J
PI'UA
PT M [91 T'66T '17-i/i dd (6UZ99dO.2(J I5VULIof
9Jfl7Zt/LV
7flVJVJ, UO tU7UflbOflO33J
'U0!9!A 1UthU03PU
UipO3'uissooid
1UJ!
iojnpwpre
(dsA)
uissoid
03p!A dN3 31211!9 'osodind V,, 'AAJ Y d'PS
'IN
SILTOJAI U f 'UflI fJ
' flOU3POODf
[I
1766Tiaii
'O17LT17 dd'JoA
'6(JSS
VOlaoj
'03
ZOEdJN OJ dSU°P!A,,
onoy
){ II1? UOSIIM 'OU)fRJ, 11 'einjoAoj4p
'injy
j4[}
66T
''d
3iU13p3y:y3
'o!G
'SpOOMMF
PU
Ufl
i'\T-HP
i'\T-A'noq3
uoTop,,uoimi1s
ioj
1u1!
unbs
'UO!S931dWO3 U! Jo /V7&SZ4 -ULO3pu
U1Hisi-
ii
[]
6T
Jdy
'817-? dd'L
joA'33
d04J'uipo
[np!d
U! sTreApy,,'Jj?JD
fH
pU
'lpSfldd
'UUU1Sfl1\J0
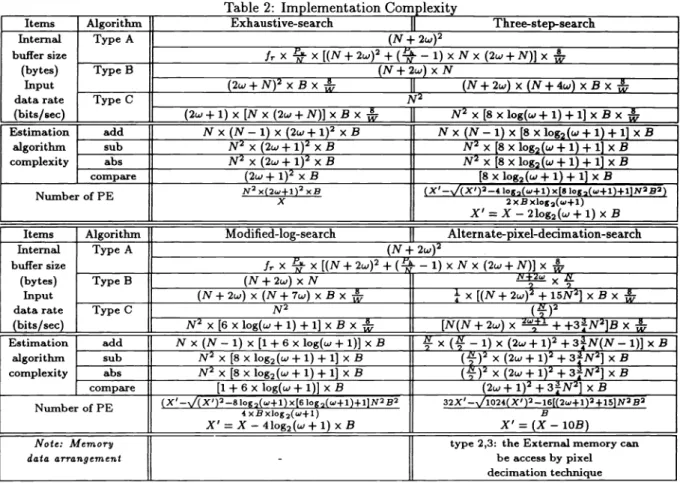
II [1Table 2: Implementation Complexity
Items Algorithm Exhaustive-search 11 Three-step-search
Internal buffer size (bytes) Input data rate (bits/sec) Type A (N + 2w)2 Jr X X [(N+ 2w)2+(5- —1) xN x (2w + N)] x Type B (N + 2w) x N (2w + N)2 x B x JJ (N + 2w) x (N + 4w) x B x Type C (2w + 1) x [N x (2w + N)] x B x J[ N2 x [8 x log(w + 1) + 1] x B x Estimation algorithm complexity add N x (N —1)x (2w + 1)2xB N x (N —1)x [8 x log2(w + 1) + 1] x B sub N2 x (2w + 1)2xB N2 x [8 x log2(w + 1) + 1] x B abs N2 x (2w + 1)2 x B N2 x [8 x log2(w + 1) + 1] x B compare (2w + 1)2 x B [8 Xlog2(w+ 1) + 1] x B
Number of PE N2 x(2w+1)2
x
xB (X'_.y4Xl)2_4 log2(w+1)x(81og2(c&+1)+1]N2B2)2xBxlog2(w-fl)
XI
=X
—21og2(w+1)x B Items Algorithm Modified-log-search Alternate-pixel-decimation-search Internal buffer size (bytes) Input datarate (bits/sec) TypeA (N+2w)2 frX X [(N+ 2w)2 + ( 1)x N x (2w + N)] x (N + 2w) x N x Type B (N + 2w) x (N + 7w) x B x - x[(N + 2w)2 + 15N2] x B x TypeC N2()2
N2 x [6 x log(w + 1) + 1] x B x [N(N + 2w) x + +3N2]B x Estimation algorithm complexity add N x (N —1)x [1 + 6 x log(w + 1)] x Bx (
— 1)x (2w + 1)2 + 3N(N —1)]x B sub N2 x [8 x log2(w + 1) + 1] x B (f)2 x (2w + 1)2 + 3N2] x B abs N2 x [8 x log2(w + 1) + 1] x B (f)2 x (2w + 1)2 3N2] x B compare [1 + 6 x log(w + 1)] x B (2w + 1)2 + 3N2] x B Number of PE (X' —81+1) x)og2(w+1)+1]N2 B2 X'=X—4log(w+1)xB 32X' X'=(X—lOB) Note: Memory,, data arrangement-type 2,3: the External memory can be access by pixel decimation technique Exhaustive search Three-step search Modified-log search **APD search No. of PB operation (* 1O) (OP) 4,74 0.36 23.4 No.ofPEnode
N
4.8 3.67 235.6 Chosen N 1024 8 8 256 Architecture Efficiency (EFF) 100% 95.4% 90.8% 99% PE Speed requirement (ns) 10.94 16.73 16.96 10.86 Area of P13 node (Gate counts) 439 419 419 439Area ofADD node (Gate counts) 260 252 252 260 Area of CMP node (Gate counts) 627* 257 257 627k 1002 ISPIEVol. 2727
Table 3: Estimated areas of computation kernel for CCIR-601 pictures
S :muttiple input comparator
Table 4: Estimated areas of the entire chip for CCIR-601 pictures AIorithm Full search Three step search Modified log search &pd search CCIR format A — i.ssiw 1.551W 1351W 1.551W
..
0.255W 0.138W 0.08W 0.77W CIF format.-
0.018W 0263W 0.349W 0.141W A — 63.25W 63.25W 63.25W 63.25W 35.073W 23.91W 16.19W 26.64W2
4.384W 4.93W 6.49W 6.92W ab
ab
a
b
ab
Cd
cd
Cd
cd
ab
ab
a
b
ab
Cd
cd
cd
cd
a
b
ab
ab
ab
Cd
cd
cd
cd
ab
ab
ab
a
b
Cd
cd
cd
cd
32
3 2 4 1 4 1 32
3 24
1 4 1Table 5 : The external memory access time requirement*
S :Type lifflernat buffer size has been considered in total asea. **:AIternae-Pixe1-Deàination
*: theunit is ns/bit, **:alternatepixel decimation
W: the bus width for external memory
Figure 1: Decimated patterns for computing SDAD
Figure 2: Alternating schedule of pels in search region for alternate pel decimation search
chip
Figure 3: Block diagram of a general motion estimation
reference data in
r(i,17) r(i,16) r(i,15) —— — r(i,2) r(i,1)
r(i,O)
r(i+1,16) r(i+1,15) r(i+1,14) —— r(i+1,1)r(i+1,O)
r(i+15,2) r(i+15,1) r(i+15,O)
0 0 0 FE
PE -
- - - FE c(o,o) c(0,1) c(0,15 FE PE -- - - FE c(1,o) c(1,1) c(1,15II
11111Figure 4: Block diagram of a 2-D NPE systolic architecture for block-matching
reference datain
z(i.16) r(i.15) —
— — —
r(i,2) r(i,l) ii,O) r(i+1,15) e(i+i,14) ii+I,1) r(i+i,O)
r(i+l,14) r(i+2,13) ——— z(i+2,1)
x(i+15,i) r(i+i5O)
current data in
c(0,O) c(O.1) c(O.2) —— — — c(O,15) c(O,O) c(O.l)
c(1,O) c(i.I) —— — — c(i.14) c(1i5) c(1.O) c(2i)—— — — c(2,13) c(2,14) c(2,15)
c(15.O) c(15.l) c(15.2)
1004 ISPIE Vol. 2727
(b) for type 'B' buffer size
vector
Figure 5: Block diagram of the systolic architecture for small NPE
one search area
thesameineof
j type B buffer size candidate point
_____ slice _____ block new loading data t type C buffer size
next candidate line -- :new loading at next
________ type'A' buffer size candidate point
new loading data for (c) for type 'C' buffer adlacent block
(a) for type 'A' buffer
Frum. number
Figure 7: PSNR performance of motion estimation algorithms on the CCIR Football sequence
30
Frum. number
Figure 8: PSNR performance of motion estimation algorithms on the CIF Table Tennis sequence