涵蓋領域:科技管理
網絡結構對創新績效的影響─以高科技產業聚落為例
The impact of network structure on innovation
performance - The case of a high-tech cluster
邱彥婷
Yen-Ting , Chiu
國立高雄第一科技大學 行銷與流通管理系
李亭林 Ting-Lin, Lee
國立高雄大學 亞太工商管理學系
林彥亨 Yen-Heng , Lin
國立高雄第一科技大學 行銷與流通管理系
聯絡地址:700, Kaohsiung University Road,
Kaohsiung, Taiwan
電話:0930-958608
ABSTRACT
Recently, scholars have drawn on network literature to highlight the importance of external resources available to the firm through its networks. The strategic network perspective avers that the embeddedness of firms in networks of external relationships with other organizations holds significant implications for firm’s innovation performance. This research focuses on relationships between network position variables and innovation performance. This study analyzes the LCD and optoelectronics cluster of Southern Taiwan Science Park from a social network point of view. Different network position variables are investigated for their impact on innovation performance in the LCD industry. Results reveal that network position indeed influences innovation performance. Furthermore, coreness turns out to be the most interpretable position variable for innovation performance.
Keywords: social network analysis, network position, LCD industry, industrial
cluster, innovation performance.
中文摘要
近來,學者廣泛的引用網絡文獻來點出外部可得資源對廠商網絡的重要性, 策略性的網絡觀點堅稱廠商與其他組織的外部關係之鑲嵌性會顯著的影響廠商的 創新績效。而台灣南部科學園區的光電產業在全球的光電產業上乃是扮演一個非 常重要的角色,因此了解南科 LCD 產業廠商間的關係及如何促進廠商的創新績效 是非常重要的。 本研究主要在探討網絡位置變數與創新績效間的關係。除此之外,本研究也 著重於那一種網絡位置變數在 LCD 產業中是對創新績效最有解釋力的,因為不同 的網絡位置所描繪的概念乃是不同的,因此這有助於本研究找出哪一種網絡結構 對創新績效的影響最大。 本研究從社會網絡的觀點分析南部科學園區的 LCD 產業與光電產業。研究結 果顯示網絡位置的確會影響廠商的創新績效。更進一步來說,核心性對創新績效 來說是最有解釋力的網絡位置變數。 關鍵字:社會網絡分析、網絡位置、LCD 產業、產業聚落、創新績效。2
1. Introduction
1.1 Research Background
In past researches, scholars use resource-based view (RBV) to explain firm performance (Barney, 2001; Peteraf, 1993). However, the RBV focuses its attention almost exclusively on resources and capabilities internal to the firm. Recently, scholars have drawn on network literature to highlight the importance of external resources available to the firm through its networks (McEvily & Marcus, 2005; Gnyawali & Madhavan, 2001; Gulati & Garguilo, 1999). The strategic network perspective holds that the embeddedness of firms in networks of external relationships with other organizations holds significant implications for firm’s innovation performance (Ahuja, 2000). This study follows these literature streams to think that firms with superior network position maybe get a better innovation performance.
1.2 Research Motivation
The optoelectronics industry of Southern Taiwan Science Park (STSP) plays an important role in the optoelectronics market worldwide, and it has a great effect on the economic development of Taiwan. In 2002 the Taiwanese government announced the policy of “two trillion double stars” for boosting the domestic optoelectronics industry. Within the optoelectronics industry the LCD cluster plays an important role. Since the ability to develop new products is a critical performance indicator to high-tech firms, this study intends to examine the relationships between network position and innovation performance. Within this context, following research questions are taken into consideration:
1) What are the major motivations for companies to settle in STSP, and have expectations been met so far?
2) What impact do network positional variables have on a firm’s innovation performance?
3
innovation performance?
2. Literature Review
2.1 Direct Ties and Innovation Performance
Direct ties could affect a firm’s innovative output positively (Ahuja, 2000), and this is because direct ties provide three substantive benefits: First, direct ties facilitate knowledge sharing (Berg, Duncan, & Friedman, 1982). When collaboration relationship exists among firms, the relative industry knowledge is available to all partners. Thus, each partner can potentially receive a greater amount of knowledge from a collaborative firm. Second, collaboration facilitates bringing together complementary skills from different firms (Arora & Gambardella, 1990). Technology often demands the simultaneous use of different sets of skills and knowledge based in the innovation process (Arora & Gambardella, 1990; Powell, Koput, & Smith-Doerr, 1996). Hence, these different knowledge from variety of firms could facitate innovative ideas. Third, the effect of direct ties emerges through scale economies in research that arise when larger projects generate significantly more knowledge than smaller projects. Collaboration enables firms to take advantage of such scale economies. In addition, in a biotechnology start-ups, Shan, Walker, and Kogut (1994) found that the greater the number of collaborative linkages formed by a start-up, the higher the innovation performance. And Ahuja (2000) found the same results in the chemical industry.
Besides, firm’s communication relationship with knowledge-producing institutions such as universities, research institudes, technology-providing firms and bridging institutions such as providers of technical or consultancy services all enable knowledge sharing and exchage (Drejer, Kristensen, & Laursen, 1999). Furthermore, firms without collaboration relationship maybe also have communication relationship. Communication relationship makes firms to exchange information about technology, industrial development and etc. What information do these firms exchange depends on their ties strength. Hence, the more direct ties a firm maintains, the more information the firm holds. Then firms may exploit the information to their advantage (Burt, 1992). Accordingly, we hypothesize that:
4
H1: The more direct ties a firm has, the greater the firm’s innovation performance will be.
2.2 Closeness Centrality and Innovation Performance
An interfirm linkage can be a channel of communication between the firm and many indirect contacts (Mizruchi, 1989; Davis, 1991; Haunschild, 1993; Gulati, 1995). A firm’s partners bring the knowledge and experience from their interactions with their other partners to their interaction with the focal firm, and vice versa (Gulati & Garguilo, 1999). A firm’s linkages therefore provide it with access not just to the knowledge held by its partners but also to the knowledge held by its partner’s partners (Gulati & Garguilo, 1999). The network of interfirm linkages thus serves as an information conduit, with each firm connected to the network being both a recipient and a transmitter of information (Rogers & Kincaid, 1981). Hence, if a firm could reach any other firm in the shortest distances, namely, higher closeness centrality, the firm could get knowledge and information in the shortest time (Freeman, 1979). Other things being equal, firms that spend less time to obtain knowledge and information, are likely to have effect on innovation performance than firms who spent more time. Thus, we hypothesize:
H2: There is a positive relationship between a firm’s closeness centrality and its innovation performance.
2.3 Betweenness Centrality and Innovation Performance
Betweenness is an indicator of network centrality based on Freeman’s (1979) measure of betweenness, which captures the extent to which firms sit astride network pathways between other organization. Betweenness centrality indicates a firm’s ability to control information flows within communication network. Hence, a firm controls more information flow, it could gather more important information. Thus, the firm could perform better than others in innovation process. Similarly, Smith-Owen and Powell (2004) proved the effect of betweenness centrality on innovation performance in Boston biotechnology community. Accordingly, we hypothesize that:5
H3: There is a positive relationship between a firm’s betweenness centrality and its innovation performance.
2.4 Coreness and Innovation Performance
The core/periphery models developed by Borgatti and Everett (1999) provide a useful analytical tool that represents the classic idea of a core formed by a group of densely connected actors, in contrast to a more loosely connected class of actors making up the periphery of the system. In other words, a network has a core/periphery structure if the network can be partitioned into two sets: a core whose members are densely tied to each other, and a periphery whose members have more ties to core members than to each other. From this viewpoint, firms in core have more dense communication than firms in periphery and thus transfer more information and knowledge among them. Accordingly, firms in core have better innovation performance than firms in periphery. In this research, we use coreness as an indicator of core/periphery which was developed by Borgatti and Everett (1999). The higher the coreness of a firm, the better the firm’s innovation performance will be. Thus, it can be stated that:
H4: There is a positive relationship between a firm’s coreness and its innovation performance.
2.5 Structural Holes and Innovation Performance
Recent research suggests that a firm’s ego network is likely to be important to innovation such as the extent of connectivity between a firm’s partners (Burt, 1992). The underlying mechanism posited by Burt is that actors in a network rich in structural holes will be able to access novel information from remote parts of the network, and exploit that information to their advantage (Burt, 1992). Moreover, a structural hole indicates that the actor on either side of the hole have access to different flows of information (Hargadon & Sutton, 1997). Many structural holes in ego’s network will increase ego’s access to diverse information and, thus, enhance innovation performance (Ahuja, 2000). According, we hypothesize that:
6
H5: The greater the structural holes bridged by a firm, the greater the firm’s innovation performance.
3. Research Methodology
3.1 Operational definition and Questionnaire Design
Direct Ties In a simple undirected network, directed tie is equal to degree centrality.
According to Freeman (1979), the degree centrality is number of vertices adjacent to a given vertex in a simple undirected network. The formula we use for direct ties is
CD ni = d ni
Where CD ni is a firm’s direct ties and d ni is the total number of links of ni.
Closeness Centrality The closeness centrality of a vertex is based on the total
distance between one vertex and all other vertices, where larger distances yield lower closeness centrality scores. According to Freeman (1979), the closeness centrality is the number of other vertices divided by the sum of all distances between the vertex and all others. The formula we use for closeness centrality is
Cc ni = g − 1 d n
i, nj g
j=1
Where d ni, nj is the number of lines in the geodesic linking actors i and j.
And g is the total number of actors in the whole network.
Betweenness Centrality According to Freeman (1979), the betweenness centrality of
an actor is the proportion of all geodesics between pairs of other actors that include this actor. The formula we use for betweenness centrality is
CB ni =
ni gjk j<𝑘
g − 1 g − 2
7
probability of the communication using any one of these geodesics is 1/gjk. gjk ni
is the number of geodesics of all geodesics from j to k that contain actor i. Hence, the probability of communication from actor j to k that across i is gjk ni /gjk. The actor
betweenness index for ni is simply the sum of these estimated probabilities over all pairs of actors not including the ith actor for i distinct from j and k.
Coreness The core/periphery model consists of two classes of nodes, namely a
cohesive subgraph (the core) in which actors are connected to each other in some maximal sense and a class of actors that are more loosely connected to the cohesive subgraph but lack any maximal cohesion with the core. In this research, coreness (Borgatti & Everett, 1999) which indicate how close an actor to the core. If a firm has higer score of coreness, it is closer to core.
Structural Holes Structural holes are gap in information flows between alters linked
to the same ego but not linked to each other. A structural hole indicates that the people on either side of the hole have access to different flows of information (Hargadon & Sutton, 1997). According to Burt, network constraint effectively measures a firm’s lack of access to structural holes (Burt, 1992). The formula we use for constraint is
pij+ piqpjq, q ≠ i, j
Where pij equals the strength of direct ties from I to j, and piqpjq is the sum of the indirect ties strength from i to j via all q. Finally, we calculated structural holes as one minus the firm’s constraint score.
Innovation Performance According to the work of Abernathy & Utterback (1988),
we use three items of innovation performance to meausre a firm’s innovation performance. And we use 7-point scales, as shown in the following.
Increase the efficiency of our R&D process.
Increase our number of successful new product developments. Shorten to time-to-market for newly developed products.
8
Motivations of Firms to Settle at STSP We are interested in motivations of firms to
settle at STSP and to which degree their motivations have been accomplished. So we choose ten motivation items based on our research intent. The ten items as show as following.
Increase the efficiency of our R&D process. Access qualified and skilled personnel.
Increase our number of successful new product developments. Shorten to time-to-market for newly developed products. Optimize our supply chain management.
Access a broader base of suppliers.
Access specialized and industry-specific know-how. Access financial incentives offered by the STSP Authority. Improve our capacity utilization.
Strengthen relationships with existing partner and establish relationships with potential partners.
3.2 Questionnaire Design
Our questionniare consists of three parts. In the first part, we measure the firm’s motivations to join STSP, as well as the level at which these goals have been achieved so far. For both measures, the respondents indicate their level of agreement on a scale ranging from 1 (strongly disagree) to 7 (strongly agree).
Part two of the questionnaire captures the communication network at STSP. On a list showing all organizations of the optoelectronics industry at STSP informants are asked to indicate what kind of relationship with other firms and institutions they have. There are three types of relationship proposed in the questionnaire: buyer/supplier, competitor, and other. In addition, respondents indicate the communication frequency on a scale from 1 (very low) to 7 (very high).
9
Part three of the questionnaire collects basic data of the firm: company name, numbers of employees, and respondent’s position in the company.
3.3 Network Arrangement
The network under consideration consists of three kinds of communication relationships: buyer/supplier, competitor, and other. Where buy/supplier relationship indicates vertical relationship, competitor relationship indicates horizontal relationship, and other relationship indicates any communication relationship except vertical and horizontal relationship. We use three kinds of communication relationships, because we want to control the effect that different relationships have on the communication network. In addition, the three kinds of actors are differentiated: LCD firms, other firms, and non-firm institutions at STSP. Our research focuses on LCD firms’ communication network, but we also extend network boundary to institutions at STSP, and even to other firms in optoelectronics industry of STSP. This is because we want to examine whether the impact of a firms’ network position variable on its innovation performance changes when network boundaries are extended. Accordingly, we design four kinds of communication networks, based on three kinds of relationships and three groups of actors: the LCD communication network (LCN), LCD communication network with institutions (LCNI), completely collaborative communication network (CCCN), and complete communication network (CCN).
LCN contains only LCD firms and their vertical relationships. This is our main research object. LCNI contains LCD firms and institutions and their vertical and other relationships. CCCN contains all actors and relationships, except horizontal competitor relationship. CCN contains all actors and all relationships at STSP.
Particularly, our statistic tests in four networks all use the same LCD firms as sample.
3.4 Data Collection
Our firm list was obtained from STSP’s official administration. When we check the firm list again, we found that some firms are not suitable for our research. Then, some of the firms were merged with other companies which are not operating at STSP.
10
After clearing non-qualifying firms, our sample included 21 LCD firms, 12 other firms in optoelectronics industry of STSP, and 10 non-firm organizations. All of the companies and institutions were contacted in the first round through personal phone-call and e-mail. The data collection was carried out between January and May 2007.
4. Fingings and Results
4.1 Sample Characteristics
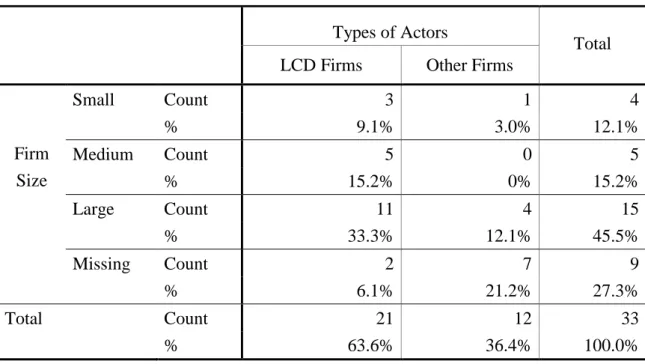
In this section we discuss our sample characteristics. Altogether, 43 firms and institutions were contacted. 27 questionnaires were retrieved, which is a return rate of 63%. However when we consider only LCD firms, which is the core of our research, the return rate increases to 86%. Table 1 presents the firm size of LCD firms and other firms. Obviously, the firm sizes of two kinds of actors are mostly large enterprises.
Table 1 Firm size of LCD firms and other firms
Types of Actors
Total LCD Firms Other Firms
Firm Size Small Count 3 1 4 % 9.1% 3.0% 12.1% Medium Count 5 0 5 % 15.2% 0% 15.2% Large Count 11 4 15 % 33.3% 12.1% 45.5% Missing Count 2 7 9 % 6.1% 21.2% 27.3% Total Count 21 12 33 % 63.6% 36.4% 100.0%
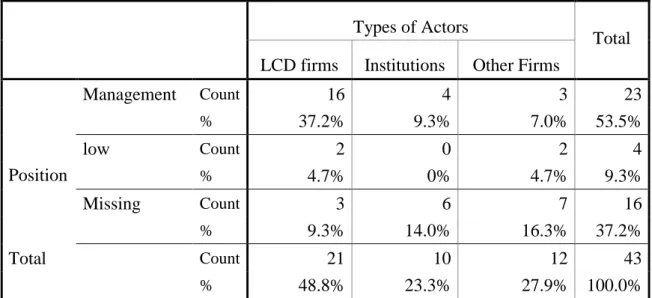
We also analyze our respondents’ position in their companies because the representativeness of respondents often influences the validity of data retrieved. Table 2 shows that almost respondents of firms and institutions are at management level.
11
Table 2 Position of respondents in three kinds of actors
Types of Actors
Total LCD firms Institutions Other Firms
Position Management Count 16 4 3 23 % 37.2% 9.3% 7.0% 53.5% low Count 2 0 2 4 % 4.7% 0% 4.7% 9.3% Missing Count 3 6 7 16 % 9.3% 14.0% 16.3% 37.2% Total Count 21 10 12 43 % 48.8% 23.3% 27.9% 100.0%
4.2 Reliability and Validity
We conducted reliability analysis for three measures of our questionnaire (Table 3). Cronbach’s α of three measures are greater than 0.7 (Guilford, 1954), so the three measures are reliable.
Table 3 Reliability Statistic
Construct Number of items Cronbach’s α
Motivation 10 0.911
Motivation Achievement 10 0.923
Innovation Performance 3 0.775
Innovation performance is our main construct, and measure of it is based on Abernathy and Utterback (1988). From this viewpoint, content validity should be established.
12
4.3 Motivation Analysis
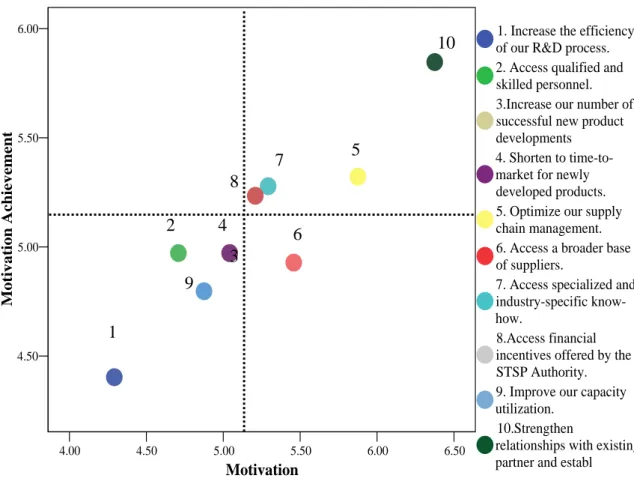
In this section, we want to discuss motivations of LCD firms to enter STSP, and compare their motivations and achievement of motivations. In the first place, let us see Figure 1 which represents the motivations and motivation achievement among all LCD firms.
Figure 1 motivations and motivation achievement among all LCD firms
Before discussing motivations and motivation achievement, we should note that motivations of firms indicate the importance of motivations firms perceived and motivation achievement of firms indicates the performance of firms on motivations.
Because we use 7-scale to measure motivations and motivation achievement, all the ten motivations and motivation achievement are quite high due to greater than 4.
4.00 4.50 5.00 5.50 6.00 6.50 Motivation 4.50 5.00 5.50 6.00 Motiv ation Achiev ement
1. Increase the efficiency of our R&D process. 2. Access qualified and skilled personnel. 3.Increase our number of successful new product developments
4. Shorten to time-to-market for newly developed products. 5. Optimize our supply chain management. 6. Access a broader base of suppliers.
7. Access specialized and industry-specific know-how.
8.Access financial incentives offered by the STSP Authority. 9. Improve our capacity utilization.
10.Strengthen
relationships with existing partner and establ
2 1 5 7 9 6 4 10 3 8
13
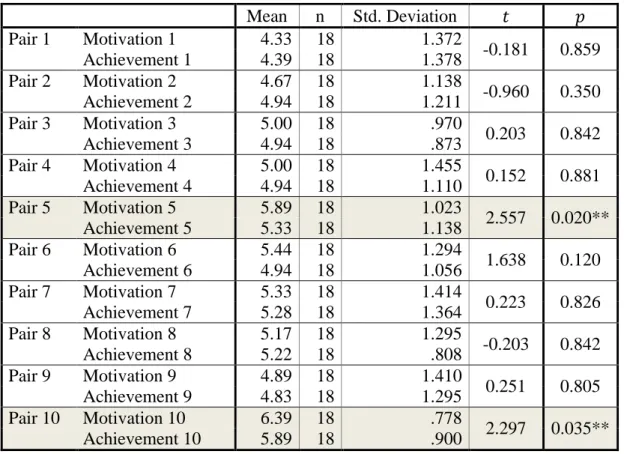
From Figure 1, we could know that motivation: relationship management, optmimizing supply chain, and accessing a broader supply base are the three most important motivations for the LCD firms. In order to understand the relative importance of all of motivations and motivation achievement, the motivational items are grouped into four parts according to their importance and their level of achievement (Figure 1). We conduct a t-test to examine which motivation has significant difference between its importance and performance. From Table 3 we know that achievement of motivation 5 (Optimize our supply chain management) is smaller than expectant level of LCD firms. Besides, the achievement of motivation 10 (Strengthen relationships with existing partner and establish relationships with potential partners) is also smaller than expectant level of LCD firms. In this respect, we can know that motivation 5 and 10 are important for LCD firms, but their actual achievement is significantly smaller than expectant level of LCD firms.
Table 3 A paired sample's t test between motivation and its achievement
Mean n Std. Deviation 𝑡 𝑝 Pair 1 Motivation 1 4.33 18 1.372 -0.181 0.859 Achievement 1 4.39 18 1.378 Pair 2 Motivation 2 4.67 18 1.138 -0.960 0.350 Achievement 2 4.94 18 1.211 Pair 3 Motivation 3 5.00 18 .970 0.203 0.842 Achievement 3 4.94 18 .873 Pair 4 Motivation 4 5.00 18 1.455 0.152 0.881 Achievement 4 4.94 18 1.110 Pair 5 Motivation 5 5.89 18 1.023 2.557 0.020** Achievement 5 5.33 18 1.138 Pair 6 Motivation 6 5.44 18 1.294 1.638 0.120 Achievement 6 4.94 18 1.056 Pair 7 Motivation 7 5.33 18 1.414 0.223 0.826 Achievement 7 5.28 18 1.364 Pair 8 Motivation 8 5.17 18 1.295 -0.203 0.842 Achievement 8 5.22 18 .808 Pair 9 Motivation 9 4.89 18 1.410 0.251 0.805 Achievement 9 4.83 18 1.295 Pair 10 Motivation 10 6.39 18 .778 2.297 0.035** Achievement 10 5.89 18 .900 Note: *p<0.1, **p<0.05, ***p<0.01
14
4.4 Test of Hypotheses
In this section, we want to test the five hypotheses about innovation performance and network position variables. At the first step in our analysis, we present the results of correlation analysis as show as the following Table 4.
Table 4 Means, standard deviations, and correlations
Note: *p<0.1, **p<0.05, ***p<0.01
There are significantly positive correlations among independent variables. This is because our independent variables all are network position variables, although they capture different position concepts. However, high correlations among independent variables could lead to collinearity in multiple regression. In addition, our research focuses on effect of different network position variables on innovation performance separately and seeks to examine which network position variable could explain innovation performance most. Hence, this research will adopt simple linear regression to test our hypotheses.
Direct Ties and Innovation Performance
Refering to H1 (The more direct ties a firm has, the greater the firm’s innovation performance), we expect that there is a significantly positive relationship between direct ties and innovation performance.
The results of the regression (Table 5) indicate that direct ties of four kinds of network have significant positive effect on innovation performance. Hence, the more
Mean S.D Degree Closeness Betweenness
Structural Holes Coreness Innovation Performance Degree 11.44 6.35 Closeness 0.55 0.09 0.975** Betweenness 0.06 0.09 0.917** 0.875** Structural Holes 0.63 0.20 0.718** 0.804** 0.550* Coreness 0.21 0.11 0.937** 0.942** 0.861** 0.671** Innovation Performance 14.28 2.49 0.486* 0.509* 0.487* 0.337 0.621**
15
direct ties a firm maintains, the more information the firm holds. Then because of these information and knowledge from communication among actors, the firm has better innovation performance. Moreover, direct ties of LCNI have better explanation on innovation performance.
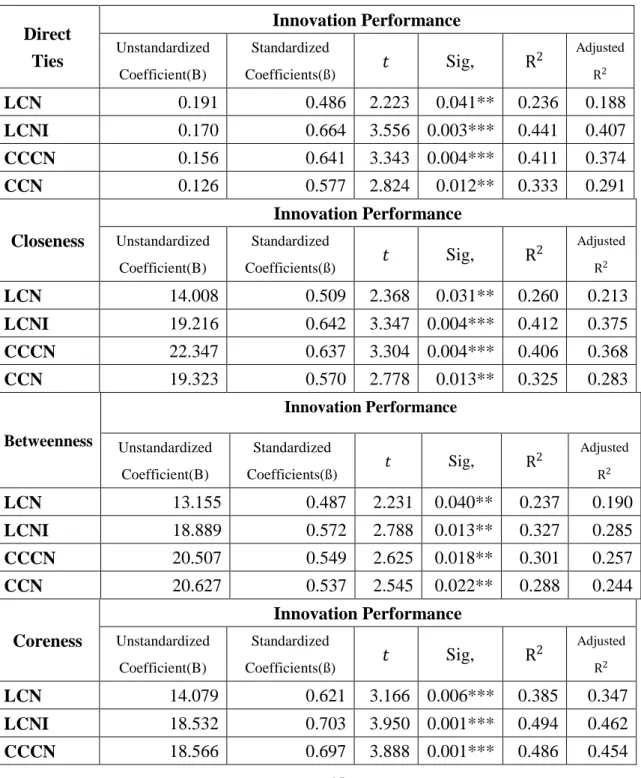
Table 5 Regression analysis between direct ties and innovation performance
Direct Ties Innovation Performance Unstandardized Coefficient(B) Standardized Coefficients(ß) 𝑡 Sig, R 2 Adjusted R2 LCN 0.191 0.486 2.223 0.041** 0.236 0.188 LCNI 0.170 0.664 3.556 0.003*** 0.441 0.407 CCCN 0.156 0.641 3.343 0.004*** 0.411 0.374 CCN 0.126 0.577 2.824 0.012** 0.333 0.291 Closeness Innovation Performance Unstandardized Coefficient(B) Standardized Coefficients(ß) 𝑡 Sig, R 2 Adjusted R2 LCN 14.008 0.509 2.368 0.031** 0.260 0.213 LCNI 19.216 0.642 3.347 0.004*** 0.412 0.375 CCCN 22.347 0.637 3.304 0.004*** 0.406 0.368 CCN 19.323 0.570 2.778 0.013** 0.325 0.283 Betweenness Innovation Performance Unstandardized Coefficient(B) Standardized Coefficients(ß) 𝑡 Sig, R 2 Adjusted R2 LCN 13.155 0.487 2.231 0.040** 0.237 0.190 LCNI 18.889 0.572 2.788 0.013** 0.327 0.285 CCCN 20.507 0.549 2.625 0.018** 0.301 0.257 CCN 20.627 0.537 2.545 0.022** 0.288 0.244 Coreness Innovation Performance Unstandardized Coefficient(B) Standardized Coefficients(ß) 𝑡 Sig, R 2 Adjusted R2 LCN 14.079 0.621 3.166 0.006*** 0.385 0.347 LCNI 18.532 0.703 3.950 0.001*** 0.494 0.462 CCCN 18.566 0.697 3.888 0.001*** 0.486 0.454
16 CCN 16.425 0.631 3.254 0.005*** 0.398 0.361 Structural Holes Innovation Performance Unstandardized Coefficient(B) Standardized Coefficients(ß) 𝑡 Sig, R 2 Adjusted R2 LCN 4.159 0.337 1.432 0.171 0.114 0.058 LCNI 5.531 0.431 1.909 0.074* 0.186 0.135 CCCN 5.294 0.418 1.838 0.085* 0.174 0.123 CCN 5.747 0.441 1.965 0.067* 0.194 0.144 Note: *p<0.1, **p<0.05, ***p<0.01 Note: LCD Communication Network (LCN)
LCD Communication Network with Institutions (LCNI) Completely Collaborative Communication Network (CCCN) Complete Communication Network (CCN)
Closeness Centrality and Innovation Performance
Following H2 (There is a positive relationship between a firm’s closeness centrality and its innovation performance), we expect that there is a significantly positive relationship between closeness centrality and innovation performance.
The results (Table 5) indicate that closeness centrality of four kinds of network have significantly positive effect on innovation performance. Hence, it means that firms could reach other actors in shorter time and they get more information and knowledge faster. Thus they can enhance innovation performance. Moreover, closeness centrality of LCNI has better explanation on innovation performance.
Betweenness centrality and innovation performance
Following H3 (There is a positive relationship between a firm’s betweenness centrality and its innovation performance) we expect that there is a significantly positive relationship between betweenness centrality and innovation performance.
The results (Table 5) indicate that betweenness centrality of four kinds of network have significantly positive effect on innovation performance. Hence, a firm controls more information flow, it could gather more important information. Then, the firm could perform better than others in innovation performance. Moreover, betweenness centrality of LCNI has better explanation on innovation performance.
17
Coreness and Innovation Performance
Refering to H4 (There is a positive relationship between a firm’s coreness and its innovation performance) we expect that there is a significantly positive relationship between coreness and innovation performance.
The results (Table 5) indicate that coreness of four kinds of network have significantly positive effect on innovation performance. Hence, firms in core have better innovation performance than firms in periphery. Moreover, coreness of LCNI has better explanation on innovation performance.
Structural Holes and Innovation Performance
Refering to H5 (The greater the structural holes bridged by a firm, the greater the firm’s innovation performance) we expect that there is a significantly positive relationship between structural holes and innovation performance.
The results (Table 5) indicate that structural holes of three kinds of network have significantly positive effect on innovation performance. Hence, more structural holes in actor’s network will increase actor’s access to diverse information and, thus, have better innovation performance. Moreover, structural holes of CCN have better explanation on innovation performance.
Summary of results
In this part, we present the results of hypotheses testing from this study.
Table 3 Summary of results
Hypotheses Results
H1: The more direct ties a firm has, the greater the firm’s innovation
performance. Supported
H2: There is a positive relationship between a firm’s closeness centrality
and its innovation performance. Supported H3: There is a positive relationship between a firm’s betweenness
centrality and its innovation performance. Supported H4: There is a positive relationship between a firm’s coreness and its
innovation performance. Supported
H5: The greater the structural holes bridged by a firm, the greater the firm’s innovation performance.
Partially Supported
18
Differences among position variables in explaining innovation
performance
From several parts we presented above, we know that almost every network position variable had significantly positive effect on innovation performance. But each position variables’ adjusted R2 on innovation performance are different, namely, each position variables’ goodness of fit for innovation performance are different. In this respect, the five independent variables (direct ties, closeness, betweenness, coreness, and structural holes) all are network position variables in spite of capturing quite different concept toward network position. In the past, many scholars proved that network position had significant effect on firm’s performance or innovation performance (Zaheer & Bell, 2005; Ahuja, 2000; Tsai, 2001). However, they often use different network position variable in different network of relationship. Hence, here we need to examine the effects of different network position variables on innovation performance at the same time.
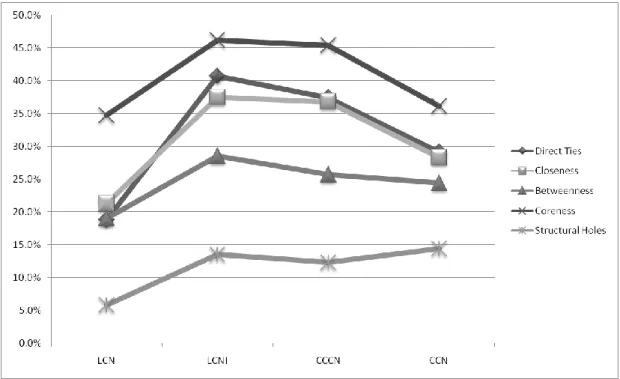
Figure 2 Differences among position variables in explaining innovation performance
We use each adjusted R2 (degree of explanation toward innovation performance) of regression analysis to present the distinction among different position variables and
19
networks in Figure 2. From Figure 2, we can know that coreness’s explanation is the highest in each network. Coreness seems to offer the best explanation in each network. Reversely, structural holes offer least explanation in each network. In addition, all network position variables get the best explanation toward innovation performance in LCD communication network with institutions (LCNI). The explanatory power decreases from CCCN to CCN, except for structural holes. It is likely that direct ties, closeness, betweenness, and coreness are better to be explained toward innovation performance in LCD’s industrial cluster (LCNI). Because in this cluster that contains all firms related LCD and institutions, the cluster is complete from an industrial cluster’s perspective.
5. Discussion and Conclusions
5.1 Findings and Discussion
In this section, we will first discuss our survey findings toward LCD firms’ motivations and their achievement. Then we discuss finding from four networks. Finally, we will begin our discussion by reviewing the empirical findings, and then turn to the general theoretical issues.
As mentioned previously, we found that LCD firms’ main motivation to settle at STSP is to maintain and strengthen relationship with other firms. Results show, however, that this motivation could not be well achieved. This may be explained by the fact that STSP is a young science park and companies may not have settled long enough to harvest the benefits of cluster membership.
Further, it becomes evident that the LCD cluster is a close cluster, and that there are two key players in this network. The ties maintained by these two key players make up almost the whole LCD cluster. In a close network, through frequent social interaction, actors are likely to have share values, share norms and even collective behavior (Nooy, et al., 2005). Moreover, LCD industry is a cluster that places importance on supply chain’s collaboration. Hence, the two key players would play a role of industrial leader to lead LCD firms to achieve a better overall industry performance.
20
In reviewing the results of hypotheses tests following conclusions can be drawn: All in all, network position indeed influences innovation performance from our results of analysis. We expected that a firm with more direct ties will lead him to access more information and knowledge and then get a better innovation performance. This hypothesis was supported. It means that a rich and diverse sources of information facilitate knowledge generation and lead to better innovation performance. Structural holes also prove to have a significant impact on innovation performance in three networks (except LCN). According to Burt (1992), actors in a network rich in structural holes will be able to access novel information from remote parts of the network, and exploit that information to their advantage. But in LCN the actors are quite close, therefore actors interact frequently. It is likely that the closeness of the LCN network makes it less susceptible to structural holes, and thus structural holes do not influence innovation performance at LCN. However, structural holes do have significant impact on innovation performance at LCNI, CCCN, and CCN. According to Burt (1992), it is likely that as other actors are added to original network, the network becomes bigger in terms of the number of exchange relationships. New actors provide even more diverse information and knowledge. In such a new network, actors with structural holes have an easier time exploiting these information and knowledge to their innovation performance than at LCN.
Finally, though numerous scholars proved that network position influences innovation performance (Zaheer & Bell, 2005; Ahuja, 2000; Tsai, 2001), scholars often used different position variablse to explain innovation performance in different industries. Hence, this research wants to identify which network position variable is most suitable for communication and collaboration network of LCD industry which emphasizes collaboration of supply chain in explaining innovation performance. Consequently, we found that coreness offers the best explanation for innovation performance in all four networks. According to Borgatti and Everett (1999), a core formed by a group of densely connected actors, in contrast to a more loosely connected class of actors making up the periphery of the network. From this aspect and our analysis results, it is likely that there are some key firms which dominate over other LCD firms. These key firms interact closely and important information and knowledge are held by them, thus they have better innovation performance. Moreover, other firms closer to them, the better innovation performance they have. In other words, the
21
important information and knowledge often held by firms who are core in LCD industry. Hence, we conclude that when key firms in a network hold critical information, knowledge, or know-how, it is suitable to use coreness to explain innovation performance.
5.2 Implications
From our research results, we know that a firm’s network position influences its innovation performance. Different network position variables capture different kinds of position concepts. In our study, we identify the most interpretable position variable for the LCD industry, namely, coreness. It is suitable to be use in any industry which has a structure of core/periphery.
Moreover, in a stepwise enlargement of the original network we examine the change of the impact of network indicators on innovation performance. Under this aspect, the impact of structural holes turn out to be on a significant level.
As we mentioned before, network position influences innovation performance. However, from our survey of LCD firms’ motivations and their achievement, we find that LCD firms’ main motivation to settle at STSP is to maintain and strengthen relationships with other firms. At the same time, this goal seems to disappoint most LCD firms. Furthermore, network position is determined by interfirm relationships. In other words, if the STSP’s official administration can help enhance LCD firms’ achievement of relationship-related motivations, LCD firms could be placed in a better network position and thus achieve better innovation performance. Accordingly, STSP’s official administration must make efforts in enhancing and improving relationships among LCD firms.
Results also show that coreness significantly influences innovation performance. Hence, LCD firms should try to communicate or collaborate with firms which are at the core of the network. If so, firms could access more information and knowledge which, in turn, improve their innovation performance.
22
5.3 Limitations and Future Directions
This study has several limitations. First, in social network studies, relationships are usually specific to a particular domain. In this research, we only focus on communication relationship with collaboration, competition, and institutions. Maybe other types of relationships also have an influence on innovation performance.
Second, though samples of LCN are enough (86%), return rate of other firms in optoelectronics industry is quite low (38%). It could result in some research bias.
Third, innovation performance was assessed by the respondents using their subjective opinions. Although only executives from the R&D department or general management were asked, the subjective nature of the answer is problematic.
Future research should extend network scope. For example, future research could survey optoelectronics industry of different science park, industry, and even nation to examine the effect on several subnetworks. Besides, future research should discuss actor’s attributes (e.g. innovativeness) and network features at the same time, to better understand the interaction between actor’s attributes and network features.
Reference
Abernathy, J. W., & Utterback, M. J. (1988). Patterns of industrial innovation, Readings
in the management of innovation (2 ed.). (L. M. Tushman, & L. W. Moore, Eds.)
Cambridge, MA: Ballinger/ Harper & Row.
Ahuja, G. (2000). Collabotation networks, structural holes, and inovation: A longitudinal study. Administrative Science Quarterly , 45, pp. 425-455.
Arora, A., & Gambardella, A. (1990). Complementarity and external linkages: The strategies of large firms in biotechnology. Journal of Industrial Economics , 38, pp. 361-379.
Barney, B. J. (2001). Resource-based theories of competitive advantage: a ten-year retrospective on the resource-based view. Journal of Management , 27 (6), pp. 643-650.
Berg, S., Duncan, J., & Friedman, P. (1982). Joint Venture Strategies and Corporate
23
Borgatti, P. S., & Everett, G. M. (1999). Models of core/periphery structures. Social
Network , 21, pp. 375-395.
Borgatti, P. S., Everett, G. M., & Freeman, C. L. (2002). Ucinet for Windows: Software for Social Network Analysis. Harvard, MA: Analytic Technologies.
Burt, R. S. (1992). Structural Holes: The Social Structure of Competition. Cambridge, MA: Harvard University Press.
Burt, S. R. (1987). Social contagion and innovation: Cohesion versus structural equivalence. American Journal of Sociology , 92, pp. 1287-335.
Chen, C.-J., & Chang, L.-S. (2004). Dynamics of business network embeddedness.
Journal of American Academy of Bussiness , 5, pp. 31-61.
Das, K. T., & Teng, S. B. (2000). A resource-based theory of strategic alliances. Journal
of Management , 26, pp. 31-61.
David, F. G., & Mizuhi, S. M. (1999). The money center cannot hold: Commercial banks in the US system of governance. Administrative Science Quarterly , 44, pp. 215-39.
Davis, F. G. (1991). Agents without principles? The spread of the poison pill through the inrercorporate network. Administrative Science Quarterly , 36, pp. 583-613. Drejer, I., Kristensen, F. S., & Laursen, K. (1999). Cluster studies as a basis for
industrial policy: The case of Denmark. Industry and Innovation , 6, pp. 171-190. Freeman, L. C. (1979, 215-239). Centrality in Social Networks: Conceptual clarification.
Social Networks , 1.
Guilford, P. J. (1954). Psychometric Methods (2 ed.). New York: McGraw-Hill.
Gnyawali, R. D., & Madhavan, R. (2001). Cooperative networks and competitive dynamics: a structural embeddedness perspective. Academy of Management
Review , 26 (3), pp. 431-445.
Gulati, R. (1995). Social structure and alliance formation patterns: A longitudinal analysis. Administrative Science Quarterly , 40, pp. 619-652.
Gulati, R., & Garguilo, M. (1999). Where do networks come from? American Journal of
Sociology , 104, pp. 1439-1493.
Hakansson, H., & Ford, D. (2002). How should companies interact in business networks?
Journal of Business Research , 55, pp. 133-139.
Hargadon, A., & Sutton, I. R. (1997). Technology brokering and innovation in a product development firm. Administrative Science Quarterly , 38, pp. 716-749.
24
corporate acquisition activity. Administrative Science Quarterly , 38, pp. 909-938. Johnston, J. W., Lewin, E. J., & Spekman, E. R. (1999). International Industrial
Marketing Interactions: Dyadic and Network Perspectives. Journal of Business
Research , 46, pp. 259-271.
Kogut, K. (1988). A Study of the Life Cycle of Joint Ventures. Management
International Review , Special Issue, pp. 39-52.
Krackhardt, D. (1999). The ties that torture: Simmelian tie analysis in organizations.
Research in the Sociology of Organizations , 16, pp. 183-210.
Krackhardt, D., & Kilduff, M. (1999). Whether close or far: Social distance effects on perceived balance in friendship networks. Journal of Personality and Social
Psychology , 76, pp. 770-82.
Lorrain, F., & White, C. H. (1971). Structural equivalence of individuals in social networks. Journal of Mathematical Sociology , 1, pp. 49-80.
Madhok, A. (1997). Cost, value and foreign market entry mode: The transaction and the firm. Strategic Management Journal , 18, pp. 39-61.
McEvily, B., & Marcus, A. (2005). Embedded ties and the acquisition of competitive capabilities. Strategic Management Journal .
McEvily, B., & Zaheer, A. (1999). Bridging ties: a source of firm heterogeneity in competitive capabilities. Strategic Management Journal , 20, pp. 1133-1156. McLoughlin, D., & Horan, C. (2002). Markets-as-networks: notes on a unique
understanding. Journal of Business Research , 55, pp. 535-543.
Mehra, A., Kiduff, M., & Brass, J. D. (2001). The social networks of high and low self-monotors: Implications for workplace performance. Administrative Science
Quarterly , 35, pp. 121-46.
Mizruchi, S. M. (1989). Similarity of political behavior among large American corporations. American Journal of Sociology , 95, pp. 401-424.
Nohria, N., & Garcia-Pont, C. (1991). Global strategic linkages and industry structure.
Strategic Management Journal , 12, pp. 105-124.
Nooy, W. D., Mrvar, A., & Batagelj, V. (2005). Exploratory Social Network Analysis
with Pajek. New York: Cambridge University Press.
Peteraf, A. M. (1993). The cornerstones of comptitive advantage: a resource-based view.
Strategic Management Journal , 14 (3), pp. 179-191.
Pfeffer, J., & Salancik, R. G. (1978). The External Control of Organizations: A
25
Porter, M. (1998). Clusters and the new economics of competition. Harvard Business
Review .
Porter, M. (1990). The competitive advantage of nations. New York: The Free Press. Powell, W. W., Koput, W. K., & Smith-Doerr, L. (1996). Interorganizational
collaboration and the locus of innovation: Networks of learning in biotechnology.
Administrative Science Quarterly , 41, pp. 116-145.
Provan, G. K., & Sebastian, G. J. (1998). Networks within networks: Service link overlap, organizational cliques, and network effectiveness. Academy of
Management Journal , 41, pp. 453-63.
Rogers, M. E., & Kincaid, L. D. (1981). Communication Networks: Toward a New
Paradigm for Research. New York: Free Press.
Rowley, T., Behrens, D., & Krackhardt, D. (2000). Redundant governance structures: An analysis of structural and relational embeddedness in the steel and semiconductor industries. Strategic Management Journal , 21, pp. 369-386.
Shan, W., Walker, G., & Kogut, B. (1994). Interfirm coorperation and startup innovation in the biotechnology industry. Strategic Management Journal , 15, pp. 387-394. Smith-Owen, J., & Powell, W. W. (2004). Knowledge networks as channels and
conduits: The effects of spillovers in the Boston biotechnology community.
Organization Science , 15, pp. 5-21.
Strang, D., & Tuma, B. N. (1993). Spatial and temporal heterogeneity in diffusion.
American Sociological Review , pp. 614-39.
Tsai, W. (2001). Knowledge transfer in intraorganizational networks: effects of network position and absorptive capacity on business unit innovation and performance.
Academy of Management Journal , 44 (5), pp. 996-1004.
Williamson, E. O. (1985). The economic institutions of capitalism. New York: Free Press.
Zaheer, A., & Bell, G. G. (2005). Benefiting from network position: Firm capabilities, structural holes, and performance. Strategic Management Journal , 26, pp. 809-825.