Crustal Flow Pattern beneath the Tibetan Plateau
1Constrained by Regional Lg-Wave Q Tomography
23
Lian-Feng Zhao a, Xiao-Bi Xie b, Jian-Kun He c, Xiaobo Tian a, and Zhen-Xing Yao a 4
5
Running title:
6
Crustal flow beneath the Tibetan Plateau
78 a
Key Laboratory of the Earth's Deep Interior, Institute of Geology and Geophysics,
9
Chinese Academy of Sciences, Beijing,
China. (
[email protected]
).
10 b
Institute of Geophysics and Planetary Physics, University of California at
Santa
11
Cruz, California, USA. (
[email protected]
).
12 c
Key Laboratory of Continental Collision and Plateau Uplift, Institute of Tibetan
13
Plateau Research, Chinese Academy of Sciences, Beijing, China.
14
(
[email protected]
).
15 16 17Submitted to EPSL
18(April 30, 2013)
19 20Corresponding Author:
21 22Lian-Feng Zhao
23 24Key Laboratory of the Earth's Deep Interior
25
Institute of Geology and Geophysics, Chinese Academy of Sciences
26
19 Beituchengxilu, Chaoyang District
27
Beijing, China
28100029
29Tel. 011-86-10-82998658
30Fax 011-86-10-62010846
31[email protected]
32 33 *ManuscriptAbstract 34
As a prominent geophysical anomaly, unusually high seismic wave attenuation is
35
observed in the crust and upper mantle of the Tibetan Plateau, particularly along its northern
36
area. Theoretical and laboratory investigations show that the strong seismic attenuation can
37
indicate high temperatures and partial melting, which may decrease the viscosity of the
38
material and cause it to flow. Thus, seismic attenuation distribution may provide useful
39
constraints to the crust flows if they exist. Using Lg-wave Q tomography, we construct a
40
broadband high-resolution crust attenuation model for the Tibetan Plateau and its surrounding
41
regions. The maximum spatial resolution is approximately 1.01.0 in well-covered areas
42
and for frequencies between 0.05 and 1.5 Hz. Our broadband QLg model reveals there is an 43
apparent low-QLg belt stretching along the northern and eastern Tibetan plateau. Combining 44
the Lg-wave Q model with other geophysical data, two possible crust flow channels are found
45
in the Tibetan Plateau. The main flow channel is from north to east and then turns to
46
southeastern Tibet along the western edge of the rigid Sichuan basin, while a second channel
47
starts from southern Tibet and crosses the Eastern Himalayan syntaxis.
48 49
Keywords 50
Lg attenuation; Q tomography; Lower-Crustal flow; Tibetan Plateau; Crustal deformation.
51
52 53 54 55
1. Introduction 57
A lower-crust flow model can explain many geological and geophysical observations in
58
the Tibetan Plateau. Moreover, these observations provide important constraints to the
59
dynamic processes in this region (Klemperer, 2006; Royden et al., 2008; Searle et al., 2011).
60
Typically, the surface strain rates from the Global Positioning System (GPS) and earthquake
61
data are consistent with a gravitationally driven flow model of a viscous lithosphere bounded
62
by strong converging blocks in northern and southern Tibet (e.g., Clark and Royden, 2000;
63
Flesch et al., 2001; Heidbach et al., 2010; Zhang et al., 2004). The low Pn velocities,
64
inefficient Sn propagation, high Poisson’s ratios of approximately 0.35, and high seismic
65
Lg-wave attenuation are observed in northern Tibet, suggesting that partial melting is existed
66
within this region’s crust (Fan and Lay, 2003b; Nelson et al., 1996; Owens and Zandt, 1997;
67
Rodgers and Schwartz, 1998). The seismic and magnetotelluric observations revealed that, in
68
eastern and southeastern Tibetan plateau, there are low-velocity and high-conductivity layers
69
in the middle- and lower-crusts, which support a lower-crust flow model (e.g., Bai et al., 2010;
70
Liu et al., 2006; Unsworth et al., 2005; Xu et al., 2007; Yao et al., 2008). However, whether
71
the crust flow is widely spread throughout the entire Tibetan Plateau or is limited to certain
72
narrow geological channels is still under debate. To explore the lower-crust flow pattern
73
throughout the Tibetan Plateau, high-resolution regional measurements of the crust physical
74
properties, such as the velocity, attenuation, anisotropy and electrical structures, are required
75
(e.g., Fan and Lay, 2002; Li et al., 2008; Shapiro et al., 2004; Wang et al., 2013).
76
Seismic attenuation is usually an indicator of high temperatures and partial melts. An
77
unusually high attenuation in both the crust and upper mantle is one of the first geophysical
anomalies discovered in Tibet, particularly in its northern region. The strong Pnl- and
79
Lg-wave attenuations are consistent with the strong Sn-wave attenuation in this region (Fan
80
and Lay, 2003b; Ni and Barazangi, 1983; Rodgers and Schwartz, 1998). Both Rodgers and
81
Schwartz (1998) and Fan and Lay (2003b) suggested that the strong attenuation results from
82
widespread partial melting in the northern Tibetan crust. Xie et al. (2004) found strong crustal
83
Lg-wave attenuation in the Yangbajing graben in southern Tibet and attributed the attenuation
84
to hydrothermal and magmatic fluid activities in the upper-crust. Based on deep seismic
85
sounding data from eastern Tibet, Wang et al. (2007) compared the amplitude difference of
86
seismic PmP waveforms between the observed and synthetic data. They suggested that the
87
weak PmP amplitudes resulted from a high attenuation in the lower crust and hence suggested
88
that a lower-crust flow is likely existed in this region. In the Tibetan Plateau, previous
89
attenuation studies are mostly limited within local regions or to very low resolutions because
90
of limited data (Bao et al., 2011; Fan and Lay, 2002, 2003a, b; McNamara et al., 1994;
91
Rodgers and Schwartz, 1998; Xie, 2002; Xie et al., 2004; Zhou et al., 2011). Until recently,
92
due to the lack of a high-resolution attenuation model for the Tibetan Plateau, it has been
93
difficult to link the attenuation information with the regional tectonics.
94
In this study, we develop a high-resolution Lg-wave attenuation model in the Tibetan
95
Plateau and its adjacent regions and investigate its connections to the thermal activities and
96
possible material movement in the lower crust and upper mantle.
97
98
2. Data and Methods 99
We collected 7545 broadband vertical-component digital seismograms recorded at 146
stations from 232 regional earthquakes between January 2001 and June 2008 with their ray
101
paths penetrating the plateau. The waveforms were obtained from the China Earthquake
102
Networks Center (CENC) and the Incorporated Research Institutions for Seismology (IRIS)
103
consortium. The station parameters, including code, location, data resource, and affiliation,
104
are listed in Tables S1 and S2 in the supplementary document. Both the CENC and the IRIS
105
stations are equipped with broadband instruments having nearly flat velocity responses from
106
0.03 Hz to 8.0 Hz and one of the three sampling rates: 20, 40 and 50 points per second. The
107
earthquake parameters are listed in Table S3 in the supplementary document. Shown in Fig. 1
108
is a topographic map overlapped with the main fault systems (light-blue lines), geotectonics
109
(white lines), locations of the CENC (solid squares) and IRIS (triangles) stations, and
110
epicenters of the earthquakes (crosses) used in this study. The waveforms were selected based
111
on the criteria that these earthquakes were located in the crust, their magnitudes ranged
112
between mb = 3.5 and 6.0, and the epicenter distances were between 200 and 3000 km. 113
The data pre-processing was conducted following Zhao et al. (2010, 2013). We extracted
114
the Lg-waveforms using a group-velocity window of 3.6-3.0 km/s and collected the noise
115
time series in an equal-length window as the Lg phase before the first-arriving P wave. Then,
116
we calculated Fourier spectra for both the Lg-wave and the noise, sampled the spectral
117
amplitudes, and corrected for the noise effects. Our Lg-wave spectra calculation is illustrated
118
in Fig. 2. In Fig. 2a, the solid and dashed lines denote the amplitude spectra of Lg and pre-P
119
noise, where the circles and triangles denote the samples at 58 frequencies distributed log
120
evenly between 0.05 and 10.0 Hz. From the signal and noise spectral amplitudes, we
121
calculated the signal-to-noise ratios at individual frequencies (shown in Fig. 2b as solid
circles). A threshold of 2.0 is shown as a dashed line and was used for rejecting the low
123
quality data. The noise-corrected Lg-wave spectrum is illustrated in Fig. 2c, where points
124
below the threshold are dropped. After batch processing all regional waveforms, we obtained
125
the source-station amplitudes at individual frequencies between 0.05 and 10.0 Hz. Following
126
Xie et al. (2004) and Zhao et al. (2013), we extracted the dual-station data for individual
127
frequencies from the source-station data. Both dual- and single-station data were used in the
128
joint inversion for the Lg Q distribution and Lg-wave source functions (for details see Zhao et
129
al., 2013). Using a checkerboard method (e.g., Zhao et al., 2013) with variable grid sizes from
130
0.8°×0.8° to 2°×2°, we conducted resolution analyses for all 58 individual frequencies. Fig.
131
2d summarizes the quantities of available rays (for dual-station, single-station, and combined
132
data sets) versus frequency, where the shaded areas illustrate the estimated resolutions for
133
particular frequencies.
134
135
3. Tomographic Model of Lg Attenuation 136
Based on the above mentioned Lg dataset, we obtained a broadband attenuation model for
137
the Tibetan Plateau and its surrounding regions, where QLg is distributed geographically as 138
well as at 58 discrete frequencies between 0.05 and 10.0 Hz.
139
3.1 QLg maps at Individual Frequencies 140
Figs. 3a-c illustrate the QLg distributions at 0.5, 1.0, and 2.0 Hz, respectively, along with 141
the major geological sutures (white lines) and active fault systems (thin black lines). Note that
142
different color scales are used for these QLg images. The most prominent feature in these maps 143
is that the high-frequency QLg is generally higher than the lower-frequency values. The lateral 144
QLg variations are consistent with regional tectonics. Compared to its surrounding areas, the 145
Tibetan Plateau is characterized by strong Lg wave attenuations, with low-QLg zones seen in 146
the Songpan-Ganzi-Hoh xil (ST), Qiangtang (QT), and Lhasa Terrane (LT) regions, forming a
147
belt first from west to east then turn to south. Shown in Fig. 3d are some 1 Hz QLg 148
measurements from previous investigators (Fan and Lay, 2002, 2003a, b; Rai et al., 2009; Xie,
149
2002; Xie et al., 2004; Zhao et al., 2013). Comparison between Fig. 3b and 3d demonstrates
150
that our result is consistent with the previous measurements but with higher resolution and
151
better coverage. Shown in Figs. 3e and 3f are the ray-path coverage and the checkerboard
152
resolution analyses at 1 Hz. In well-covered areas, the spatial resolution can reach to 1º×1º or
153
higher.
154
There are strong QLg variations between different geology formations as well as within 155
each unit. We investigated the Lg attenuation in different geological formations by calculating
156
their average values (Zhao et al., 2010, 2013). The geographically averaged QLg values versus 157
frequency in selected tectonic regions are shown in Fig. 4. As an example, the light gray
158
crosses in Fig. 4a are the inverted QLg values within the Songpan-Ganzi-Hoh xil terrane (ST). 159
The result reveals the QLg-frequency relationship but with large scatters. We calculated the 160
mean QLg values within narrow frequency bands, and the results are shown as squares with 161
error bars. These statistical results are more robust in characterizing the regional variations
162
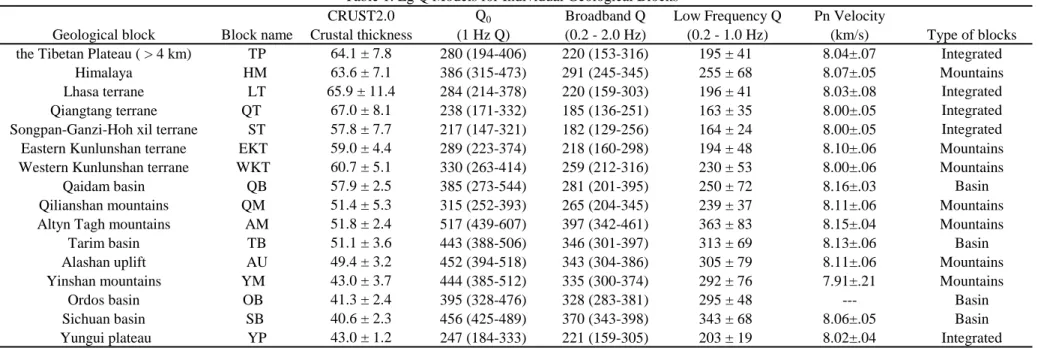
and frequency dependence of QLg. Also labeled in Fig. 4a are the average Q0 and its standard 163
deviations. Fig. 4b summarizes the average QLg versus frequency relations for selected 164
geological blocks, and these results are also listed in Table 1. The average QLg values between 165
0.2 and 2.0 Hz (shaded area in Fig. 4b) show larger regional variations, thus suitable for
characterizing the regional attenuation variations. The part of Tibetan Plateau with elevations
167
above 4,000 m have an average Q0 of 280 (194 – 406), much lower than the values of 374 168
(273-512) and 414 (232- 739) from North China Craton (NCC) and Northeast China (NEC)
169
(Zhao et al., 2010, 2013). The regions surrounding the Tibetan plateau are mostly
170
characterized by high Q0 values (Tarim basin: 433, Altyn Tagh mountain: 517, Qaidam basin: 171
385, Alashan uplift: 452, Yinshan mountains: 444, Ordos: 395, and Sichuan basins: 456)
172
except for Yungui Plateau, which has a relatively low Q0 of 247. 173
174
3.2 Broadband QLg images 175
To explore the relationship between the broadband QLg and the regional geology, we use 176
cross-sections to show the frequency dependence of the attenuation. Shown in Fig. 5 are six
177
east-west cross-sections located at selected latitudes from north to south. The left column
178
compares the QLg (0.2-2.0 Hz) (average QLg between 0.2 and 2.0 Hz), surface topography, and 179
Moho depths from CRUST2.0 (Bassin et al., 2000). Illustrated in the right column are QLg 180
versus frequency along these sections. For these cross sections, their latitudes are labeled in
181
the left column, and the longitudes are indicated along the top and bottom. Also labeled in
182
these sections are names of major geology blocks and the locations the lowest QLg appears 183
(with arrows). Located in the northernmost portion of the Tibetan Plateau, the section along
184
the 37.5N latitude passes sequentially through the Tarim basin (TB), Eastern Kunlunshan
185
terrane (EKT), Qaidam basin (QB), Qilianshan mountains (QM), and Ordos basin (OB). As
186
shown in Fig. 5a, there are two apparent low-Q regions, EKT and QM, corresponding to
187
mountain areas, while the three stable basins have relatively higher QLg values (as can be seen 188
from Fig. 3). The 35N latitude section crosses the Qiangtang (QT), Songpan-Ganzi-Hoh xil
189
(ST), and Eastern Kunlunshan terranes (EKT). Located in the North Tibetan Plateau, the crust
190
in this region was suggested by Owens and Zandt (1997) to be partially melted due to high
191
temperatures, thus having relatively low QLg. In Figs. 5c and 5d, low-QLg anomalies occur 192
near 89E and 95E, which agrees with the findings by Fan and Lay (2002, 2003a, b). The
193
32.5N latitude section traverses the Qiangtang (QT) and Songpan-Ganzi-Hoh xil terranes
194
(ST) and enters into the Sichuan basins (SB). Relatively low-QLg values are observed in 195
eastern Tibet as shown by arrows in Fig. 5e. Located in the south Tibetan Plateau, section
196
along the 30N latitude sequentially passes through the Himalaya (HM), Lhasa (LT),
197
Qiangtang (QT), and Songpan-Ganzi-Hoh xil terranes (ST) and the Sichuan basins (SB). In
198
Figs. 5g and 5h, sections along 27.5N latitude show apparently strong attenuation regions
199
between 90 and 95E in southern Tibet and near 100E in southeast Tibet. Geophysical
200
anomalies such as middle-crustal low-velocity, low-QLg, high-heat flows and crustal electrical 201
conductivities have been observed in southern Tibet (e.g., Langille et al., 2010; Wei et al.,
202
2001; Xie et al., 2004; Zhang et al., 2011). The partial melting, resulting from collisional
203
crustal thickening, is thought to be responsible for these geological anomalies (e.g., Beaumont
204
et al., 2004; Nelson et al., 1996). The southeastern Tibet is also characterized by strong
205
attenuation in the crust, as shown in Figs. 5g-l. It is commonly accepted that this region is an
206
exit of the lower crust channel flow in eastern Tibet (e.g., Clark and Royden, 2000; Royden et
207
al., 2008; Wang et al., 2013; Zhang et al., 2010).
208
209
4. The Possible Crustal Flow Pattern Constrained by Lg Attenuation 210
The partially molten layer in the middle or lower crust is generated by the continental
211
crust thickening and behaves like a fluid over the formation time scale of the Tibetan Plateau
212
(e.g., Nelson et al., 1996). It is expected that the crustal flow is characterized by low viscosity,
213
high temperature and partial melting. Several high-attenuation regions are observed in the
214
crust and upper mantle in the Tibetan Plateau. Theoretical models and laboratory
215
measurements show that strong seismic attenuation is usually an indicator of high
216
temperatures and partial melts. Therefore, we try to use regional Lg-wave attenuation
217
distributions to constrain the possible Tibetan Plateau crustal flow pattern. Illustrated in Fig.
218
6a is a map of QLg (0.2 – 2.0 Hz), along with the main fault systems (light-blue lines) and 219
geo-tectonics (white lines). Red contours in Fig. 6a delimit the heavily attenuated regions
220
withQLg
0.2 2.0 Hz
200. A low-QLg belt is distributed along the northern and eastern 221borders of the Tibetan Plateau. Based on this pattern, the main flow channel appears starting
222
from the north and moves eastward. Then, the channel turns toward southeastern Tibet,
223
moving along the western edge of the rigid Sichuan basin. After passing the narrow channel,
224
it spreads to a wide front. In addition to the main flow channel, there may be another channel,
225
which starts from southern Tibet, crosses the Eastern Himalayan syntaxis, and merges with
226
the main channel.
227
Shown in Fig. 6b is the Pn velocity in the Tibetan Plateau and surrounding areas (Liang
228
and Song, 2006). Comparing Figs. 6a and 6b, the Lg wave attenuation and Pn velocity are
229
generally correlated, with high attenuations being related to low Pn velocities. Normally, the
230
QLg reflects the material properties in the crust, while the Pn velocity is related to the 231
properties in the uppermost mantle. Investigating the distributions of both QLg and the Pn 232
velocity anomalies can provide information on the depth dependence of subsurface processes.
233
For the main flow channel, both strong Lg-wave attenuation and low Pn-velocity anomalies
234
are observed, suggesting it happened at greater depth. However, for the second flow channel,
235
although there are strong Lg-wave attenuations, no Pn-velocity anomaly is observed,
236
suggesting it occurred at a much shallower depth. These findings are consistent with the
237
previous observations (Beaumont et al., 2004; Clark and Royden, 2000; Fan and Lay, 2003a;
238
Nelson et al., 1996; Owens and Zandt, 1997; Royden et al., 2008; Xie et al., 2004).
239
Based on the geophysical evidence, Klemperer (2006) suggested the active flow patterns
240
shown in Fig. 6, where black open arrows indicate the middle- or lower-crust flow directions,
241
while the black open circles mark the regions with no flow. The north-south compression and
242
east-west extension of Tibet drive an eastward flow beneath the Qiangtang and
243
Songpan-Ganzi-Hoh xil terranes. This flow bifurcates north and south of the rigid Sichuan
244
basin. The gravitational potential energy and orographic exhumation drive a southward flow
245
between the subducting Indian lower lithosphere and the brittle upper crusts of the Himalaya
246
and southern Lhasa terrane. Bai et al. (2010) produced magnetotelluric images showing two
247
major zones or channels of high electrical conductivity located at depths 20-40 km and
248
extended horizontally for more than 800 km from the Tibetan Plateau to the Yungui Plateau.
249
Using blue arrows, we superimpose their flow model on both the QLg and the Pn velocity 250
maps in Fig. 6. The first high conductivity channel is roughly consistent with the regions
251
having both strong attenuation and low Pn-velocity anomalies. Comparing crustal flow
252
patterns proposed by Bai et al. (2010) based on their magnetotelluric data (blue arrows in Fig.
253
6) with the flow channels constrained by our QLg data, both of them share a similar flow trend 254
although their locations are not exactly correlated. In their magnetotelluric observations
255
crossing the eastward low-QLg branch, Bai et al. (2010) did not find any high conductivity 256
layer. However, their magnetotelluric observation did find a flow channel, which stretching
257
from southern to southeastern Tibet, moving clockwise around the eastern Himalayan. This
258
flow channel is consistent with the regional structural trend (e.g., Molnar and Lyoncaen, 1989)
259
and roughly correlates to our second flow channel.
260
261
5. Discussion 262
The QLg variation can result from the physical properties and thermal status of the crust, 263
or be affected by the geometrical parameters of the crustal waveguide such as the change of
264
the crust thickness (Zhang and Lay, 1995). Zhao et al. (2010, 2013) investigated the
265
relationship between the low-frequency QLg and the crust thickness in Northeast China and 266
North China Craton, and found a tendency that the QLg is usually high for regions with thicker 267
crust. However, the Tibetan plateau is characterized by unusually thick crust and very low QLg 268
making it unique and should not be fit into a conventional crust model. The circles in Fig. 7
269
illustrate the QLg (0.2 – 1.0 Hz) versus the crust thickness for geo-blocks in the Tibetan 270
Plateau and its vicinity. These low-frequency QLg values are averaged for individual geology 271
units and over the frequency band between 0.2 and 1.0 Hz. The average crust thickness data
272
are calculated from the 22 global crust model CRUST2.0 (Bassin et al., 2000). To compare
273
the Tibetan data with those from other regions (Zhao et al., 2010, 2013), we include the QLg 274
(0.2 – 1.0 Hz) from the Northeast China (triangles) and North China Craton (squares) into this
275
figure. Both NEC and NCC data are averaged values from large regions rather than from
small geology units, thus are relatively stable and representative. The NEC and NCC data are
277
mostly located at the upper-left in the figure, having relatively thin crust and high QLg values 278
and forming a rough relationship with high QLg values correlate to thicker crust (as shown by 279
a dashed line). On the contrary, the data from the major part of the Tibetan Plateau (circled by
280
the dashed line) are characterized by very thick crust of 57 to 67 km and low QLg(0.2 – 1.0 Hz) 281
from 163 to 254. The group of data circled by the dotted line comes from stable basins and
282
rigid mountain areas surrounding the Tibetan Plateau (refer to Fig. 1). They have average
283
crust thicknesses between 40 and 52 km and QLg(0.2 – 1.0 Hz) from 292 to 363. The shaded 284
symbols mark the centroids of different data groups, where triangle and square are averages
285
for the entire NEC and entire NCC, and the two shaded circles are for the part of Tibet with
286
elevations large than 4000 m and the average from stable regions surrounding the plateau.
287
Fig. 7 suggests that the dominant mechanisms of the Lg wave attenuation in the major
288
Tibetan Plateau differ from those in other regions. Possibly, the strong thermal activities and
289
heterogeneities from partially melted magma chambers make both intrinsic and scattering
290
attenuations very effective. At the same time, bumpy topography, weaker Moho discontinuity
291
and possibly the double-layered thick crust are all unfavorable for the propagation of Lg as a
292
guided wave. The data from stable regions surrounding the plateau have thicker crust and
293
slightly lower QLg compared to the NEC and NCC data. However, their crust thickness and 294
QLg are still different from those in the major Tibetan Plateau. There are two exceptional 295
blocks, the YP and QM, which cannot be assigned to either group. Compared to other regions
296
surrounding the major Tibetan Plateau, the YP and QM have similar crust thickness but their
297
QLg are about 100 lower. What causes this is still not fully understand but the YP and QM are 298
two weakest areas surrounding the major Tibetan Plateau. Due to the combined effect of the
299
subducting India Plate and strong holding of the Eurasia Plate at TB, QB, OB and SB, the
300
crust and upper mantle material in Tibetan Plateau could be streamed out in between these
301
rigid basins. It has been suggested by previous authors that the YP and QM are two possible
302
paths of material out flow (e.g., Wang et al., 2013; Zhang et al., 2011). It is possible that the
303
crusts in these narrow paths underwent strong shear movement and are highly heterogeneous,
304
which causes additional attenuation.
305
Fig. 8 summarizes the geology and attenuation in a north-south profile along longitude
306
93E. Shown in Figs. 8a and 8b are cartoons depicting the surface topography with geological
307
sutures as well as the crust and upper mantle structures adapted from Jin et al. (1996), Owens
308
and Zandt (1997), Kosarev et al. (1999), Kind et al. (2002), and DeCelles et al. (2002). The
309
broadband QLg versus frequency are shown in Fig. 8c (note the vertical coordinate is the 310
frequency). Overlapped on the generally smoothed background attenuation, there are three
311
absorbing bands labeled with ①-③. If scattering dominates the Lg wave attenuation, the
312
maximum absorbing happens at
ka
1
, wherek
is the wavenumber anda
is the313
dominant scale of the scatters either in the crustal waveguide (Wu et al., 2000) or at the
314
surface (He et al., 2008). Thus, the absorbing band may provide information regarding the
315
scales of heterogeneities. In Fig. 8c, the high-frequency absorbing band ① is located near
316
the northern Himalaya and southern Lhasa terrane. Its frequency band of 2.0 to 10.0 Hz
317
corresponds to small scatters of 60 m to 300 m. Numerous geothermal systems were found in
318
this region (Hochstein and Regenauer-Lieb, 1998). Heat-flow measurements show large
319
variations over a short distance in southernmost Tibet. For example, Francheteau et al. (1984)
reported that the heat flow decreases sharply from 146 to 91 mWm-2 over a distance less than 321
25 km between the southern and northern lakes near the Kangmar domain. The sharp heat
322
flow variations suggest that the regional melting conditions are met at relatively shallow
323
depths in the Tibetan crust. Xie et al. (2004) found a strong crustal Lg-wave attenuation in the
324
Yangbajing graben, and suggested that the attenuation resulted from hydrothermal and
325
magmatic fluids in the upper crust. The absorbing band ② is located in southern Tibet
326
between 28 and 31N. This area coincides with a series of bright spots found from reflection
327
surveys (Brown et al., 1996; Makovsky et al., 1996; Nelson et al., 1996). These bright spots
328
are located at depths of approximately 15 km and are interpreted to be the top of a low
329
P-velocity layer. Makovsky and Klemperer (1999) used AVO (amplitude versus offset)
330
modeling to constrain the P and S velocities of these spots to be 3.0±0.8 and 1.6±0.8 km/s,
331
respectively, and suggested that the spots were caused by aqueous fluid concentrations that
332
are underlain by partially molten layers. These layers are also characterized by low S
333
velocities (Cotte et al., 1999; Guo et al., 2009; Kind et al., 2002; Rapine et al., 2003), high
334
electromagnetic conductivities (Li et al., 2003; Unsworth et al., 2005), high conductive heat
335
flow (Francheteau et al., 1984; Hochstein and Regenauer-Lieb, 1998) and strong crustal
336
attenuation (Fan and Lay, 2003a; Xie et al., 2004), all suggesting that a minimum-strength
337
layer could exist in the mid-to-lower crust where modern day rheological flow is likely
338
occurring (Klemperer, 2006). The dominate frequency of the strong attenuation is between
339
0.25 to 2.0 Hz, suggesting heterogeneities of 0.3 km to 2.5 km. The absorbing band ③ spans
340
a distance of approximately 400 km under the Qiangtang and Songpan-Ganzi-Hoh xil terranes.
341
The dominant frequency of this absorbing band is 0.15 to 2.0 Hz, which corresponds to
heterogeneity scales between 0.3 km and 4 km. This is the most volcanically active area in
343
Tibet (e.g., Molnar, 1989; Turner et al., 1993). Owens and Zandt (1997) found a lower crustal
344
low-velocity zone with a high Poisson’s ratio of ~0.35 in this region and suggested that it
345
likely involves partial melt.
346
The major geology unites in the Tibetan Plateau are aligned in east-west direction and
347
gradually turn to southeast at the east end of the plateau. In Fig. 8d, we roughly project their
348
QLg(0.2-2.0 Hz) values and Pn velocities to the 93E profile. These average values come from 349
vast areas thus should reflect the behavior of these structures sequentially placed in front of
350
the collision of the Indian Plate. From south to north, the average QLg changes by first 351
decrease and then increase. At the southern end, the average QLg for the Himalaya Mountains 352
(HM) are around 300. The lowest average QLg of 182-185 appear in the Qiangtang (QT) and 353
Songpan-Ganze-Hoh xil terranes (ST). It reaches to 281 in the Qiaodmu basin (QB) and
354
reaches to 397 and 346 in AM and TB. The Pn velocity variation resembles that of the
355
attenuation with its lowest value occurs at QT and ST. However, at northern Tibet, the Pn
356
velocity raises before the increase of the QLg. If the Pn velocity reflects deeper activities 357
compared to crustal attenuation, Fig. 8d indicates that the shallow activities extended to far
358
north than deeper activities.
359
360
6. Conclusion 361
In this study, we obtained a broadband high-resolution attenuation model in the Tibetan
362
Plateau and its surrounding regions based on regional Lg-wave data. 7545 vertical component
363
seismograms were collected from 146 stations and 232 crustal earthquakes. By visually
checking the 0.5-1.5 Hz bandpassed Lg-wavetrains, we adopted the conventional group
365
velocity window of 3.6-3.0 km/s to calculate the Lg-wave spectra. After denoising, both
366
dual-station and single-station datasets were constructed to jointly invert the QLg distribution 367
and Lg-wave source function. The unevenly distributed sources and stations made the ray
368
coverage vary geographically. We used the checkerboard method to investigate the inversion
369
resolution. The best data coverage was in the Tibetan Plateau and between 0.05 and 1.5 Hz,
370
where the QLg model has a high resolution of approximately 11. Toward higher 371
frequencies and in the surrounding regions, the resolution deteriorates.
372
The station amplifications depend on the local rock types, sediment thicknesses and
373
elevations, etc. We calculated site amplifications and correct them at individual frequencies.
374
Site responses at 1 Hz are listed in Table S1.
375
The strong seismic attenuation is one of the prominent characteristics for the crust flow in
376
the Tibetan plateau (e.g., Klemperer, 2006). The low-QLg anomaly can be related to the 377
changing crustal thickness, sedimentary thickness, high temperature and/or partial melting in
378
the crust and uppermost mantle (e.g., Fan and Lay, 2003b; Xie et al., 2004; Zhao et al., 2010,
379
2013). Thus, the low QLg values only partially provide evidence for the material flow within 380
the Tibetan crust. To fully constrain the crustal flow pattern, further measurements such as Pn-,
381
Sn-, and Rayleigh-wave Q tomography are invoked based on the regional waveform dataset.
382
383
Acknowledgments 384
The broadband data used in this study were retrieved from the China Earthquake
385
Networks Center (CENC), the Data Management Centre of China National Seismic Network
at the Institute of Geophysics, the China Earthquake Administration (Zheng et al., 2010), the
387
IRIS Data Management Center, and the NEIC. The Pn-velocities used in Fig. 6b were
388
provided by Dr. C. Liang. Some figures were created using the GMT (Wessel and Smith,
389 1998). 390 391 References 392
Bai, D.H., Unsworth, M.J., Meju, M.A., Ma, X.B., Teng, J.W., Kong, X.R., Sun, Y., Sun, J.,
393
Wang, L.F., Jiang, C.S., Zhao, C.P., Xiao, P.F., Liu, M., 2010. Crustal deformation of the
394
eastern Tibetan plateau revealed by magnetotelluric imaging. Nat. Geosci. 3, 358-362,
395
doi:10.1038/NGEO830.
396
Bao, X.Y., Sandvol, E., Ni, J., Hearn, T., Chen, Y.S.J., Shen, Y., 2011. High resolution
397
regional seismic attenuation tomography in eastern Tibetan Plateau and adjacent regions.
398
Geophys. Res. Lett. 38, L16304, doi:10.1029/2011GL048012.
399
Bassin, C., Laske, G., Masters, G., 2000. The current limits of resolution for surface wave
400
tomography in North America. EOS Trans AGU 81, F897.
401
Beaumont, C., Jamieson, R.A., Nguyen, M.H., Medvedev, S., 2004. Crustal channel flows: 1.
402
Numerical models with applications to the tectonics of the Himalayan-Tibetan orogen. J.
403
Geophys. Res. 109, B06406, doi:10.1029/2003JB002809.
404
Brown, L.D., Zhao, W.J., Nelson, D.K., Hauck, M., Alsdorf, D., Ross, A., Cogan, M., Clark,
405
M., Liu, X.W., Che, J.K., 1996. Bright spots, structure, and magmatism in southern Tibet
406
from INDEPTH seismic reflection profiling. Science 274, 1688-1690.
407
Clark, M.K., Royden, L.H., 2000. Topographic ooze: Building the eastern margin of Tibet by
lower crustal flow. Geology 28, 703-706.
409
Cotte, N., Pedersen, H., Campillo, M., Mars, J., Ni, J.F., Kind, R., Sandvol, E., Zhao, W.,
410
1999. Determination of the crustal structure in southern Tibet by dispersion and amplitude
411
analysis of Rayleigh waves. Geophys. J. Int. 138, 809-819.
412
DeCelles, P.G., Robinson, D.M., Zandt, G., 2002. Implications of shortening in the
413
Himalayan fold-thrust belt for uplift of the Tibetan Plateau. Tectonics 21, 1062,
414
doi:10.1029/2001TC001322.
415
Fan, G.W., Lay, T., 2002. Characteristics of Lg attenuation in the Tibetan plateau. J. Geophys.
416
Res. 107, doi:10.1029/2001JB000804.
417
Fan, G.W., Lay, T., 2003a. Strong Lg attenuation in the Tibetan Plateau. Bull. Seism. Soc. Am.
418
93, 2264-2272.
419
Fan, G.W., Lay, T., 2003b. Strong Lg wave attenuation in the Northern and Eastern Tibetan
420
Plateau measured by a two-station/two-event stacking method. Geophys. Res. Lett. 30,
421
doi:10.1029/2002GL016211.
422
Flesch, L.M., Haines, A.J., Holt, W.E., 2001. Dynamics of the India-Eurasia collision zone. J.
423
Geophys. Res. 106, 16435-16460.
424
Francheteau, J., Jaupart, C., Shen, X.J., Kang, W.H., Lee, D.L., Bai, J.C., Wei, H.P., Deng,
425
H.Y., 1984. High heat-flow in southern Tibet. Nature 307, 32-36.
426
Guo, Z., Gao, X., Yao, H.J., Li, J., Wang, W.M., 2009. Midcrustal low-velocity layer beneath
427
the central Himalaya and southern Tibet revealed by ambient noise array tomography.
428
Geochem. Geophy. Geosy. 10, Doi: 10.1029/2009gc002458.
429
He, Y.F., Xie, X.B., Lay, T., 2008. Explosion-source energy partitioning and Lg-wave
excitation: Contributions of free-surface scattering. B Seismol Soc Am 98, 778-792.
431
Heidbach, O., Tingay, M., Barth, A., Reinecker, J., Kurfess, D., Muller, B., 2010. Global
432
crustal stress pattern based on the world stress map database release 2008. Tectonophysics
433
482, 3-15, doi:10.1016/j.tecto.2009.07.023.
434
Hochstein, M.P., Regenauer-Lieb, K., 1998. Heat generation associated with collision of two
435
plates: the Himalayan geothermal belt. J. Volcanol. Geoth. Res. 83, 75-92.
436
Jin, Y., McNutt, M.K., Zhu, Y.S., 1996. Mapping the descent of Indian and Eurasian plates
437
beneath the Tibetan Plateau from gravity anomalies. J. Geophys. Res. 101, 11275-11290.
438
Kind, R., Yuan, X., Saul, J., Nelson, D., Sobolev, S.V., Mechie, J., Zhao, W., Kosarev, G., Ni,
439
J., Achauer, U., Jiang, M., 2002. Seismic images of crust and upper mantle beneath Tibet:
440
Evidence for Eurasian plate subduction. Science 298, 1219-1221.
441
Klemperer, L.S., 2006. Crustal flow in Tibet: geophysical evidence for the physical state of
442
Tibetan lithosphere, and inferred patterns of active flow, in: Law, R.D., Searle, M.P., Godin, L.
443
(Eds.), Geol Soc Spec Publ. Geological Society, London, Special Publications, London, pp.
444
39-70.
445
Kosarev, G., Kind, R., Sobolev, S.V., Yuan, X., Hanka, W., Oreshin, S., 1999. Seismic
446
evidence for a detached Indian lithospheric mantle beneath Tibet. Science 283, 1306-1309.
447
Langille, J., Lee, J., Hacker, B., Seward, G., 2010. Middle crustal ductile deformation patterns
448
in southern Tibet: Insights from vorticity studies in Mabja Dome. J. Struct. Geol. 32, 70-85.
449
Li, C., Van der Hilst, R.D., Meltzer, A.S., Engdahl, E.R., 2008. Subduction of the Indian
450
lithosphere beneath the Tibetan Plateau and Burma. Earth Planet. Sci. Lett. 274, 157-168.
451
Li, S.H., Unsworth, M.J., Booker, J.R., Wei, W.B., Tan, H.D., Jones, A.G., 2003. Partial melt
or aqueous fluid in the mid-crust of Southern Tibet? Constraints from INDEPTH
453
magnetotelluric data. Geophys. J. Int. 153, 289-304.
454
Liang, C.T., Song, X.D., 2006. A low velocity belt beneath northern and eastern Tibetan
455
Plateau from Pn tomography. Geophys. Res. Lett. 33, L22306, doi:10.1029/2006GL027926.
456
Liu, M.J., Mooney, W.D., Li, S.L., Okaya, N., Detweiler, S., 2006. Crustal structure of the
457
northeastern margin of the Tibetan plateau from the Songpan-Ganzi terrane to the Ordos basin.
458
Tectonophysics 420, 253-266, doi:10.1016/j.tecto.2006.01.025.
459
Makovsky, Y., Klemperer, S.L., 1999. Measuring the seismic properties of Tibetan bright
460
spots: Evidence for free aqueous fluids in the Tibetan middle crust. J. Geophys. Res. 104,
461
10795-10825.
462
Makovsky, Y., Klemperer, S.L., Ratschbacher, L., Brown, L.D., Li, M., Zhao, W.J., Meng,
463
F.L., 1996. INDEPTH wide-angle reflection observation of P-wave-to-S-wave conversion
464
from crustal bright spots in Tibet. Science 274, 1690-1691.
465
McNamara, D.E., Owens, T.J., Silver, P.G., Wu, F.T., 1994. Shear-wave anisotropy beneath
466
the Tibetan Plateau. J. Geophys. Res. 99, 13655-13665.
467
Molnar, P., 1989. The geologic evolution of the Tibetan Plateau. Am Sci 77, 350-360.
468
Molnar, P., Lyoncaen, H., 1989. Fault plane solutions of earthquakes and active tectonics of
469
the Tibetan Plateau and its margins. Geophys. J. Int. 99, 123-153.
470
Nelson, K.D., Zhao, W.J., Brown, L.D., Kuo, J., Che, J.K., Liu, X.W., Klemperer, S.L.,
471
Makovsky, Y., Meissner, R., Mechie, J., Kind, R., Wenzel, F., Ni, J., Nabelek, J., Chen, L.S.,
472
Tan, H.D., Wei, W.B., Jones, A.G., Booker, J., Unsworth, M., Kidd, W.S.F., Hauck, M.,
473
Alsdorf, D., Ross, A., Cogan, M., Wu, C.D., Sandvol, E., Edwards, M., 1996. Partially molten
middle crust beneath southern Tibet: Synthesis of project INDEPTH results. Science 274,
475
1684-1688.
476
Ni, J., Barazangi, M., 1983. High-frequency seismic-wave propagation beneath the Indian
477
shield, Himalayan arc, Tibetan plateau and surrounding regions: High uppermost mantle
478
velocities and efficient Sn propagation beneath Tibet. Geophys. J. Roy. Astr. Soc. 72,
479
665-689.
480
Owens, T.J., Zandt, G., 1997. Implications of crustal property variations for models of Tibetan
481
plateau evolution. Nature 387, 37-43.
482
Rai, S.S., Ashish, Padhi, A., Sarma, P.R., 2009. High crustal seismic attenuation in
483
Ladakh-Karakoram. Bull. Seism. Soc. Am. 99, 407-415.
484
Rapine, R., Tilmann, F., West, M., Ni, J., Rodgers, A., 2003. Crustal structure of northern and
485
southern Tibet from surface wave dispersion analysis. J. Geophys. Res. 108, Artn 2120
486
Doi 10.1029/2001jb000445.
487
Rodgers, A.J., Schwartz, S.Y., 1998. Lithospheric structure of the Qiangtang Terrane, northern
488
Tibetan Plateau, from complete regional waveform modeling: Evidence for partial melt. J.
489
Geophys. Res. 103, 7137-7152.
490
Royden, L.H., Burchfiel, B.C., van der Hilst, R.D., 2008. The geological evolution of the
491
Tibetan Plateau. Science 321, 1054-1058, doi:10.1126/science.1155371.
492
Searle, M.P., Elliott, J.R., Phillips, R.J., Chung, S.L., 2011. Crustal-lithospheric structure and
493
continental extrusion of Tibet. Journal of the Geological Society, London 168, 633-672,
494
doi:10.1144/0016-76492010-139.
495
Shapiro, N.M., Ritzwoller, M.H., Molnar, P., Levin, V., 2004. Thinning and flow of Tibetan
crust constrained by seismic anisotropy. Science 305, 233-236.
497
Turner, S., Hawkesworth, C., Liu, J.Q., Rogers, N., Kelley, S., Vancalsteren, P., 1993. Timing
498
of Tibetan uplift constrained by analysis of volcanic-rocks. Nature 364, 50-54.
499
Unsworth, M.J., Jones, A.G., Wei, W., Marquis, G., Gokarn, S.G., Spratt, J.E.,
500
the_INDEPTH-MT_team, 2005. Crustal rheology of the Himalaya and southern Tibet
501
inferred from magnetotelluric data. Nature 438, 78-81, doi:10.1038/nature04154.
502
Wang, C.Y., Han, W.B., Wu, J.P., Lou, H., Chan, W.W., 2007. Crustal structure beneath the
503
eastern margin of the Tibetan Plateau and its tectonic implications. J. Geophys. Res. 112,
504
B07307, doi:10.1029/2005JB003873.
505
Wang, Q., Gao, Y., Shi, Y., Wu, J., 2013. Seismic anisotropy in the uppermost mantle beneath
506
the northeastern margin of Qinghai-Tibet plateau: evidence from shear wave splitting of SKS,
507
PKS and SKKS. Chinese J. Geophys. 56, 892-905, doi: 10.6038/cjg20130318.
508
Wei, W.B., Unsworth, M., Jones, A., Booker, J., Tan, H.D., Nelson, D., Chen, L.S., Li, S.H.,
509
Solon, K., Bedrosian, P., Jin, S., Deng, M., Ledo, J., Ray, D., Roberts, B., 2001. Detection of
510
widespread fluids in the Tibetan crust by magnetotelluric studies. Science 292, 716-718.
511
Wessel, P., Smith, W., 1998. New, improved version of the generic mapping tools released.
512
Eos 79, 579.
513
Wu, R.S., Jin, S., Xie, X.B., 2000. Energy partition and attenuation of Lg waves by numerical
514
simulations using screen propagators. 120, 227-243.
515
Xie, J., 2002. Lg Q in the eastern Tibetan Plateau. Bull. Seism. Soc. Am. 92, 871-876.
516
Xie, J., Gok, R., Ni, J., Aoki, Y., 2004. Lateral variations of crustal seismic attenuation along
517
the INDEPTH profiles in Tibet from Lg Q inversion. J. Geophys. Res. 109, B10308,
doi:10.1029/2004JB002988.
519
Xu, L.L., Rondenay, S., van der Hilst, R.D., 2007. Structure of the crust beneath the
520
southeastern Tibetan Plateau from teleseismic receiver functions. Phys. Earth Planet. Int. 165,
521
176-193, doi:10.1016/j.pepi.2007.09.002.
522
Yao, H.J., Beghein, C., van der Hilst, R.D., 2008. Surface wave array tomography in SE Tibet
523
from ambient seismic noise and two-station analysis - II. Crustal and upper-mantle structure.
524
Geophys. J. Int. 173, 205-219, doi:10.1111/j.1365-246X.2007.03696.x.
525
Zhang, P., Shen, Z., Wang, M., Gan, W.J., Burgmann, R., Molnar, P., 2004. Continuous
526
deformation of the Tibetan Plateau from global positioning system data. Geology 32, 809-812,
527
doi: 10.1130/G20554.1.
528
Zhang, T.R., Lay, T., 1995. Why the Lg phase does not traverse oceanic crust. Bull. Seism.
529
Soc. Am. 85, 1665-1678.
530
Zhang, Z.J., Deng, Y.F., Teng, J.W., Wang, C.Y., Gao, R., Chen, Y., Fan, W.M., 2011. An
531
overview of the crustal structure of the Tibetan plateau after 35 years of deep seismic
532
soundings. J. Asian Earth Sci. 40, 977-989, doi:10.1016/j.jseaes.2010.03.010.
533
Zhang, Z.J., Yuan, X.H., Chen, Y., Tian, X.B., Kind, R., Li, X.Q., Teng, J.W., 2010. Seismic
534
signature of the collision between the east Tibetan escape flow and the Sichuan Basin. Earth
535
Planet. Sci. Lett. 292, 254-264, doi:10.1016/j.epsl.2010.01.046.
536
Zhao, L.F., Xie, X.B., Wang, W.M., Zhang, J.H., Yao, Z.X., 2010. Seismic Lg-wave Q
537
tomography in and around Northeast China. J. Geophys. Res. 115, B08307,
538
doi:10.1029/2009JB007157.
539
Zhao, L.F., Xie, X.B., Wang, W.M., Zhang, J.H., Yao, Z.X., 2013. Crustal Lg-wave
attenuation within the North China craton and its surrounding regions. Geophys. J. Int., In
541
review.
542
Zheng, X.F., Yao, Z.X., Liang, J.H., Zheng, J., 2010. The role played and opportunities
543
provided by IGP DMC of China National Seismic Network in Wenchuan earthquake disaster
544
relief and researches. Bull. Seism. Soc. Am. 100, 2866-2872, doi: 10.1785/0120090257.
545
Zhou, L.Q., Zhao, C.P., Chen, Z.L., Zheng, S.H., 2011. Amplitude tomography of Lg waves
546
in Xinjiang and its adjacent regions. Bull. Seism. Soc. Am. 101, 1302-1314,
547 doi:10.1785/0120100267. 548 549 Figure captions. 550
Figure 1. A topographic map superimposed with main fault systems (light-blue lines), 551
regional tectonics in the Tibetan plateau and its surrounding regions, the locations of the
552
CENC (solid squares) and IRIS (triangles) stations, and the epicenters of selected earthquakes
553
(crosses) used in this study. The information about the major geo-blocks is also listed in Table
554
1.
555
556
Figure 2. Summary on Lg-wave data processing. As an example, shown here are (a) Raw 557
Lg-wave spectra (circles) and noise spectra (triangles) recorded at station MC10 from
558
earthquake 2004/08/26, (b) signal-to-noise ratios (SNR), (c) noise-corrected Lg-wave spectra,
559
and (d) the numbers of available rays at individual frequencies along with the estimated
560
resolutions marked by shaded areas. The dashed line in (b) is the threshold used to eliminate
561
the data with SNR below 2.0.
563
Figure 3. Selected QLg maps compared with previous investigations. (a)-(c) QLg maps at 0.5 564
Hz, 1.0 Hz and 2.0 Hz, (d) a schematic map showing Lg Q measurements from previous
565
investigations, (e) 1 Hz ray coverage, and (f) checkerboard resolution analyses. Also
566
illustrated in the figures are geological boundaries (white or red lines) and the fault systems
567
(thin black lines).
568
569
Figure 4. (a) Frequency-dependent QLg for the Songpan-Ganzi-Hoh xil terrane (ST), and (b) 570
the QLg versus frequency for different geo-blocks. 571
572
Figure 5. Selected cross sections of the broadband QLg. Left column, comparison of average
573
QLg, surface topography, and Moho depth. Right column, the QLg versus frequency. The 574
horizontal coordinate is longitude and latitude is labeled in the figure. Details refer to the text.
575
576
Figure 6. Comparison between (a) the average QLg (over 0.2 – 2.0 Hz) and (b) the Pn velocity 577
in the Tibetan Plateau and surrounding regions. Also shown in the figure are main fault
578
systems (light-blue lines) and regional tectonics (white lines). Note that the red lines are
579
g 200
L
Q contours which delimit the high attenuation areas. Details refer to the text.
580
581
Figure 7. The average QLg (over 0.2 – 1.0 Hz) versus the average crustal thickness for 582
selected geology units in the Tibetan Plateau and its vicinity. The data from the major part of
583
the Tibetan Plateau are circled by the dashed line. The data from regions surrounding the
Tibetan Plateau are circled by the dotted line. The triangles and squares are data from the
585
NEC and NCC. Details refer to the text.
586
587
Figure 8. A combined longitudinal cross section along 93E, with (a) surface topography, (b)
588
schematic crust and upper mantle structure, (c) log(QLg) versus frequency, and (d) comparison 589
between average Lg Q and average Pn velocity for selected geology units. Details refer to the
590
text.
Highlights
A high-resolution broadband Lg-wave Q model for Tibetan Plateau.
Material flow patterns in Tibetan crust constrained by the attenuation model.
Statistical investigations link the Q model with the plateau dynamics.
The very low Q and thick crust in Tibet is unique compared with other regions.
In Tibet, the Lg wave Q and Pn velocity are generally correlated.
70˚ 75˚ 80˚ 85˚ 90˚ 95˚ 100˚ 105˚ 110˚ 20˚ 25˚ 30˚ 35˚ 40˚ HM LT QT ST EKT WKT QM QB AM TB YM OB SB YP AU
Indian Plate
Tibetan Plateau
1000 kmFigure 1, Zhao et al., 2013
Legend
Boundary of geological blocks or suture Faults CENC station IRIS station Earthquake -4.0 0.0 0.5 1.5 3.0 4.5 8.0 Topography (km) Figure01105 104 103 102 101 10 10-1 10-2 10-3
Amplitude (nm/Hz)
(a)
Lg sampling
Noise sampling
Event: 2004/08/26 13:54:28.39
Station: MC10
Distance: 547.4(km), mb: 4.8
104 103 102 101 10 10-1(b)
SNR
2.0
105 104 103 102 101 10Amplitude
(nm/Hz)
(c)
Lg signal
14000 12000 10000 8000 6000 4000 2000 0 .01 .1 1 10Frequency (Hz)
Number of rays
(d)
1.0 1.0 × 1.1 1.1 × 1.2 1.2 × Combinned data Single-station data Dual-station data Figure0275˚ 80˚ 85˚ 90˚ 95˚ 100˚ 105˚ 110˚ 25˚ 30˚ 35˚ 40˚ 30 100 160 220 300 450 Q HM LT QT ST EKT WKT QM QB AM TB YM OB SB YP AU
Indian Plate
Tibetan Plateau
(a)
f=0.5Hz 75˚ 80˚ 85˚ 90˚ 95˚ 100˚ 105˚ 110˚ 25˚ 30˚ 35˚ 40˚ 100 300 500 700 900 1400 Q HM LT QT ST EKT WKT QM QB AM TB YM OB SB YP AUIndian Plate
Tibetan Plateau
(c)
f=2.0Hz 75˚ 80˚ 85˚ 90˚ 95˚ 100˚ 105˚ 110˚ 25˚ 30˚ 35˚ 40˚ 50 120 220 320 450 650 Q HM LT QT ST EKT WKT QM QB AM TB YM OB SB YP AUIndian Plate
Tibetan Plateau
(b)
f=1.0Hz 75˚ 80˚ 85˚ 90˚ 95˚ 100˚ 105˚ 110˚ 25˚ 30˚ 35˚ 40˚ HM LT QT ST EKT WKT QM QB AM TB YM OB SB YP AUIndian Plate
Tibetan Plateau
83 147 106 90 65 90 190 103 500 146 70 440 724 720 717 416 393 474(d)
f=1.0Hz 75˚ 80˚ 85˚ 90˚ 95˚ 100˚ 105˚ 110˚ 25˚ 30˚ 35˚ 40˚ HM LT QT ST EKT WKT QM QB AM TB YM OB SB YP AUIndian Plate
Tibetan Plateau
(e)
f=1.0Hz 75˚ 80˚ 85˚ 90˚ 95˚ 100˚ 105˚ 110˚ 25˚ 30˚ 35˚ 40˚ δQ % % % % % % % % -7 -5 -3 -1 1 3 5 7 HM LT QT ST EKT WKT QM QB AM TB YM OB SB YP AUIndian Plate
Tibetan Plateau
(f)
f=1.0Hz Figure03.1 1 10
Frequency (Hz)
104 103 102 101Lg Q
Q =0 217 147 321( - )ST
(a)
.1 1 10Frequency (Hz)
102 103Lg Q
TP HM LT QT ST EKT WKT QB QM AM TB AU YM OB SB YP(b)
Figure 4, Zhao et al., 2013
Figure04
0 4 8 Latitude: 37.5°N TB EKT QB QM OB -80 -40 0 Elve/Moho (km) 0 300 600 Lg Q 70˚ 75˚ 80˚ 85˚ 90˚ 95˚ 100˚ 105˚ 110˚
➙
➙
(a)
-1 0 1 Log 10 (Frequency) 70˚ 75˚ 80˚ 85˚ 90˚ 95˚ 100˚ 105˚ 110˚(b)
0 4 8 Latitude: 35°N QT ST EKT -80 -40 0 Elve/Moho (km) 0 300 600 Lg Q➙
➙
➙
(c)
-1 0 1 Log 10 (Frequency)(d)
0 4 8 Latitude: 32.5°N QT ST SB -80 -40 0 Elve/Moho (km) 0 300 600 Lg Q➙
➙
➙
(e)
-1 0 1 Log 10 (Frequency)(f)
0 4 8 Latitude: 30°N HM LT QT ST SB -80 -40 0 Elve/Moho (km) 0 300 600 Lg Q➙
➙
(g)
-1 0 1 Log 10 (Frequency)(h)
0 4 8 Latitude: 27.5°N HM LT YP -80 -40 0 Elve/Moho (km) 0 300 600 Lg Q➙
➙
➙
(i)
-1 0 1 Log 10 (Frequency)(j)
0 4 8 Latitude: 25°N YP -80 -40 0 70˚ 75˚ 80˚ 85˚ 90˚ 95˚ 100˚ 105˚ 110˚ Elve/Moho (km) 0 300 600 Lg Q➙
➙
(k)
-1 0 1 Log 10 (Frequency) 95˚ 100˚ 105˚ 110˚(l)
0.8 2.0 2.4 2.8 3.1 4.2 log10(Q) Figure0575˚ 80˚ 85˚ 90˚ 95˚ 100˚ 105˚ 110˚ 25˚ 30˚ 35˚ 40˚ 50 120 180 250 320 650 Q
(a)
QLg (0.2 - 2.0 Hz) HM LT QT ST EKT WKT QM QB AM TB YM OB SB YP AUIndian Plate
Tibetan Plateau
75˚ 80˚ 85˚ 90˚ 95˚ 100˚ 105˚ 110˚ 25˚ 30˚ 35˚ 40˚ HM LT QT ST EKT WKT QM QB AM TB YM OB SB YP AUIndian Plate
Tibetan Plateau
7.80 8.00 8.06 8.08 8.10 8.30 km/s(b)
Pn VelocityFigure 6, Zhao et al., 2013
Figure06
100
150
200
250
300
350
400
450
Lg Q (0.2-1.0 Hz)
20
30
40
50
60
70
80
Crustal Thickness (km)
Entire
NCC
Entire
NEC
TPHM
LT
QT
ST
EKT
WKT
QB
QM
AM
TB
AU
YM
OB
SB
YP
Figure 7, Zhao et al., 2013
TP
Tibetan
> 4000m
Surrounding
region except
YP and QM
Figure070 2 4 6 8 Elevation (km) 26˚ 28˚ 30˚ 32˚ 34˚ 36˚ 38˚ 40˚ (N) MCT ISZ BSZ JSZ KF HM LT QT ST QB
Himalayan Fold-thrust Belt Tibetan Plateau Plio-Quaternary Tibet
AM TB
(a)
-120 -80 -40 0 Depth (km) GreaterIndian Low Crust
Greater Indian Lithosphere Asthenosphere Eurasian Lithosphere
(b)
-1 0 1 Log 10 (Frequency) 0.8 2.0 2.4 2.8 3.1 4.2 log10(Q)(c)
500 150 200 250 300 350 400 450 Lg Q 26˚ 28˚ 30˚ 32˚ 34˚ 36˚ 38˚ 40˚ (N) HM LT QT ST EKT QB AM TB(d)
7.96 8.00 8.04 8.08 8.12 8.16 8.20 8.24 Pn (km/s)Lg Q (0.2-2.0 Hz)
Pn velocity
1 2 3Figure 8, Zhao et al., 2013
Figure08
CRUST2.0 Q0 Broadband Q Low Frequency Q Pn Velocity
Geological block Block name Crustal thickness (1 Hz Q) (0.2 - 2.0 Hz) (0.2 - 1.0 Hz) (km/s) Type of blocks the Tibetan Plateau ( > 4 km) TP 64.1 ± 7.8 280 (194-406) 220 (153-316) 195 ± 41 8.04±.07 Integrated
Himalaya HM 63.6 ± 7.1 386 (315-473) 291 (245-345) 255 ± 68 8.07±.05 Mountains Lhasa terrane LT 65.9 ± 11.4 284 (214-378) 220 (159-303) 196 ± 41 8.03±.08 Integrated Qiangtang terrane QT 67.0 ± 8.1 238 (171-332) 185 (136-251) 163 ± 35 8.00±.05 Integrated Songpan-Ganzi-Hoh xil terrane ST 57.8 ± 7.7 217 (147-321) 182 (129-256) 164 ± 24 8.00±.05 Integrated Eastern Kunlunshan terrane EKT 59.0 ± 4.4 289 (223-374) 218 (160-298) 194 ± 48 8.10±.06 Mountains Western Kunlunshan terrane WKT 60.7 ± 5.1 330 (263-414) 259 (212-316) 230 ± 53 8.00±.06 Mountains
Qaidam basin QB 57.9 ± 2.5 385 (273-544) 281 (201-395) 250 ± 72 8.16±.03 Basin Qilianshan mountains QM 51.4 ± 5.3 315 (252-393) 265 (204-345) 239 ± 37 8.11±.06 Mountains Altyn Tagh mountains AM 51.8 ± 2.4 517 (439-607) 397 (342-461) 363 ± 83 8.15±.04 Mountains
Tarim basin TB 51.1 ± 3.6 443 (388-506) 346 (301-397) 313 ± 69 8.13±.06 Basin Alashan uplift AU 49.4 ± 3.2 452 (394-518) 343 (304-386) 305 ± 79 8.11±.06 Mountains Yinshan mountains YM 43.0 ± 3.7 444 (385-512) 335 (300-374) 292 ± 76 7.91±.21 Mountains
Ordos basin OB 41.3 ± 2.4 395 (328-476) 328 (283-381) 295 ± 48 --- Basin Sichuan basin SB 40.6 ± 2.3 456 (425-489) 370 (343-398) 343 ± 68 8.06±.05 Basin Yungui plateau YP 43.0 ± 1.2 247 (184-333) 221 (159-305) 203 ± 19 8.02±.04 Integrated
Table 1. Lg Q Models for Individual Geological Blocks
Table01
TableS1
TableS2
TableS3