國 立 交 通 大 學
電子工程學系
電子研究所
碩 士 論 文
以金為基礎的奈米尺度超常介質之光學性質探討
Optical Studies of Au-based Meta-materials on
Nano-scale
研 究 生 :吳旻蓁 Min-chen Wu
指導教授 :倪衛新 博士 Prof. Wei-xi Ni
以金為基礎的奈米尺度超常介質之光學性質探討
Optical Studies of Au-based Meta-materials on
Nano-scale
研 究 生:吳旻蓁 Min-chen Wu
指導教授:倪衛新 博士 Prof. Wei-xi Ni
國 立 交 通 大 學
電子工程學系
電子研究所
碩 士 論 文
A Thesis
Submitted to Department of Electronics Engineering & Institute of Electronics
College of Electrical and Computer Engineering
National Chiao Tung University
In Partial Fulfillment of the Requirements
For the Degree of Master
In
Electronics Engineering
July 2008
Hsinchu, Taiwan, Republic of China
中華民國九十七年七月
以金為基礎的奈米尺度超常介質之光學性質探討
研 究 生:吳旻蓁 指導教授:倪衛新 博士
國立交通大學
電子工程學系 電子研究所碩士班
摘 要
超常介質是週期性金屬結構,具有電漿子共振、人工磁性以及左手特性等, 分別對應到某特定波長的電磁波在金屬陣列中傳遞時,材料所呈現的負導電係數 (ε)、負導磁係數(μ),及由此而造成的負折射率現象。 本論文利用電子束微影和舉離技術,成功地在玻璃上製造了線寬120至360奈 米等級的三種金基共振還陣列:單裂隙共振環(split ring resonator, SRR)、無裂隙共 振環(closed ring resonator, CRR)以及雙裂隙共振環(2-cut split ring resonator, 2-cut SRR),圖形陣列面積大約是90×90μm2。傅式光學轉換紅外線光譜儀(FTIR)被用於研究超常介質所產生的光學性質。圖形尺度與電性共振頻率的關係,以及裂隙相 對於電場的方位對三種共振環反射光譜的影響在本論文中被探討和比較。
Optical Studies of Au-based Meta-materials on
Nano-scale
Student: Min-chen Wu Advisor:
Prof. Wei-xi Ni
Department of Electronics Engineering
& Institute of Electronics
National Chiao Tung University
ABSTRACT
Meta-materials are periodic metal structures exhibiting plasmonic resonance, artificial magnetism, and/or left-handed behaviors, which correspond to negative values of permittivity (ε), permeability (μ), and consequent refraction index (n), when electromagnetic (EM) waves propagate in these patterned arrays at a certain range of wavelengths.
By using e-beam lithography and lift-off technique, three types of gold ring resonators with line width 120-360 nm were fabricated on glass. The area of the patterned array was about 90×90μm2. Fourier transfer infrared spectroscopy (FTIR)
measurements were engaged for the study of optical properties of these meta-material structures. The properties of the electric resonance, such as scaling, were observed. The influence of the orientation of the ring resonators with respect to the incident electric field on the reflection spectra were also compared among different ring resonator structures.
Acknowledgement
I would like to show my deepest appreciation to my advisors, Dr. Wei-xi Ni, for his guidance and support on my research and life. I would also like to thank Dr. Min-Hsiung Shih, Dr. Shih-Ying Hsu, Pei-Hsuan Han, Shih-Kuo Tsai, Ting-Yi Chung, Ching-Hsien Chen, Chien-Hua Chen, Yu-Lin Yang, Shih-Hung Chen, and Chin-Tsai Hsu, who assisted me in various ways in solving problems during my thesis work. Finally, I want to express my sincere gratitude for my parents, and my best friend, Chi-Chieh Huang. Without them, I would not be able to overcome the challenges I encountered.
Contents
Contents…………..………Ⅰ
List of Tables………..………Ⅲ
List of Figures………....….Ⅳ
1 Introduction……….1
2 Theory of Metamaterials……….6
2.1 Magnetic Response of SRR………...72.1.1 Geometric Parameters and Tunable SRR………8
2.1.2 Electric Coupling Effect and Anisotropic Nature of SRR…………11
2.2 Electric Response of SRR………...…………...15
2.2.1 Periodic and Disordered SRR Array……….……..…………..16
2.3 Identifying Magnetic Response of SRR ………..………….20
2.4 Higher Order Excitation Modes of SRR………..………..22
2.5 Properties of CMM………27
2.6 Other Structures Generating Negative μ or n……….31
3 Design of Nano-scaled SRR………...………..34
3.1 Non-linear Scaling of SRR...35
3.2 Patterns of SRR………..42
3.2.1 Unit Cell Size of SRR………..……….42
3.2.2 Square Single-ring SRR………...……….43
3.2.3 Geometric Parameters of SRR………..46
3.3 Arrangement of SRR………..46
4 Fabrication and Results………...………..50
4.1 Pre-patterning……….50
4.2 Patterning with E-beam Lithography………..………...51
4.3 Thermal Evaporation of Gold and Lift-off…..………..56
5 Measurement and Results………...………..67
5.1 Measurement………..67
5.2 Analysis Procedure………...……….70
5.3 Results and Discussion…...………...71
6 Conclusion………....84
List of Table
2-1 Measured magnetic resonance frequencies for six different resonator
structures………...……10
3-1 The parameters of the square single-ring SRR designed for this thesis
work………..49
4-1 Exposure recipe……….53 5-1 Beam splitter and detector materials used in Hyperion 2000 FTIR………..68 5-2 The wavelengths and wave numbers specifying the NIR, MIR, and VIS
spectral ranges……...………68
5-3 Measurement conditions………69 5-4 Expected responses for the three types of ring resonators under the four
measurement geometries………...71
5-5 The numeral data of the electric response wavelength and corresponding
List of Figure
1-1 A schematic presentation of material classification based on the dielectric
and magnetic properties……….3
2-1 Plan view of a conventional double-ring SRR………7 2-2 Schematic drawings of different resonator structures……….9 2-3 Transmission spectra of single-ring resonator with different number of cuts…...10 2-4 Variation of magnetic resonance frequency with the split width………...10 2-5 SRR in the four nontrivial EM field propagation directions and polarizations….13 2-6 Measured transmission spectra of SRRs shown in Figure 2-5………..13 2-7 Reflectance spectra for aluminum SRR sample showing experimental
and simulated TE and TM resonant peaks………..………..14
2-8 Simple drawings for the polarization in two different orientations of a
single-ring SRR……….14
2-9 Two examples of symmetric SRR designs and the possible modified forms……14 2-10 Geometries considered for the study of interacting SRRs………...17 2-11 Scattering cross section computed for different SRR arrangements………..….18 2-12 Schematic drawings of inter-plane disordered SRRs and measured
transmission spectra...19
2-13 Schematic drawings of intra-plane disordered SRRs and measured
transmission spectra...19
2-14 Measured transmission spectra of periodic and corresponding
disordered SRRs………..20
2-15 Unit cell of SRR with split-axis along different directions……….21 2-16 Schematic drawing of unit cell of CRR………..21 2-17 Measured transmission spectra of the unit cell of SRR and CRR………….…..21 2-18 A U-shaped SRR unit cell with geometrical parameters……….22 2-19 Extracted Re(ε) and Re(μ) for the magnetic resonance, the EEMR and the
short-wire-like resonance of the U-shaped gold SRRs….………..……23
2-20 Transmission spectra and extracted Re(ε) of the U-shaped SRRs………..…….24 2-21 Current distribution of the lowest 3 modes for the EEMR and
short-wire-like response………..24
2-22 Magnitude of the normalized polarization density of the U-shaped SRRs
with different length of side arms………...25
2-23 Magnitude of the normalized magnetization and the extracted real part
2-24 In-plane and off-plane configurations of CMMs and corresponding
transmission coefficient………..29
2-25 Response of five periodic systems to electromagnetic wave……….…….30
2-26 The simplified geometry as the first building block toward S structure and corresponding Re(ε) and Re(μ)…………..………..32
2-27 A schematic drawing of the S-shaped resonator and corresponding Re(ε) and Re(μ)………32
2-28 Equivalent circuit for the geometry shown in Figure 2-29 (a)………....33
3-1 Dispersion curves of the internal impedance of silver, gold, and copper………..36
3-2 Real and imaginary parts of the effective permeability of the silver SRRs as a function of the SRR pattern size……….………...36
3-3 Frequency dependencies of the minimum value of Re(μ) of the SRRs with different filling factors………..37
3-4 The geometries of the 1-, 2-, and 4-cut single-ring SRR, and the charge accumulation in a 4-cut SRR and its equivalent LC circuit……….……….39
3-5 The scaling of the magnetic resonance frequency as a function of the size of the unit cell a for the 1-, 2-, and 4-cut SRR, respectively……...………..40
3-6 Normalized transmission of the SRRs………...……41
3-7 Square and orthogonal single-ring SRRs………..….43
3-8 ωm and ω0 versus a/l for a square single-ring SRR and ωm and ω0 versus a/lk for an orthogonal single-ring SRR………..………..43
3-9 Transmission and Re(μ) versus frequency for one single-ring square and circular SRR.……….45
3-10 Transmission versus frequency for the double-ring SRR and its isolated outer and inner ring SRRs………...………....45
3-11 Designed unit cell of SRR, CRR, and 2-cut SRR………46
3-12 The measured transmission and reflection spectra with two polarizations for different lattice constants of SRRs and CRRs………47
4-1 The SEM image of a shifted CRR……….54
4-2 The SEM image of a shifted CRR……….54
4-3 Adjusted layout and the SEM image result of SRR after development...……..55
4-4 The SEM image of the adjusted SRR after development.……….55
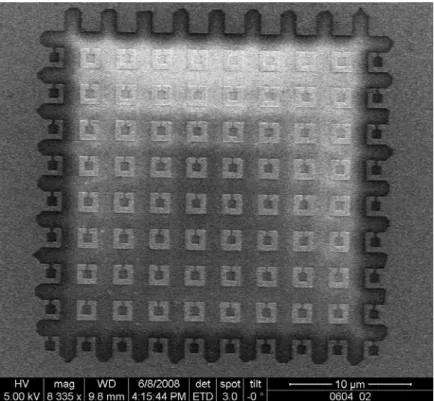
4-5 The SEM image of a SRR array after lift-off………58
4-6 The SEM image of a SRR array after lift-off………58
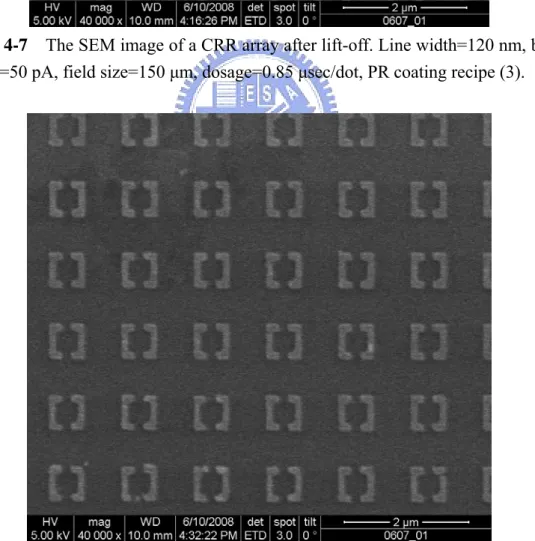
4-7 The SEM image of a CRR array after lift-off………59
4-8 The SEM image of a 2-cut SRR array after lift-off………...59
4-9 The SEM image of a SRR array after lift-off………60
4-11 The SEM image of a 2-cut SRR array after lift-off……….61
4-12 The SEM image of a SRR array after lift-off………..61
4-13 The SEM image of a CRR array after lift-off………..62
4-14 The SEM image of a 2-cut SRR array after lift-off……….62
4-15 The SEM image of a SRR array after lift-off………..63
4-16 The SEM image of a CRR array after lift-off………..63
4-17 The SEM image of a 2-cut SRR array after lift-off……….64
4-18 The SEM image of a SRR array after lift-off………..64
4-19 The SEM image of a CRR array after lift-off………..65
4-20 The SEM image of a 2-cut SRR array after lift-off……….65
4-21 The SEM image of a SRR array after lift-off………..66
4-22 The 3D SEM image of a SRR array after lift-off………66
5-1 The light path of the grazing incidence objective in Hyperion 2000………68
5-2 SRR in the four nontrivial EM field propagation directions and polarizations….69 5-3 Measurement geometries that correspond to the four combinations in Figure 5-2, accordingly……….…69
5-4 Normalized transmittance of the SRR array for geometry (c)………...72
5-5 Normalized reflectance of the SRR array for geometry (a)………...73
5-6 Normalized reflectance of the SRR array for geometry (b)………..73
5-7 Normalized reflectance of the SRR array for geometry (c)………..74
5-8 Normalized reflectance of the SRR array for geometry (d)………..74
5-9 Normalized reflectance of the CRR array for geometry (a)………..75
5-10 Normalized reflectance of the CRR array for geometry (b)………76
5-11 Normalized reflectance of the CRR array for geometry (c)………76
5-12 Normalized reflectance of the CRR array for geometry (d)………77
5-13 Normalized reflectance of the 2-cut SRR array for geometry (a)………...78
5-14 Normalized reflectance of the 2-cut SRR array for geometry (b)………...78
5-15 Normalized reflectance of the 2-cut SRR array for geometry (c)………...79
5-16 Normalized reflectance of the 2-cut SRR array for geometry (d)………...79
5-17 The scaling of the electric response wavelength with unit cell size for the SRR array measured by geometry (c)……….80
5-18 Comparison of the normalized reflectance……….….82
5-19 Comparison of the normalized reflectance for the 2-cut SRR arrays in geometry (c) and (d)………83
Chapter 1
Introduction
For a finite slab of continuous material, the complex transmission coefficient T and reflection coefficient R are directly related to the refractive index n and impedance z associated with the slab, which can in turn be expressed in terms of permittivity ε and permeability μ: n= εμ (1.1) ε μ = z (1.2) Thus, ε and μ are often extracted from the experimentally measured refractive index data, and their frequency (or wavelength) dependence is studied using light transmission and reflection spectra.
Electric ε and magnetic μ characterize the macroscopic response of a homogeneous medium to the applied electric and magnetic fields. These are macroscopic parameters because one usually seeks time or spatial response that is averaged over sufficiently long time or sufficiently large space. Therefore only frequency components of the individual (atomic or molecular) resonators driven by the external fields survive in macroscopic measurements. The concept can be extended to inhomogeneous materials if the domain size is much smaller than the wavelength of radiation. The radiation does not necessarily resolve the individual mesostructures, but responds to the macroscopic resonances of the structure. Such materials are called metamaterials, and can be characterized by macroscopic parameters like homogeneous materials.
Usually, optical materials have positive values of ε and μ. Although it was realized that the refractive index would have to be a complex quantity to account for absorption, or even a tensor to describe anisotropic behavior of materials, the question of the sign of the refractive index did not arise. According to the Maxwell’s equation for a planar harmonic wave ei(k⋅r−ωt):
k×E=ωμ0μH (1.3)
E H
k× =-ωε0 (1.4) where k is the wave vector, E and H are the electric and magnetic fields respectively. Using the definition k =(nω/c)n∧, where ∧n is the unit vector along E×H, it appears that the refractive index n with Re(ε)<0 and Re(μ)<0 is also negative. Such
materials permit wave to propagate while wave in media with only Re(ε)<0 or
Re(μ)<0 decays since k2<0. Note that in the case of DNGs (double negative metamaterials), the Poynting vector (S=E×H(W/m2), representing the energy flux) and the wave vector are anti-parallel. Figure 1-1 shows the four quadrants in the Re(ε)-Re(μ) plane into which we can conveniently classify electromagnetic (EM)
materials. The behavior of wave in each of the quadrants is qualitatively different: materials in the first quadrant allow usual right-handed (RH) propagating waves; materials in the second and fourth quadrants do not allow propagating waves inside them; and DNGs in the third quadrant allow “left-handed” (LH) propagating waves.
Metamaterials have recently received a considerable amount of academic attentions owing to their unusual EM properties and promising applications. In 1968, Veselago first introduced the term “left-handed materials (LHMs)” [2]. He suggested that in a medium which the permittivity ε and permeability μ are simultaneously negative, the
EM waves would propagate in a direction opposite to that of the energy. In this case, the electric field E, the magnetic field H, and the wave vector k form a left-handed
Figure 1-1 A schematic presentation of material classification based on the
dielectric and magnetic properties. The wavy lines in quadrants 1 and 3 represent that these materials allow propagating waves, the axes show the right- and left-handed nature of E, H, and k, and S is the Poynting vector. In quadrants 2 and 4, waves decay
exponentially inside the materials. The figure is imaged from [1].
coordinate system, so the name LHMs has been used to describe these materials. LHMs exhibit reversal of Doppler effects and Cerenkov radiation, and negative refractive index, which would enable some interesting applications such as flat lens focusing and super resolution optics, which breaks the diffraction limit [3].
A negative permittivity is not unusual, and occurs in any metal from zero to the plasma frequency. However, a large magnetic response, in general, and a negative permeability at optical frequency, in particular, does not occur in natural materials. Usual ferromagnetic and antiferromagnetic resonances tend to die out above GHz frequencies, thus one can safely assume that the magnetic permeability of optical materials is unity [4]. The interest in the Veselago’s work was renewed when Pendry
et al. proposed in 1999 an artificial material consisting of the so-called split-ring
resonators (SRRs), which respond strongly to an incident magnetic field resulting in negative permeability near the magnetic resonance frequency, and thin metallic wire,
which provide negative permittivity below the cutoff plasma frequency [5]. D. R. Smith et al. fabricated the first composite metamaterials (CMM) of SRRs and wires in
alternating layers operated at GHz frequencies (the microwave region) in 2000 [6]. Since then, various CMM samples were prepared and shown to exhibit a pass band in which it was assumed that ε and μ were both negative, indicating the existence of
media with a negative refractive index.
The realization of negative refractive index media made a great impact on the scientific community, and resulted in the discovery of various novel aspects of left-handed electromagnetism. Efforts are made through analytical modeling, numerical simulations, and experimental studies, especially on SRR to push the operating frequency of metamaterials into the THz region and ultimately to reach optical frequencies. Typically, the occurrence of a CMM pass band within the stop bands of the SRR and wire structures alone was taken as an evidence of the LH behavior. Later this has been proven not always being the case due to the fact that SRR exhibits both electric and magnetic response. Furthermore, there have been experimental verifications of the negative refractive index using Snell’s law [7, 8]. The transmission and reflection data can also be calculated using the transfer matrix method for a finite length of metamaterial which a retrieval procedure [9, 10, 11] could be applied to obtain the effective metamaterial parameters ε and μ, under an
assumption that it can be treated as homogeneous. Using these analytical expressions one is able to reproduce the low frequency transmission T and reflection R, characteristics of LHMs. Even the minor details in T and R observed in the simulations can be analytically explained. This procedure confirmed [12] that a medium composed of SRRs and wires could indeed be characterized by effective ε
and μ with negative real parts over a finite frequency band, and its refractive index
This thesis work is organized as follow: In Chapter 2, basic theories of the ring resonators are introduced. In Chapter 3, detailed design concepts of the nano-scaled ring resonators are indicated. In Chapter 4, fabrication process and results are presented. In Chapter 5, optical measurement process, data analysis and the spectral result are discussed. And in Chater6, a brief conclusion and future work is given.
Chapter 2
Theory of Metamaterials
Periodically arranged thin metallic wire structures on a sub-wavelength scale are shown to exhibit the plasma frequency ωp in the microwave regime, below which the
material is opaque [13] and the permittivity is considered to be negative.
Split-ring resonators (SRRs) are the main elements used to generate negative permeability. The original form of SRR proposed by Pendry et al. [5] consists of two
concentric rings separated by a gap, both of which have one split at the opposite sides as shown in Figure 2-1. As scaling down, single-ring SRRs are used instead of double-ring structures for ease of fabrication and reduction of the capacitance. Moreover, SRRs with two or four splits are designed for the sake of symmetric resonator to remove the electric coupling effect. Regardless of the changes in geometry, the SRRs remain a basic form. The key for SRR to exhibit magnetic resonance is the capacitance of the air gap and the inductance of the metallic loop.
In the following sections, we introduce magnetic and electric response of SRR and ways to identify these two responses. Higher order excitation modes of SRR are also shown. And then we discuss the properties of CMM as well as other possible structures generating negative μ or even n.
Figure 2-1 Plan view of a conventional double-ring SRR. The figure is imaged from
[5].
2.1 Magnetic Response of SRR
The magnetic response of SRR is typically considered a LC resonance with frequency 2 1 ) ( − = T T LC L C
ω , where LT is the total inductance formed by combination
of Lring, the self-inductance of the rectangular SRR loop, and Lmutual, the mutual
inductance formed between the conductive arms of neighboring SRR elements. An equation describing the self-inductance of a complete rectangular loop made from rectangular cross section wire is given by [14]:
H w w l w w w l w w Lring ) ) 2 ( ) 2 ( ) 2 2 1 ( sinh ) 2 ( 2 2 1 sinh 2 ( 2 . 0 1 1 2 2 0 − − + − × − + + − = μ − − (2.1)
while the equation for the mutual inductance of two parallel rectangular conductors is given by [15]: H l d l d d l d l Lmutual =0.2 (ln(1 + 1+ 22 )− 1+ 22 + )μ (2.2) where l is the length of the SRR element, w is the width of the wire forming the SRR, and d is the centre-to-centre separation between the arms of adjacent SRR elements.
take into account the parallel plate and co-planar capacitances formed by the gap in the SRR structure and between any two individual SRR elements. The parallel plate capacitance can be simply taken as
d A
C =ε0εr , while the general form of the equation for the co-planar capacitance per unit length for two metal strips of width p, separated by distance q, is given by [16]:
) ' 1 ' 1 2 ln( 1 2 ) 1 ( 0 k k C r cp − + + = π ε ε F/m (2.3)
where k’ is a geometrical factor given by: )2
2 ( 1 ' q p p k + − = .
2.1.1 Geometric Parameters and Tunable SRR
Since the magnetic response of SRR is due to the LC resonance, it is closely related to the geometry of the unit cell. To achieve a higher operating frequency, the total capacitance and inductance of a SRR array must be reduced. A straightforward way is to scale down the SRR unit size. Applying different designs or carefully tuning the geometric parameters may also result in desired higher operating frequencies. K. Aydin et al. found [17] that by engineering the structure design 1) to increase the split width, 2) to enlarge the gap distance between inner and outer rings, and 3) 50 reduce the metal line width of the rings, one would decrease the capacitance or inductance thus give rise to higher resonance frequencies, although the degree of tunability is very limit. In addition, five different resonator structures shown in Figure 2-2 together with a conventional SRR (see Figure 2-1) were studied. In both cases of single-ring and double-ring SRRs, the resonance frequency increases as the number of splits increases. This is because when a second split is placed on the ring, the capacitors are connected in series. Therefore, the total capacitance will decrease approximately by a factor of 2. Due to this great amount of reduction in capacitance of individual ring
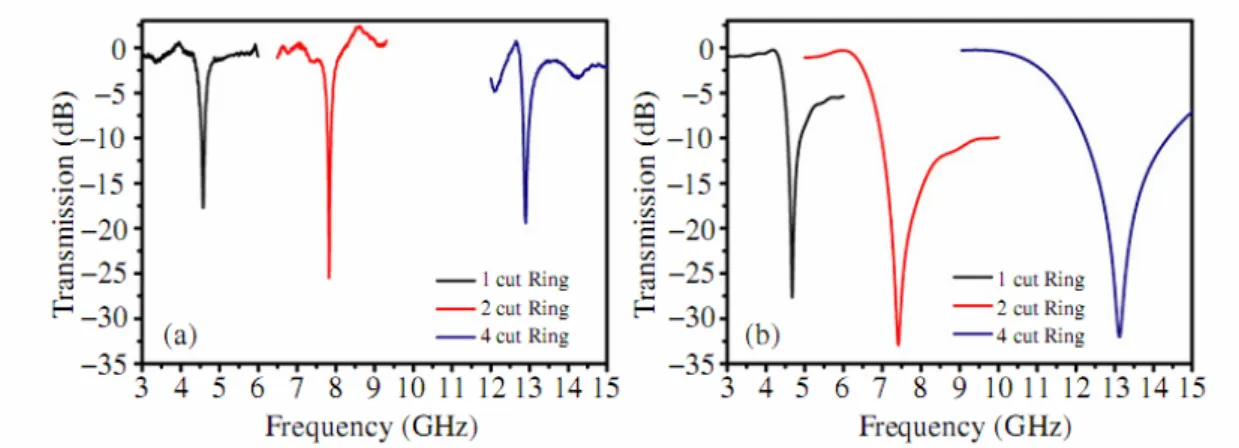
resonators, the change in resonance frequency is very large compared to the cases when altering split widths, gap distances and metal widths. Transmission spectra of single-ring SRRs with different numbers of cut are shown in Figure 2-3. Those of double-ring SRRs are not shown here because of the similarity. Note that the experiment was done by measurements of a single resonator, so a dip in the transmission spectrum was attributed to the resonant nature of SRR. Moreover, when increasing the split width, the rate of increase is larger for structures with more splits due to larger variations in capacitance, as depicted in Figure 2-4 (again, only for the single-ring case). The measured magnetic resonance frequencies for six different resonator structures are summarized in Table 2-1. It can be seen that for mm-scaled one-cut and two-cut resonator structures, the amount of decrease in ωm between
single-ring and double-ring SRRs is around 1 GHz. But in the case of a four-cut structure, such behavior is not observed because of its symmetric orientation. The mutual capacitance between inner and outer rings is very small due to the fact that the induced charges along both rings have the same sign and similar magnitude. As a result, addition of a second ring does not affect the overall capacitance of the four-cut single-ring resonator. In turn, the resonance frequency did not change appreciably.
Figure 2-2 Schematic drawings of different resonator structures: (a) single-ring with
one cut, (b) single-ring with two cuts, (c) single-ring with four cuts, (d) double-ring with two cuts, and (e) double-ring with four cuts. The figure is imaged from [17].
Figure 2-3 Transmission spectra of single-ring resonator with different number of
cuts obtained via (a) experiments and (b) simulations. The figure is imaged from [17].
Figure 2-4 Variation of magnetic resonance frequency with the split width for (a)
the one-cut, (b) two-cut, and (c) four-cut ring single-ring resonators. The figure is imaged from [17].
Table 2-1 Measured magnetic resonance frequencies (GHz) for six different
It has been shown that mounting additional capacitance is possible for making tunable SRRs [17, 18]. On the other hand, a study regarding the length of the side arms of SRR is discussed in section 2.2.4 together with higher order excitations [27].
2.1.2 Electric Coupling Effect and Anisotropic Nature of SRR
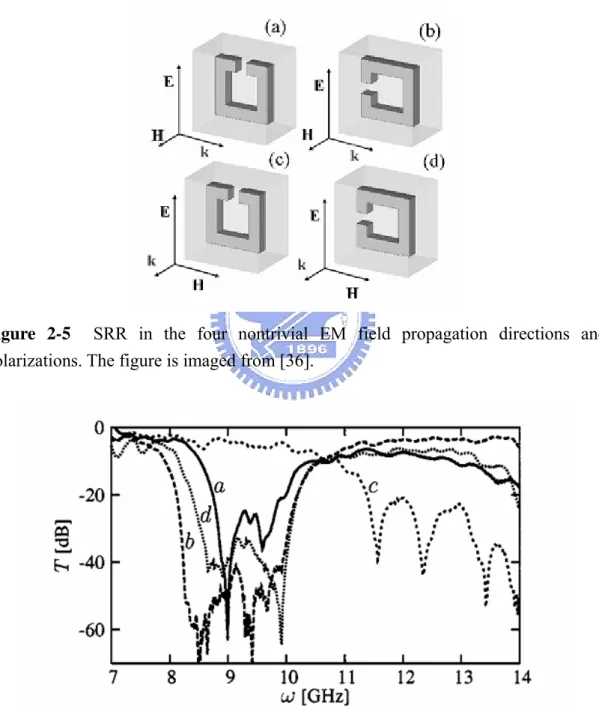
There are four nontrivial orientation and polarization combinations of SRRs with respect to the incident EM waves that are frequently used when studying the transmission properties of SRR, as shown in Figure 2-5. It was assumed that the SRR exhibits magnetic response only for the in-plane incidence, i.e. the external magnetic field is applied perpendicular to the pattern (Figure 2-5 (a), (b)). During the study of higher dimensional LHMs, N. Katsarakis et al. first discovered [19] that besides a magnetic field normal to the SRR the incident electric field E couples to the magnetic resonance of the SRR when the EM waves propagate perpendicular to the SRR plane and the incident E is parallel to the gap-bearing sides of the SRR (see Figure 2-5 (d)). The effect of this electric coupling is a resonance of ε near ωm. Figure 2-6 present the
transmission spectra of the SRR in four orientation and polarization combinations. It can be seen that a stop band exists in (d), which was thought to be magnetically inactive. Note that there is a broadening of the band gap in (b), which is also a result from EEMR (electric excitation coupling to the magnetic resonance). This broader band gap was not associated with a broader LH peak when the SRRs were combined with wires [20].The phenomenon can also be seen in the reflectance spectra in Figure 2-7, where the TE mode corresponds to (c) in Figure 2-5 and the TM mode corresponds to (d). The EEMR might degrade or even destroy the lift-handed properties of the metamaterial when the SRRs are combined with the wires, since it leads to lowering the effective plasma frequency and adds a RH transmission shoulder close to ω . However, it is very valuable for the experimental demonstration of the
magnetic resonance at optical frequencies, because of the difficulty in measuring the transmission and reflection with the incident EM wave parallel to the SRR plane at such frequencies
The origin of this effect is the asymmetric charge distribution (non-zero average electric polarization) in the SRR caused by the external electric field. Numerical simulations using the FDTD method were performed, which allowing visualization of the spatial distributions of the fields and currents inside the system. As shown in Figure 2-8, the SRR will experience different spatial distribution of the induced polarization, depending on the relative orientation of E with the SRR gap. If E is parallel to the no-gap sides of the SRR, its polarization will be symmetric and the polarization current is only flowing up and down the sides of the SRR, as revealed in Figure 2-8 (a). If the SRR is turned by 90° (see Figure 2-8 (b)), the broken symmetry leads to a different configuration of surface charges on both sides of the SRR, connected with a compensating current flowing between the sides. This current then also contributes to the magnetic resonance.
Marques considered the bianisotropy in SRR structures and developed an analytical model for evaluating the magnitude of cross-polarization effects [21]. It has been shown that symmetric SRRs, i.e. SRRs with two or four splits can be used to remove the electric coupling effect [22]. The problem arising from this kind of design is the difficulty of maintaining the capacitance of the single-gap ring, as the gaps act like capacitors in series, leading to a considerable lowering of the total capacitance and thus to an increase of ωm as discussed in the last section. This might be a disadvantage
as it decreases the possibility of ωm lying below the electric cut-off frequency of the
system. One solution to the problem could be decrease of the gap size, although in many cases, this method is limited by the presenting technology. Another solution could be the modification in the design, with the capacitance of the gaps being
increased. The result from such modification is usually a lowering of ωm but not
always an improvement in the transmission picture, as the strength of the magnetic resonance and the width of the μ<0 regime are affected as well. Two examples of symmetric SRR designs and its possible modified forms are shown in Figure 2-9.
Figure 2-5 SRR in the four nontrivial EM field propagation directions and
polarizations. The figure is imaged from [36].
Figure 2-6 Measured transmission spectra of a lattice of SRRs for the four different
Figure 2-7 Reflectance spectra for aluminum SRR sample showing experimental
and simulated TE and TM resonant peaks. The figure is imaged from [23].
Figure 2-8 Simple drawings for the polarization in two different orientations of a
single-ring SRR. The external electric field points upward. Only in case of broken symmetry (b) a circular will appear which excites the magnetic resonance of the SRR. The interior of the ring shows FDTD data for the polarization current component J//E
at a fixed time for normal incidence as a gray scale plot. The figure is imaged from [19].
Figure 2-9 Two examples of symmetric SRR designs (a) and (b), and the possible
modified forms (a’) and (b’), (b’’) with lowered magnetic resonance frequencies. The figure is imaged from [20].
2.2 Electric Response of SRR
SRRs have not only magnetic response, but also electric response that adds to the electric response of the wires causing the effective plasma frequency, ω’p, of the
composite medium shift to lower frequencies and differ substantially from that of the wire-only medium.
The SRR has electric response that appears at lower frequency than its magnetic response. This electric resonance is related to the plasma resonance in a thin continuous wire but shifted to nonzero frequency as a result of the additional depolarization field arising from the finite side length of the SRR. It is a collective property of the SRR array, which has a relatively low dependence on shape. At frequencies in the infrared part of the spectrum, it is also not strongly dependent on the particular metal used [23]. In fact, it is basically determined by the size of the SRR in the direction of the electric field [24]. To describe the plasma resonance of SRRs, a factor F is introduced, which is the area of exposed substrate in a unit cell, i.e. the total area of the unit cell minus the area covered by the metallic SRR. A modified equation for the reduced plasma frequency may then be written as:
2 2 2 2 2 ) ln( 2 eff p n F a a c ⋅ ⋅ ⋅ = π ω (rad s-1) (2.4)
where neff is the effective refractive index of the dielectric medium at the frequency of
the infrared radiation interacting with the SRR array. As the metal area of an individual SRR increases, F decreases for a fixed unit cell area, and then the plasma frequency also decreases.
Theoretically, it might be possible to achieve a LH transmission regime using only an array of SRRs by tuning the magnetic resonance into the negative permittivity band provided by its own electric ct-wire response [20].
2.2.1 Periodic and Disordered SRR Array
In previous work, EM responses were studied for either single or an array of SRR. The sensitivities of resonance frequency to the geometrical arrangement of SRRs were reported [25]. As shown in Figure 2-10 (a), up to four SRRs were placed along the x direction (propagation direction). The decreased transmission power was measured as the number of SRRs increased, while the resonance frequency remained essentially the same. The distance between the four SRRs was then tuned. Splitting of resonance was observed experimentally for short separation distance (d<λ/4) due to the quality factor Q suddenly explodes and the main resonance frequency shifts towards lower values and become narrower. When additional rows of SRRs are added along the z direction as depicted in Figure 2-10 (b) and (c), the resonance frequencies shifted to lower values and broaden. The frequency shift decreases when more SRR rows are added. Figure 2-11 shows the relation between scattering cross section (SCS) and frequency of the incident light with two different separation distances for 1, 2, and 3 rows of SRRs in Figure 2-10 (a)-(c). It depicts the three above mentioned phenomena clearly. The scattering cross section can be obtained by integrating the scattered field over a large sphere enclosing the system (typical radius100λ). In addition, no resonance splitting occurs when the SRRs are placed side by side in y direction even for extremely small separation (Figure 2-11 (d)). The sensitivity to the geometrical arrangement imposes constraints on the accuracy with which SRR arrays must be fabricated. On the other hand, it also offers the possibility to tune the structure and place the resonance frequency at a specific value. The resonance characteristics of a SRR array depend on the number of elements, which converge with about eight elements in each direction. This is important for the implementation of SRRs in a practical device with finite size.
Figure 2-10 Geometries considered for the study of interacting SRRs. (a) Two
SRRs in a row; (b) two SRRs rows; (c) three SRRs rows, and (d) two SRRs placed side by side. The figure is imaged from [25].
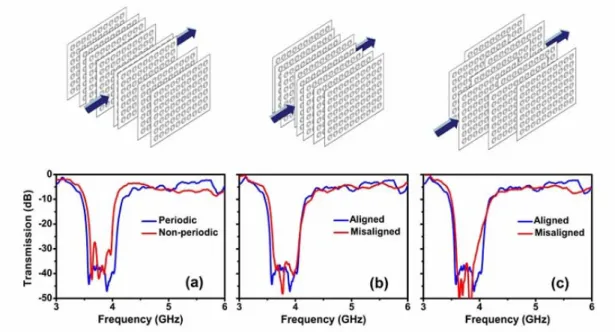
K. Aydin et al. investigated effects of a disordered SRR array on magnetic resonance in detail [26]. In the case of misalignments (inter-plane disorders), the SRRs within each plane are periodic in x and y directions, but the planes themselves are shifted arbitrarily in z (shown in Figure 2-12 (a) with a corresponding transmission spectrum) or x (shown in Figure 2-12 (b) and (c) with corresponding transmission spectrum, respectively) direction. By introducing randomness to the
Figure 2-11 Scattering cross section (SCS) computed for 1, 2, and 3 rows of SRRs
(Figure 2-10(a)-(c)). Two different separation distances d have been selected; the inter-row spacing is c=20mm. The figure is imaged from [25].
positions of SRRs along x and y directions within a plane, another type of disorder in SRR layers (intra-plane disorder) can be induced as shown in Figure 2-13 (a) and (b) with corresponding transmission spectra. By combining the inter-plane and intra-plane disorder, one can obtain a structure disordered in all three spatial directions. The transmission spectrum of such fully disordered SRR structure is shown in Figure 2-13 (d). The decreased transmission level and narrower pass band width due to reduced coupling in disordered SRR array may cause an impaired LH behavior of CMMs as presented in Figure 2-14. The dominant coupling occurs between consecutive SRRs along the propagation direction of the EM field, which depends strongly on the distance between any two adjacent SRRs along this direction. Thus, deviations from the periodic arrangement along the propagation direction have more impact on the properties of the negative permeability region.
Figure 2-12 Top panel: Schematic drawings of disordered split-ring resonator media
with (a) disorder in z direction with randomizing the inter-plane distance az ±δz
where δZ ≤λ 4, (b) disorder in x direction with misalignment parameter δx ≤λ 8, (c) increased disorder in x direction with parameter δx ≤λ 2. Bottom panel: Measured transmission spectra of periodic and ordered SRR medium (blue) and corresponding disordered split-ring resonator media (red). The figure is imaged from
[26]
Figure 2-13 Top panel: Schematic drawings of intra-plane disordered SRRs with (a)
9
a
r ≤
δK , (b) δKr ≤a 5where δKr is the randomness parameter. Bottom panel: Measured transmission spectra of ordered SRR (blue) and disordered SRR media (red), (c) Comparison of the transmission spectra for ordered and disordered SRRs where the disorder is in all 3 spatial directions. The figure is imaged from [26]
Figure 2-14 Measured transmission spectra of periodic and ordered SRR medium
(blue) and corresponding disordered split-ring resonator mediums (red). The figure is imaged from [26]
2.3 Identifying Magnetic Response of SRR
Since SRRs exhibit electric response in addition to magnetic response, identifying magnetic response from transmission spectra of SRR is thus very crucial and valuable in experimental studies. In practice, ε and μ. are difficult to be obtained simultaneously. Some transmission peaks were thought to be LH, but in fact originated with RH.
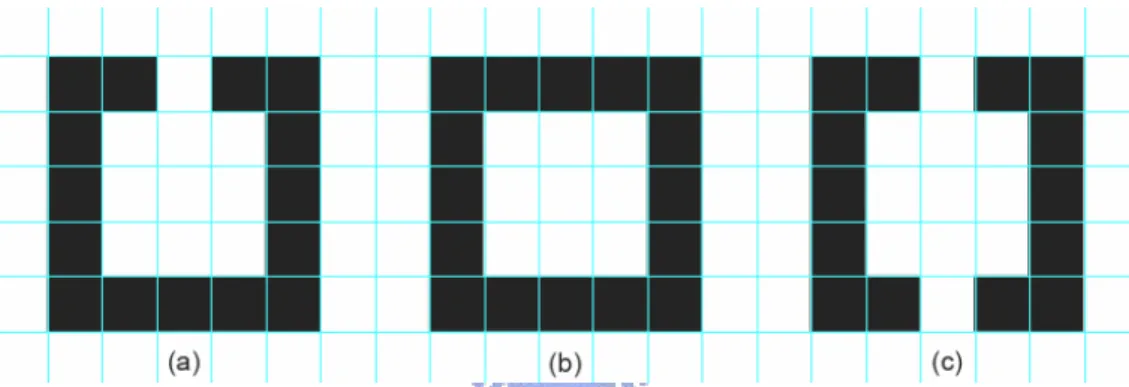
K. Aydin et al. provided four useful experimental methods, in order to identify the magnetic resonance of SRRs at the microwave frequency regime [13]. In their study, transmissions of two orientations of SRR with respect to the incident EM wave were measured. The schematic drawings of the two types of SRR (named SRR (A) and SRR (B) here) are depicted in Figure 2-15, corresponding to Figure 2-5 (a) and (b) respectively. Then the closed ring resonators (CRR) (Figure 2-16) were used to kill the magnetic resonance while retain the electric resonance. The transmission spectra of SRR (A), SRR (B), and CRR are presented in Figure 2-17 at two frequency ranges where the magnetic and electric response were expected to take place. Figure 2-17 (a) shows that the transmission dip caused by magnetic response disappeared in CRR while Figure 2-17 (b) demonstrates that its electric response retained. Note that the electrical resonance frequency for SRR (B) structure is observed at a lower frequency
Figure 2-15 Unit cell of split-ring resonators with split-axis along the (A) y
direction, (B) x direction. (k is along x direction, E is along y direction and H is along z direction.) The figure is imaged from [13]
Figure 2-16 Schematic drawing of unit cell of CRR. The figure is imaged from [17].
Figure 2-17 Measured transmission spectra of the unit cell of SRR (A), SRR (B),
and CRR structures at (a) 3-4 GHz and (b) 8-12 GHz. The figure is imaged from [13]
while electric resonance at same frequency for all structures is expected. This behavior is attributed to the orientation of the splits with respect to the electric field. Many other experimental studies [17, 22] also reported that closing the gap of the SRR can eliminate the capacitor of the SRR, and thus is an efficient way to destroy
the magnetic resonance. One can then identify the magnetic response of SRR by comparing the transmission spectrum to that of CRR.
2.4 Higher Order Excitation Modes of SRR
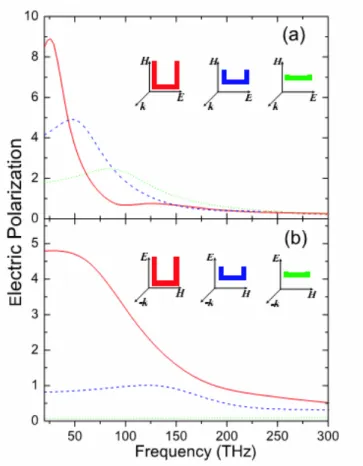
J. Zhou et al. studied numerical simulations of the higher order excitation modes of SRRs, and how the length of the side arms of SRR affects its EM response [27]. The geometrical parameters of a U-shaped SRR unit cell are indicated in Figure 2-18. First, as shown in Figure 2-19, the real part of effective ε and μ were extracted for three orientation and polarization combinations of SRR with respect to the incident EM waves, which represented pure magnetic resonance, EEMR (electric excitation coupling to the magnetic resonance), and short-wire like or electric resonance according (correspond to Figure 2-5 (a), (d) and (c), respectively). It can be seen that the EEMR had a resonance in ε at roughly the same frequency ωm=55 THz as the
magnetic resonance in μ. At a higher frequency, ω0=135 THz, the short-wire-like
electric resonance in ε occurred. Notice that when the lattice constant was comparable to the resonance wavelength (the EEMR in this case), a stronger distortion in negative part of resonance and a more significant anti-resonance could be observed due to the periodicity effect [12].
Figure 2-18 A U-shaped SRR unit cell with geometrical parameters. The figure is
Figure 2-19 Extracted real part of (a) effective permittivity Re(ε(ω)) and (b)
effective permeability Re(μ(ω)) for the magnetic resonance (red solid), the electric excitation coupling to the magnetic resonance (EEMR) (blue dashed) and the short-wire-like resonance (green dotted) of U-shaped gold SRRs. The geometric parameters are ax = ay = 1 μm, az = 0.2 μm, lx = ly =0.8 μm, w = 0.1 μm and t = 0.05
μm. The U-shaped SRR is described by the Drude model with plasma frequency fp = 2175 THz, and damping frequency fτ = 6.5THz. The figure is imaged from [27].
Secondly, higher excitation modes were presented for the EEMR and short-wire like resonance through both transmission spectra and extracted Re(ε), as shown in Figure 2-20. As a very crude picture we could imagine the resonance of the SRRs as charge density waves on a rod with the length equal to the arc length of the SRR. This rod supports plasmonic modes, which occur at discrete frequencies whenever there are current nodes at the ends of the rod. Considering that the current distribution is an essential tool for understanding the resonant modes of a SRR at higher THz frequencies while in the microwave region only the remnants of the resonant modes
Figure 2-20 (a), (b): Transmission spectra and (c), (d): the extracted Re(ε) of the
U-shaped SRRs response to the incident EM wave. The figure is imaged from [27].
Figure 2-21 Current distribution of the lowest 3 modes. (a) λ /2, 3λ /2, and 5λ /2
mode for the EEMR response; and (b) λ , 2λ , and 3λ mode for the short-wire-like response. Due to the nonzero response of lower order modes, nodes of higher order modes only reach zero at the positions of the lowest nodes. The figure is imaged from [27].
Figure 2-22 Magnitude of the normalized polarization density, P, of the U-shaped
SRRs with ly = 0.8 μm (red solid), 0.4 μm (blue dashed) and 0.11 μm (green dotted),
respectively. (a) Px component as E parallel to the bottom part of SRRs. While the
other two components Py and Pz are nearly zero (not shown in the figure). (b) Py
component as E parallel to the side part of SRRs, while the other two components Px
and Pz are again nearly zero (not shown in the figure). The figure is imaged from [27].
of the lowest order mode survive. However, it is of limited value due to a strong dependence of EM responses and plasmonic dispersion on the geometry which might be very different for SRRs from a rod. Simulations of the current distribution in Figure 2-21 revealed that the magnetic resonances are modes with odd number of half wavelength of the current density wave, i.e. λ/2, 3λ/2, and 5λ/2, while the electric resonances are modes with integer number of whole wavelength the current density wave, i.e. 1λ, 2λ, and 3λ. Note the non-uniform spacing of the nodes or higher orders are different from the straight rod and are due to the curvature of the SRR and the coupling to the bottom arm or side arms only.
Figure 2-23 (a) Magnitude of the normalized magnetization, Mz, and (b) the
extracted real part of permittivity, Re(ε ), of the U-shaped SRRs with the length ly =
0.8 μm (red solid), 0.4 μm (blue dashed) and 0.11 μm (green dotted), respectively. The short-wire-like resonance has zero magnetic moment (not shown in the figure). The figure is imaged from [27].
Finally, the electric polarizations of the EEMR (Figure 2-22 (a)), short-wire-like resonance (Figure 2-22 (b)), as well as the magnetism of the EEMR (Figure 2-23 (a)) of the U-shaped SRRs were calculated for the different length of side arms ly. In all
three cases, the polarization decreased and shifted to higher frequencies as ly
decreased. The EEMR response became weaker and eventually disappeared as ly
reduced to zero. However, Px did not vanish when ly=0 because the EEMR
degenerated to the short-wire-like resonance of the bottom arm of the SRR which resulted in non-zero electric polarization. In contrast, the magnetic moment of the magnetic resonance vanishes as the length of side arms of the SRR reduces to zero, i.e.
a rod does not give any magnetic moment or magnetic resonance. Figure 2-23 (b) shows that the magnitude of the resonance in Re(ε) decreases much slower than the magnetic moment dose as the arm length decreases. The reason is that the magnetic moment vanishes immediately as the side arms disappear, but the resonance in Re(ε) always exists as long as the short-wire-like electric resonance exists in the bottom part of the SRR.
2.5 Properties of CMM
M. Kafesaki et al. gave parametric studies of LHMs that aimed at optimum parameters for obtaining a true broad LH transmission band with large transmitted power [20]. The optimum position of the wires found in the study is at the back of the dielectric boards, just behind the cuts of the rings, while the distance of the wire to the SRR plane does not influence the LH peak very much. In fact, there are typically two arrangements of SRRs and wires when making CMMs. One is by stacking layers of SRRs and wires alternatively (off-plane), and another is by placing SRRs and wires side by side (in-plane). It is found that for in-plane CMMs, the left-handed transmission peak is much narrower and ω’p is higher than that for off-plane ones.
The reduction in ω’p suggests that there is a significant coupling between the electric
response of the wires and that of the SRRs in the off-plane case [24]. This makes the off-plane CMMs more preferable for obtaining LHMs. Nevertheless, the fabrication process could be complex, and an alignment problem might occur. In-plane and off-plane configurations of CMMs and comparison of their transmission spectra are shown in Figure 2-24.
The effective medium theory proposed by T. Koschny et al. gave analytical equations for the effective ε of wires and SRRs as well as for the effective μ of SRRs
are given [24]: ωγ ω ω ω ε i p wire eff = − 2 + 2 1 ) ( (2.5) ωγ ω ω ω ω ω μ i m m m SRR eff = − 2 − 2 + 2 2 ' 1 ) ( (2.6) ωγ ω ω ω ω ω ε i p SRR eff = − − 2 + 0 2 2 0 2 1 ) ( (2.7) The response of various components of a metamaterial of SRRs and wires to an EM field was presented in a compact schematic form as shown in Figure 2-25. This response is shown through the frequency dependence of the transmission coefficient (left panels), dielectric function (middle panels), and magnetic permeability (right panels). The first row shows the response of a periodic system of infinite wires. This response is analogous to that of a bulk metal, i.e. there is a cut-off frequency ωp above
which ε(ω) becomes positive from negative, and thus the system becomes “transparent” to the EM radiation. The system does not have any magnetic response. The second row shows the response of a system of cut-wires (with the wire length much shorter than the EM wavelength ), or CRRs. Different from the continuous wires, here the negative ε regime has also a lower edge ω0 ≠ 0, due to the finite nature
of the wires. The ε(ω) has the form shown in the middle graph. Again there is no magnetic response. The third row shows the response of a periodic system of (single-ring) SRRs. Their electric response is cut-wire-like (as in the second row) and their magnetic response has a resonance frequency at ωm where μ jumps from positive
to negative values. The transmission (left panel) becomes finite in the regions of positive product εμ, and goes to zero for negative εμ. The relative order of the characteristic frequencies (ωm, ωp, ω0) depends on the parameters of each specific
Figure 2-24 (A) In-plane and (B) off-plane configurations of CMMs. (b):
Transmission coefficient (T in dB) versus the dimensionless frequency for the structures shown in (a). The solid curve showed T for the configuration (A), i.e. wires next to the SRRs, and the dashed curve was for the configuration (B), i.e. wires at the back of the board. The board was a thin dielectric layer (thickness=a/14) of dielectric constant εb=12.3. The rest of the background material was air. The unit cell was a
cube, with the lattice constant a; the SRR had an outer side length of 9a/14 and other characteristic lengths were a/14. The wire has a cross-section at the H–k plane of
(a/14) × (a/14). The figure is imaged from [20].
(CRR). This system contains, in fact, all the electric response of the LHM, without its magnetic response. The combined electric response of combined wires and cut-wires has a new cut-off frequency, ω’p, which is much lower than ωp. The last row shows
the full response of the LHM. Its electric response is that of a system of wires plus cut-wires (the forth row), and its magnetic response is that of a periodic system of SRRs (the third row).
The most important issue aroused from combining SRRs and wires is the lowing of the effective cut-off frequency ω’p due to interaction between electric responses of
SRRs and wires. In some cases it is possible that ω’p is lower than ωm, and
transmission peaks appear at low frequencies would be RH rather than LH. A simple way to study the combined electric response of the LHMs is to close the gaps in the
Figure 2-25 Each row shows the response of one of five periodic systems to
electromagnetic wave. This response is shown through the frequency dependence of transmission coefficient (left panels), dielectric function (middle panels), and magnetic permeability (right panels). The figure is imaged from [24].
rings of the SRRs and kill the magnetic resonance without substantially affecting their electric response. This also gives an easy criterion to identify whether an experimental transmission peak is LH or RH: If closing the gaps of the SRRs in a given LHM structure removes the peak close to the position of the SRR dip from the T spectrum, this implies that the T peak is indeed left-handed.
Calculations of the transmission coefficient through the combined system of closed SRRs and wires showed that ω’p also increases, although it depends on the relative
position and distance of ωp and ω0 as well. The thickness of the wires has an effect
similar to that of the width on ω’p. On the other hand, both the width and thickness of
the SRR rings have almost no effect on ω’p. This is of great importance as the
thickness and width of the SRRs have considerable effects on ωm. Thus, since ωm is
controlled only by the SRRs while ω’p is controlled also by the wires, one may has
the ability to control the electric and magnetic response of the LHMs “independently”.
2.6 Other Structures Generating Negative
μ or n
To date, besides the early invented SRR, many different structures have been reported by several groups of researchers for achieving μ<0 such as the S-shaped [10], H-shaped [53], paired-rod [9] or double-wire [54], and π-shaped [55] structure. Among these works, the S-shaped SRR is able to yield negative ε and μ at the same frequency range and thus is worth mentioning here.
SRRs exhibit a frequency band of negative ε that is higher than that of negative μ, and they do not overlap in general. A previously purposed structure of two SRRs printed on the opposite sides of the substrate has been proven to avoid bianisotropy, and has the same magnetic effect as the conventional SRR structures. The geometry of this structure is shown in Figure 2-26 (a) and its Re(ε) and Re(μ) are plotted in Figure (b) and (c). One can clearly see that negative μ happens at a lower frequency range than that of negative ε, thus there is no overlap. The structure was constructed where the branches of a single SRR are shaped like a squared S and two SRRs were printed on each side of the substrate, yielding an eight-like pattern when viewed from
Figure 2-26 (a) is the simplified ring geometry as first building block toward S
structure. Metalization is applied on each side of the substrate, and the capacitances C enables current to flow around the ring under magnetic induction. (b) and (c) are the real parts of permittivity (dashed line, left axis) and permeability (solid line, right axis). Responses are the function of frequency for SRR structures and incidence, as shown in the insets. The figure is imaged from [28].
Figure 2-27 (a) is a schematic drawing of the S-shaped resonator. Note the
additional capacitance C1 when compared to Figure 2-28 (a). (b) and (c) are the real parts of permittivity (dashed line, left axis) and permeability (solid line, right axis). Responses are the function of frequency for S-shaped resonator structures and incidence, as shown in the insets. The figure is imaged from [28].
Figure 2-28 Equivalent circuit for the geometry shown in Figure 2-29 (a).
Capacitance C1 enables current to flow in each half ring when a magnetic field is applied. The figure is imaged from [28].
top (see Figure 2-27 (a)). Again, Re(ε) and Re(μ) are plotted. As can be seen from Figure 2-27 (b) and (c), the S-shaped resonator lowered the electric resonant frequency from 12 GHz to 11 GHz and increased the magnetic resonant frequency from 9 GHz to 15 GHz, and therefore made the two frequency bands overlap from 10.9 GHz to 13.5 GHz (i.e., about 2.6 GHz bandwidth). The losses (-1.75 dB/cm) are also proven to be significantly less than that of the standard split ring and rod designs (-6.53 dB/cm). An equivalent circuit is presented in Figure 2-28. Besides the two capacitances C between the top and bottom metallic strips, there is another capacitance C1 between the center metallic strips. With C1 being large and equal to C, the S-shaped resonator has a magnetic resonant frequency 3 times that of the SRR in Figure 2-26 (a), while exhibiting the same electric property. Yet the extra lengths of wire introduce an extra inductance, and the effect is to decrease the overall plasma frequency.
Chapter 3
Design of Nano-scaled SRR
LHMs were first realized at frequencies around 10 GHz (3 cm wavelength) and fabricated mostly on stacked printed circuit boards. These samples allowed a broad tunability of patterns and arrangements thus enabled investigation in several different properties. Then, microstructures with magnetic resonance frequencies at about 1 THz (300μm wavelength) were fabricated by microlithography. Using nanofabrication techniques, the LC resonance frequency could increase to about 100 THz (3 μm wavelength) [4], bringing optical frequencies into research for obtaining negative index of refraction.
Mean-field theoretical consideration indicates that the characteristic scale of SRRs should be at least tens or few hundred times smaller than the incident wavelength. In fact, previous studies have shown that by employing the SRR with a size 1/11th of the incident wavelength, magnetic resonance can be obtained [13]. Thus, SRRs are designed with a typical size that is about one tenth the wavelength of the desired operating frequency [23]. In the microwave region, the mm-scaled SRR cell is easily fabricated, but fabrication in the optical wavelength region is difficult since the SRR pattern must be shrunk to the nanometer scale.
This thesis work mainly focused on two aspects: (1) demonstrating the electric and magnetic responses of nano-scaled SRRs, which were previously done mostly for mm- or μm-scaled SRRs; (2) observing the scaling of the electric and magnetic
resonance frequency for nano-scaled SRRs. In the following sections, the design concepts of the nano-scaled SRR are presented in details.
3.1 Non-linear Scaling of SRR
Typically, SRR has a unit cell size that is 1/10th [23] to 1/11th [13] of the incident wavelength. However, as the operating frequency becomes higher and higher, non-linear scaling has been reported. Many approaches have been applied to study the physical reason and mechanism of this effect.
Ishikawa and T. Tanaka reported the effects of the surface resistivity and the internal reactance on the magnetic responses of the SRR by considering the delay of the current in the conductor [33]. The frequency dependence of the surface resistivity and internal reactance is depicted in Figure 3-1. As the frequency increases, both surface resistivity and internal reactance of the metals increase. The increase of the surface resistivity results in the decrease of the Q value of the SRR, and thereby, degrades the tunable range of the permeability μ. The increase of the internal reactance leads to the reduction of the SRR resonant frequency. The surface resistivity saturates at the inherent frequency of each metal about 10 THz. The saturation value of silver is remarkably smaller than those of gold and copper. The internal reactance, on the other hand, does not saturate and moves away from zero drastically as the frequency increases. As a result, in the optical frequency region, the effect of the internal reactance on the resonant frequency of the SRR was found to be more dominant than that of the surface resistivity. It can be seen in Figure 3-2 that as the geometric size of the SRR decreases, the magnetic response that is defined by the difference between maximum and minimum values of the effective μ decreases. And the resonant frequency shifts to a higher value. Note that the increase of the resonant
frequency is not linearly proportional to the sizes of the SRR due to the increase of the internal reactance.
Figure 3-1 Dispersion curves of the internal impedance of silver, gold, and copper.
In the frequency region exceeding THz, the internal reactance is more dominant than the surface resistivity, and this internal reactance decreases the resonant frequency. The figure is imaged from [33].
Figure 3-2 Real and imaginary parts of the effective permeability of the silver SRRs
as a function of the SRR pattern size. The labeling in each case indicates the unit-cell size a. The inset shows the corresponding sizes of the SRR in nanometers. The figure is imaged from [33].
Figure 3-3 Frequency dependencies of the minimum value of Re(μ) of the SRRs
made of (a) silver, (b) gold, and (c) copper, with the filling factor of F = 5%, 7%, 10%, and 13%, respectively. The frequency dependencies of the imaginary part of the effective permeability lRe whose real part has the minimum value are also shown. Only the silver SRR exhibits negative l in the visible range of 400–700 THz. The figure is imaged from [33].
The frequency dependence of the minimum value of Re(μ) of the SRR for three kinds of metals and four different filling factors were plotted in Figure 3-3. As the frequency increases, the minimum value of Re(μ) approaches unity asymptotically. Only the silver SRR exhibits negative Re(μ) in the visible light range, while the propagation loss of silver is higher than that of gold or copper. Note that the filling factor is also important for the realization of the negative μ in visible light range.
Further studies showed that above the linear scaling regime the resonance frequency saturates due to the free electron kinetic energy, which cannot be neglected any longer in comparison with the magnetic energy [34]. Although the presence of the magnetic resonance was reported to be observed with very small unit cells, such a weak resonance was unable to conduct negative values as Re(μ) approaches unity. The maximum resonance frequency (and thus the negative Re(μ) region) increases with the number of cuts in the SRR. The 4-cut SRR retains the negative Re(μ) region for higher frequencies up to about 550 THz. As a comparison, the 2- and 1-cut SRR could only reach up to 420 THz and 280 THz (unit cell size ~60 nm), respectively. The geometries of the 1-, 2-, and 4-cut single-ring SRR are schematically presented in Figure 3-4 (a). Note that the gap widths were designed to make the capacitance of the three types of SRR approximately the same, but the experimental result revealed that the three capacitances were indeed different. This is because the formula
d wt C ~ is not valid when d is not much smaller than w. Moreover, the periodic boundary
condition along the direction of the electric field only adds asymmetric side capacitances to the SRR, as which is represented by the equivalent circuit in Figure 3-4 (b). Therefore, the three types of SRR have inequivalent capacitances and thus different saturation frequencies. The scaling of the magnetic resonance frequency as a function of the unit cell size a is shown in Figure 3-5.
The electron kinetic energy adds an electron self-inductance Le to the magnetic
response which scales as 1/a while both the magnetic field inductance Lm and
capacitance C of the SRR scale as a. The resonance frequency fm thus has the
following a-dependence: 2 2 1 1 2 1 ) ( 1 2 1 c a c C L L f e m m + = + = π π (3.1) where c1 and c2 are independent of a. Other factors that break the linear scaling and
contribute to the increase of the Ohmic losses are (1) the increased scattering of electrons at the surface of the metal and (2) the larger skin depth (scales as
a
1
) over metal thickness ratio. Both factors depend in a complicated way on the geometry and the surface smoothness, and thus require further experimental studies.
Figure 3-4 (a) The geometries of the 1-, 2-, and 4-cut single-ring SRR. The SRR is
made of aluminum, simulated using Drude model (fp=3570 THz, fτ=19.4 THz). The
parameters of the SRR are side length l=0.914a, width and thickness w=t=0.257a, and
cut width d=0.2a, 0.1a, and 0.05a for the 1-, 2-, and 4-cut SRR, respectively. (b) The
left panel shows the charge accumulation in a 4-cut SRR, as a result of the periodic boundary conditions in the E (and H) direction. The right panel shows the equivalent LC circuit describing this SRR. Cg is the gap capacitance and Cs the side capacitance
resulting from the interaction with the neighboring SRR. The figure is imaged from [34].
Figure 3-5 Solid lines with symbols shows the scaling of the simulated magnetic
resonance frequency fm as a function of the size of the unit cell a for the 1-, 2-, and
4-cut SRR, respectively. Up to the lower THz region, the scaling is linear, fm∝ 1/a.
The maximum attainable frequency is strongly enhanced with the number of cuts in the SRR ring. The hollow symbols as well as the vertical line at 1/a =17.9 μm-1
indicate that no μ<0 is reached anymore. The nonsolid lines show the scaling of fm
calculated from Eq. 3.1 (LC circuit model). The figure is imaged from [34].
Despite the small line width that is theoretically required when scaling down the SRR, there are studies showing that the ratio of the effective sizes of the SRR to the wavelength of the incident beam is around 1, which suggests a wide scale independence [35]. This size tolerance is useful in realizing the metamaterials with negative n in the optical wavelength range.
In most experiments, the transmission is measured at a fixed incident angle for a certain range of wavelength. However, in [35], the incident angle was tuned while the wavelength was fixed by choosing different laser sources. Lasers with the output wavelength of 10.86 μm and 9.43 μm were used because the characteristic size of the SRR (10.48μm) was in between these two wavelengths. The transmission results were shown in Figure 3-6 (a) and (b). At 90° tile angle (in-plane incident) the transmission was expected to peak since the direct contribution of the incident beam to the detector
became dominant, as can be seen in the case of Al-coated planar Si (gray line). However, when the SRRs were patterned on the substrate, absorption at in-plane incident occurred (black line). Although the absorption of parallel polarization at 9.43 μm is less significant than that at 10.86 μm, it is still observable, showing a great size tolerance. The coherence of the laser may be critical to the onset of resonance. Moreover, an 808 nm laser was used to cross-check the rapid oscillation near the non-resonance region caused by the Fabry-Perot effect, as shown in Figure 3-6 (c). Here, neither the rapid oscillation nor the magnetic response appeared. The transmission through Si at wavelength below 1μm is extremely low due to high loss. And the incident wavelength is beyond size tolerance.
Figure 3-6 Normalized transmission of the SRRs. Data of the Al-coated planar Si is
presented for reference. The operating wavelength is (a) 10.86 μm, (b) 9.43 μm and (c) 808 nm, and the laser power on the sample is ~100mW. The figure is imaged from [35] and edited

![Figure 2-16 Schematic drawing of unit cell of CRR. The figure is imaged from [17].](https://thumb-ap.123doks.com/thumbv2/9libinfo/8132839.166315/32.892.159.746.444.879/figure-schematic-drawing-unit-cell-crr-figure-imaged.webp)
![Figure 2-18 A U-shaped SRR unit cell with geometrical parameters. The figure is imaged from [27]](https://thumb-ap.123doks.com/thumbv2/9libinfo/8132839.166315/33.892.354.555.857.1050/figure-shaped-srr-unit-geometrical-parameters-figure-imaged.webp)