行政院國家科學委員會專題研究計畫 成果報告
食品風險降低的消費者效益估計
計畫類別: 個別型計畫 計畫編號: NSC91-2415-H-002-012-SSS 執行期間: 91 年 08 月 01 日至 92 年 10 月 31 日 執行單位: 國立臺灣大學經濟學系暨研究所 計畫主持人: 劉錦添 報告類型: 精簡報告 處理方式: 本計畫可公開查詢中 華 民 國 93 年 1 月 7 日
行政院國家科學委員會補助專題研究計畫成果報告
食品安全的願付價值估計
計畫類別:個別型計畫
計畫編號:NSC 91-2415-H-002-012-SSS
執行期間:2002 年 8 月 1 日至 2003 年 10 月 31 日
計畫主持人:劉錦添
共同主持人:
計畫參與人員:
成果報告類型(依經費核定清單規定繳交):精簡報告
本成果報告包括以下應繳交之附件:
□赴國外出差或研習心得報告一份
□赴大陸地區出差或研習心得報告一份
□出席國際學術會議心得報告及發表之論文各一份
□國際合作研究計畫國外研究報告書一份
處理方式:除產學合作研究計畫、提升產業技術及人才培育研究
計畫、列管計畫及下列情形者外,得立即公開查詢
□涉及專利或其他智慧財產權,□一年□二年後可公開查詢
執行單位:國立台灣大學經濟學系
中 華 民 國 92 年 12 月 31 日
食品安全的願付價值估計
劉錦添
國立台灣大學經濟學系教授
國科會計畫 NSC 91-2415-H-002-012-SSS
執行期間:2002 年 8 月 1 日
至 2003 年 10 月 31 日
計畫中文摘要:
本研究的目的是利用假設性市場評價法(Contingent Valuation Method, CVM) 評估台灣民眾對兩種食品風險降低的願付價值(Willingness to Pay, WTP),這兩種 食品包括豬肉與海產。假設市場評價法係利用問卷調查方式,詢問民眾對假設性 商品在非市場交易之下,風險下降所願意支付的金額。願付價值係根據消費者的 理論,探討消費者心目中對健康風險與金錢之間的交換替代比率。研究中探討不 同食品風險例如豬肉與海產遭受細菌感染,消費者在面臨不同風險基礎機率、不 同罹病時間、不同罹病嚴重程度,及風險降低程度的大小之下的願付價值。願付 價值係採用雙界封閉式(Double Bounded Binary Choice)選擇法。願付價值之估計 結果大致上符合經濟理論的預期,而由願付價值所估計的疾病價值介於 1900 美 元至 1600 美元之間。本研究的結果可作為政府制定食品安全法規進行成本效益 評估的參考。
Abstract
The goal of the paper is to develop a contingent valuation method (CVM) for valuing reductions in food risk associated with bacterial pathogens and pesticide residuals. Values will be elicited using willingness to pay (WTP). WTP is based on economic theory of the consumer, and measures rates of substitution between money and health risk. It will be estimated using contingent valuation method, in which respondents are presented with a hypothetical good (e.g., the opportunity to reduce the probability of suffering a specified food-borne illness) and questioned about the amount of money they would trade in exchange for the good. WTP values are obtained for various reductions in food risks with differing baseline probability, duration and severity of symptoms, and magnitude of risk reduction. Estimated value of illness per care ranges between US$1900 to US$16000. From the policy standpoint it is essential to be able to establish appropriate values for the health outcomes in order assess the policy importance and the extent of the individual loss that has occurred. Understanding the benefit value will also further enable policymakers to identify the rationality of decision making.
一、前言 本研究係針對食品安全探討風險降低的經濟效益,研究成果可作為制定食品 安全政策的成本效益評估之基礎。研究中採用假設性市場評估法(Contingent Valuation Method;(CVM)),對台灣民眾食品購買行為、食品安全的資訊、以及 心目中食品風險降低的願付金額 (Willingness to Pay, WTP)。CVM 方法已廣泛應 用於環境品質的效益估計,近年來逐漸應用於健康領域,而在食品安全的評估上 亦有多篇應用。例如:Lin and Milon(1995)探討 toxins in shellfish;Crutchfield, Cooper and Hellerstein(1997)探討飲用水安全;Henson(1996)探討避免雞肉與雞蛋 含有沙門桿菌(Salmonella)的願付價值;Halbrendt et al (1995)探討消費者對避免豬 肉中含有 somatotropin(PST)的願付價值;Weaver, Evans and Luloff (1992)、Misra, Huang and Ott (1991)探討避免蔬果中農藥殘餘風險、有機蔬菜的願付價值。另外 類似有關降低農藥風險的蔬果願付價值研究包括 Buzby, Ready, and
Skees(1995),van Ravenswaay and Hoehn (1991)。Hammitt (1986, 1990, 1993)針對 foodborne risk 評估消費者對有機蔬果的偏好及其願付價值。Hammitt (1986)首先 探討美國加州民眾對有機蔬果的購買行為,及其願付價值,發現消費者對有機蔬 果的支付價格平均高出一般蔬果 45﹪。一般蔬果的癌症風險為 1.4×10⁻⁵,研究中 估計消費者每年對癌症風險價低一百萬之一的願付價值為$392 元。Rae(1987) 探討美國民眾對蔬菜中農藥殘餘風險降低的願付價值,以及購買有機蔬菜的認 知。他針對麻州 400 位民眾進行問卷調查,訪問地點是專門販賣有機蔬菜的超級 市場—Bread &Circus Stores。研究發現 73﹪的消費者在購買蔬菜食品時,農藥所 引發的健康風險是最重要的考慮,而 61﹪的民眾有購買有機食品的習慣,而購 買有機蔬菜的支出每個月多付 12-13 元左右。如果考慮交通額外成本,每個月多 付 27 至 31 元左右。Van Ravenswaay and Hoeh (1991)的研究則根據假設性市場交 易,在問卷中設計出三個不同性質的新鮮蔬菜,分別是完全沒有農藥殘餘,沒有 檢驗出農藥殘餘,以及沒有超過法規上限的殘餘,探討在假設性市場的蘋果需 求。研究發現民眾願意多付 37.5 美分來購買沒有農藥殘餘的蘋果。Fu, Liu and
Hammitt 利用相同的觀念,探討台灣民眾對蔬果(以大白菜為例)農藥風險降低 的願付價值,文中特別探討願付價值與風險認知、風險態度、風險降低程度之間 的關係。實證發現消費者的 WTP 和風險降低程度有明顯地關係,顯示在 WTP 估計時有範圍效果(scope effect)存在。 二、資料來源 本文係利用假設性市場評估進行問卷調查,瞭解大台北地區婦女對食品安全 的認知與願付價值。問卷調查期間係 2003 年 4 月中旬至 5 月下旬,訪問方式包 括直接面訪,以及郵寄後電話訪問兩種方式。全部成功樣本為 470 份,直接面訪 198 份,郵寄後再電話訪問有 272 份。 問卷共分成五種型態,每種問卷皆詢問兩種食品風險減輕的願付價值,其中 A 卷是豬肉與海產,疾病皆是輕微 (mild)程度;B 卷是海產與豬肉,疾病皆是嚴 重程度 (sever);C 卷是豬肉與海產,疾病分別是輕微與嚴重程度;D 卷是豬肉 與海產,疾病分別是嚴重與輕微程度;E 卷是豬肉與海產疾病分別是嚴重程度。 問卷中的輕微疾病的情況是「不小心吃到含有肉毒桿菌或大腸桿菌的豬肉或 海產,可能會<拉肚子、身體疲倦,但能仍從事正常活動>;至於嚴重的情況則 是<上吐下瀉、沒有食慾、發燒、身體會疲倦、整天躺在床上休息、無法上班或 從事日常活動(例如無法燒飯)>。 另外,問卷中亦針對中毒機率與症狀持續天數隨機設定不同的狀況,其中中 毒機率分別為 2/10,000 或 8/10,000;症狀持續天數為 1 天、3 天與 7 天。 問卷中金額詢問方式係採雙界封閉式選擇( Double-Bounded Binary-Choice) 之設定,每位受訪者隨機設定 3 種起價金額(每頓晚餐開銷多出新台幣 10 元, 或 40 元,或 100 元),如受訪者回答願意支付,則提高金額至(新台幣 20 元, 或 60 元,或 150 元);相反地,如受訪者回答不願意支付,則降低金額至(新台 幣 5 元,或 20 元,或 60 元)。 問卷中的豬肉與海產願付價值題目分別為:
「如果政府要求豬肉商嚴格遵守食品安全法規,飼養、屠宰製造過程有詳細的標 準程序與監督控制系統,可完全避免上述的危險,這些豬肉有明確的包裝顯示, 價錢也會比一般豬肉來的貴,但品質、口味和平時您買的豬肉完全相同。如果您 家每頓晚餐的豬肉開銷多出(設定)元,請問您願意購買這種有安全保證的豬肉 嗎?」 □ (1)願意,如果每頓晚餐多出(設定)元,那您是否願意購買? □ (1)願意 □ (2)不願意 □ (2)不願意,如果每頓晚餐多出(設定)元,那您是否願意購買? □ (1)願意 □ (2)不願意 「如果政府要求海產商嚴格遵守食品安全法規,捕魚、運送過程有詳細的標準冷 凍程序與監督控制系統,可完全避免上述的危險,這些海鮮有明確的包裝顯示, 價格也會比一般海產來得貴,但品質、口味和您平時買的海產完全相同。如果您 家每頓晚餐的海產開銷多出(設定)元。請問您願意購買這種有安全保證的海 產?」 □ (1)願意,如果每頓晚餐多出(設定)元,那您是否願意購買? □ (1)願意 □ (2)不願意 □ (2)不願意,如果每頓晚餐多出(設定)元,那您是否願意購買? □ (1)願意 □ (2)不願意 請問您家每頓晚餐最多願意付多少錢來購買這種海鮮?______元 三、實證模型 實證中,應變數為受訪者的願付金額 logWTP ,設定為疾病特徵與個人特徵的函i
數: logWTPi =Ziβ +Xiγ +ui (1) 式中,Z 為疾病特徵包括風險降低的幅度、罹病的天數(1 天,3 天或 7 天)i 、疾 病是輕微或嚴重,X 為個人的特徵包括家庭所得 log(family income)、年齡(Age)、i 婚 姻 狀 況 (Married) 、 教 育 程 度 是 否 為 大 學 以 上 (College) 、 是 否 為 本 省 籍 (Taiwanese)、家庭成員數(Family)、是否每餐皆有豬肉(Pork Daily)或海產(Seafood Daily)、有沒有慢性病(Chronic)、中毒時受否看醫生(Doctor)、每餐做飯前是否洗 手(Wash Hand)等變數。 利用最大概似法,概似函數設定為
{
}
1 log log log log n L n i i i i i i i WTP Z X WTP Z X L β γ β γ σ σ = − − − − = Φ − Φ ∑
(2) 其中,Φ •( )
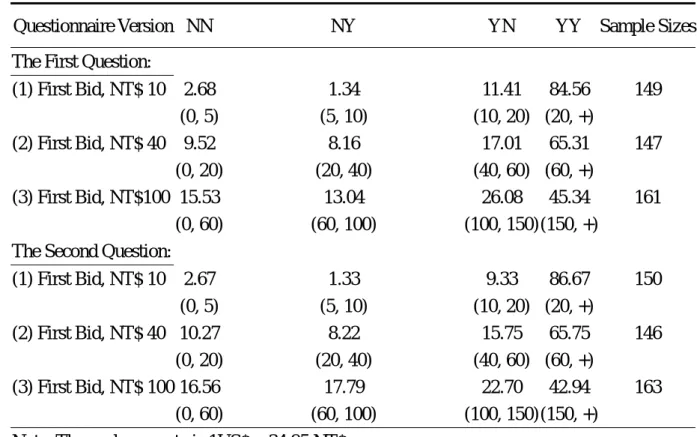
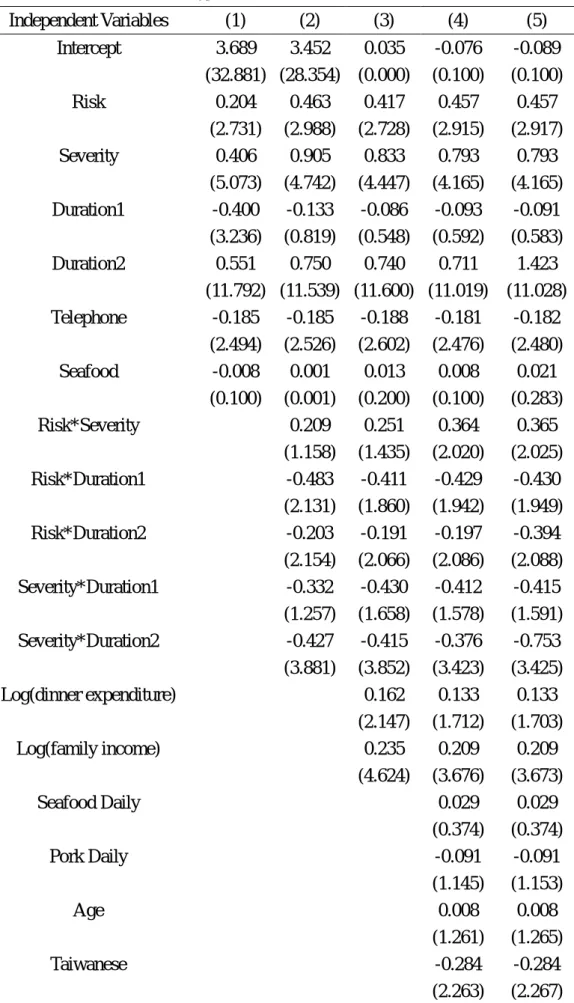
為標準常態累積分配函數。 表 1 為願付金額的統計分配,表中包括問卷中第一題與第二題。由於不同類 型的問卷中豬肉與海產兩種食品的題目順序互有調動,因此表 1 不列出個別食品 的願付金額。由表中可發現,隨著第一個設定金額的調高,連續兩次皆回答願意 支付(YY)的比率由起價點 10 元的 84.56﹪降至 100 元的 45.34﹪。 表 2 為合併第一題與第二題願付金額的迴歸估計結果。表中共有五種不同迴 歸設定,第(1)式為風險降低幅度較大虛擬變數(Risk);嚴重疾病虛擬變數 (Severity);罹病 1 天虛擬變數(Duration1)以及罹病 3 天虛擬變數(Duration2),對 照組是罹病 7 天;電話訪問虛擬變數(Telephone),對照組是面訪;問卷願付金額 是海產題目的虛擬變數(Seafood),對照組是豬肉。第 2 條迴歸式則增加 Risk 和 Severity;Risk 和 Duration1;Risk 和 Duration2; Severity 和 Duration1;Severity 和 Duration2 等變數的交叉項。第 3 條迴歸式則是 第(2)條迴歸式加家庭晚餐支出取自然對數,log(dinner expenditure),以及家庭每 月所得取自然對數,log(family income)兩個變數。
第 4 條迴歸式則是第(3)條迴歸的變數加上受訪者社會經濟變數,包括 Seafood Daily,Pork Daily,Age,Taiwanese,Family Member,Married,College Degree,Chronic,Doctor,以及 Wash Hand。最後一條迴歸式,則是第(4)條迴歸 增加是否是第一個問題的虛擬變數(First Question Dummy)以控制兩題願付金額 彼此之間的相關。 表 3 迴歸結果發現,風險降低幅度越大(Risk),以及疾病嚴重程度越大 (Severity),則受訪者對食品安全的願付價值越高,這兩個變數的 t 統計量皆顯著 地異於零,符合經濟理論預期。至於疾病時間長短,其中 Duration1 除了第(1)式 外,其他 4 條迴歸式皆不顯著地異於零,但 Duration2 變數則顯著地異於零,這 顯示受訪者對於生病 1 天與 3 天的願付價值在統計上並沒有差異,但生病 7 天則 有較高的願付價值。和 1 天比較,7 天的係數估計值介於 0.55 與 1.42 之間。 表中的疾病特徵交叉項,Risk*Duration1,Risk*Duration2,Severity*Duration2 在統計上有顯著地差異,這顯示不同的疾病特徵組合對受訪者的願付價值有顯著 地影響。 在社會經濟變數方面,其中最主要的兩個變數 log(dinner expenditure), log(family income),係數符號皆是正值符合理論預期,且統計上顯著地異於零。 表中願付價值的所得彈性大約是 0.2 左右,比一般文獻的估計值為小,Hammitt and Liu(2004)估計不同環境風險下降的願付價值,所得彈性為 0.61。表中統計上 較顯著的變數包括籍貫(Taiwanese),慢性病(Chronic),以及食物中毒是否去看醫 生(Doctor)三個變數。迴歸顯示慢性病患的受訪者心目中對食品安全的願付價值 較非慢性病患受訪者為低,係數為-0.229,而去看醫生的受訪者則較不看醫生的 受訪者為高,係數為 0.46 左右。 疾病的價值 我們根據表 2 的估計係數與 WTP 的估計值,可進一步計算在不同風險降低 幅度、疾病時間長短以及疾病嚴重程度的健康價值。根據上述三種疾病特徵,我
們共有 12 種不同的組合,估計結果列於表 3。表中,健康價值分別自 1,330 美元 至 16,847 美元(根據表 3 迴歸式(1)),或 1,034 美元至 16,455 美元(迴歸式(2)), 1,157 美元至 15,966 美元(迴歸式(3))。
表 1 兩題食品安全願付價值的統計分配
(WTP intervals in Parentheses)
Questionnaire Version NN NY YN YY Sample Sizes The First Question:
(1) First Bid, NT$ 10 2.68 1.34 11.41 84.56 149 (0, 5) (5, 10) (10, 20) (20, +) (2) First Bid, NT$ 40 9.52 8.16 17.01 65.31 147 (0, 20) (20, 40) (40, 60) (60, +) (3) First Bid, NT$100 15.53 13.04 26.08 45.34 161 (0, 60) (60, 100) (100, 150) (150, +)
The Second Question:
(1) First Bid, NT$ 10 2.67 1.33 9.33 86.67 150 (0, 5) (5, 10) (10, 20) (20, +) (2) First Bid, NT$ 40 10.27 8.22 15.75 65.75 146 (0, 20) (20, 40) (40, 60) (60, +) (3) First Bid, NT$ 100 16.56 17.79 22.70 42.94 163 (0, 60) (60, 100) (100, 150) (150, +) Note: The exchange rate is 1US$ = 34.95 NT$
表 2: 願付價值之迴歸估計 Independent Variables (1) (2) (3) (4) (5) Intercept 3.689 3.452 0.035 -0.076 -0.089 (32.881) (28.354) (0.000) (0.100) (0.100) Risk 0.204 0.463 0.417 0.457 0.457 (2.731) (2.988) (2.728) (2.915) (2.917) Severity 0.406 0.905 0.833 0.793 0.793 (5.073) (4.742) (4.447) (4.165) (4.165) Duration1 -0.400 -0.133 -0.086 -0.093 -0.091 (3.236) (0.819) (0.548) (0.592) (0.583) Duration2 0.551 0.750 0.740 0.711 1.423 (11.792) (11.539) (11.600) (11.019) (11.028) Telephone -0.185 -0.185 -0.188 -0.181 -0.182 (2.494) (2.526) (2.602) (2.476) (2.480) Seafood -0.008 0.001 0.013 0.008 0.021 (0.100) (0.001) (0.200) (0.100) (0.283) Risk*Severity 0.209 0.251 0.364 0.365 (1.158) (1.435) (2.020) (2.025) Risk*Duration1 -0.483 -0.411 -0.429 -0.430 (2.131) (1.860) (1.942) (1.949) Risk*Duration2 -0.203 -0.191 -0.197 -0.394 (2.154) (2.066) (2.086) (2.088) Severity*Duration1 -0.332 -0.430 -0.412 -0.415 (1.257) (1.658) (1.578) (1.591) Severity*Duration2 -0.427 -0.415 -0.376 -0.753 (3.881) (3.852) (3.423) (3.425) Log(dinner expenditure) 0.162 0.133 0.133 (2.147) (1.712) (1.703) Log(family income) 0.235 0.209 0.209 (4.624) (3.676) (3.673) Seafood Daily 0.029 0.029 (0.374) (0.374) Pork Daily -0.091 -0.091 (1.145) (1.153) Age 0.008 0.008 (1.261) (1.265) Taiwanese -0.284 -0.284 (2.263) (2.267)
表 2: 願付價值迴歸式之估計 Independent Variables (1) (2) (3) (4) (5) Family memers 0.018 0.018 (0.656) (0.656) Married 0.069 0.070 (0.583) (0.592) College Degree 0.150 0.150 (1.208) (1.208) Chronic -0.229 -0.229 (3.094) (3.097) Doctor 0.466 0.465 (2.943) (2.934) Wash Hand -0.057 -0.058 (0.812) (0.819) First Question Dummy 0.030
(0.387) 0.778 0.759 0.730 0.714 0.714 Log Likelihood -721.581 -710.051 -690.071 -676.827 -676.749 WTP median (NT$) 74.667 77.425 79.026 81.545 81.541 WTP standard error (NT$) 52.615 50.467 54.103 59.422 59.442 註:估計係數下,括弧內數值為 t 統計量。
σ
表 3 疾病的價值估計(US$)
疾病的特徵 由表(2)迴歸式
Risk Severity Dutation1 Duration2 (1) (2) (3) (4) (5)
0 0 0 0 6,470 4,819 5,015 5,375 3,194 0 0 1 0 4,337 4,219 4,602 4,898 2,916 0 0 0 1 11,225 10,203 10,511 10,944 13,254 0 1 0 0 9,710 11,913 11,536 11,879 7,059 0 1 0 1 16,847 16,455 15,966 16,606 13,795 1 0 0 0 1,984 1,914 1,902 2,122 1,261 1 0 0 1 3,441 3,308 3,294 3,548 3,529 1 1 0 0 2,977 5,832 5,625 6,750 4,015 1 1 0 1 5,165 6,575 6,431 7,748 5,291
註:risk=1 係指罹病機率為 8/10,000,=0 為 2/10,000;severity=1 係指症狀較嚴重,=0 係指症狀較輕微;duration1=1 係指症狀維持 3 天,duration2=1 係指症狀維持 7 天,對照組是症狀維持一天。
References
Alberini, Anna, Maureen Cropper, Tsu-Tan Fu, Alan Krupnick, Jin-Tan Liu, Daigee Shaw, and Winston Harrington (1996), “What is the Value of Reduced Morbidity in Taiwan?” in Robert Mendelsohn and Daigee Shaw eds., The Economics of Pollution Control in the Asia Pacific, U.K. Edward Elgar.
Antle, John M. (2001), “Economic Analysis of Food Safety,” in B. Gardner and G. Rausser eds, Handbook of Agricultural Economics, Elsevier Science B.V.
Arana, Jorge E. and Carmelo J. Leon (2002), “Willingness for Health Risk Reduction in the Context of Altruism,” Health Economics, 11, 623-635.
Buzby, Jean C., Richard C. Ready and Jerry R. Skees (1995), “Contingent Valuation in Food Policy Analysis: A Case Study of A Pesticide-Residue Risk Reduction,” Journal of Agriculture and Applied Economics, 27(2): 613-625.
Buzby, Jean C., John A. Fox, Richard C. Ready, and Stephen R. Crutchfield (1998),“Measuring Consumer Benefits of Food Safety Risk Reductions,” Journal of Agricultural and Applied Economics, 30(1): 69-82.
Carson, Richard T., Nicholas E. Flores and Norman F. Meade (2001), “ Contingent Valuation: Controversies and Evidence,” Environmental and Resource Economics, 19, 173-210.
Greene, William H.(1990) Econometric Analysis, New York: Macmillan Publishing Company.
Greene, William H. (1995) LIMDEP 7.0 User Manual. Bellport NY: Econometric Software
Hammitt, James K. and John Graham (1999), “Willingness to Pay for Health Protection: Inadequate Sensitivity to Probability,” Journal of Risk and Uncertainty, 18, 33-62.
Hammitt, James K., Jin-Tan Liu, and Wen-Ching Lin (2000), “Sensitivity of Willingness to Pay to the Mignitude of Risk Reduction: a Taiwan-United States Comparison,” Journal of Risk Research, 3(4), 305-320.
Hammitt, James K. and Jin-Tan Liu(2004), “Effects of Disease Type and Latency on the Value of Mortality Risk,” Journal of Risk and Uncertainty, 28(1), 73-95.
Hanemann, Michael, John Loomis, and Barbara Kanninen (1991), “Statistical Efficiency of Double-Bounded Dichotomous Choice Contingent Valuation,” American Journal of Agriculture Economics, 1255-1263.
Houtven, George L. Van, Matthew Rousu, Jui-Chen Yang, Charles Pringle, Wanda Wagstaff, Jason DePlatchett (2003), Valuation of Morbidity Losses:
Meta-Analysis of Willingness-to-Pay and Health Status Measures, Final Report, RTI, Health, Social, and Economics Research, Research Triangle Park.
Jordan, C.-T. and J. Walter Milon (1993), “Attribute and Safety Perceptions in a Double-Hurdle Model of Shellfish Consumption,” American Journal of Agricultural Economics, 75: 724-729.
Kartman, Bernt, Nils-Olov Stalhammar, and Magnus Johannesson (1997),
“Contingent Valuation with an Open-Ended Follow-up Question: A Test of Scope Effects,” Health Economics, 6, 637-639.
Lommis, John B. and Pierre H. duVair (1993), “Evaluating the Effect of Alternative Risk Communication Devices on Willingness to Pay: Results from a
Dichotomous Choice Contingent Valuation Experiment,” Land Economics, 69(3), 287-298.
Maddala, G. S. (1983), Limited-Dependent and Qualitative Variables in Econometrics, Cambridge: Cambridge University Press.
McDaniels, Timothy L., Mark S. Kamlet, and Gregory W. Fischer (1992), “Risk Perception and the Value of Safety,” Risk Analysis, 12(4), 495-503.
Misra, Sukant K. Chung L. Huang and Stephen L. Ott (1991), “Consumer Willingness to Pay for Pesticide-Free Fresh Produce,” Western Journal of Agricultural Economics, 16(2): 218-227.
National Oceanic and Atmospheric Administration (1994), “Natural Resource Damage Assessments: Proposed Rule,” Federal Register, 59CFR 1062 (January 7).
Savage, I. (1993). “An Empirical Investigation into the Effect of Psychological Perceptions on the Willingness-to-Pay to Reduce Risk,” Journal of Risk and Uncertainty, 6, 75-90.