行政院國家科學委員會專題研究計畫 成果報告
消費者對灰色市場產品的態度
計畫類別: 個別型計畫 計畫編號: NSC92-2416-H-009-002- 執行期間: 92 年 08 月 01 日至 93 年 07 月 31 日 執行單位: 國立交通大學管理科學學系 計畫主持人: 黃仁宏 計畫參與人員: 李建裕、林育如、董正枚 報告類型: 精簡報告 處理方式: 本計畫涉及專利或其他智慧財產權,1 年後可公開查詢中 華 民 國 93 年 11 月 4 日
行政院國家科學委員會專題研究計畫成果報告
消費者對灰色市場產品的態度
Consumer Attitude toward Gray Market Goods
計畫編號:NSC
92-2416-H-009-002-SSS執行期限:92 年 8 月 1 日至 93 年 7 月 31 日
主持人:黃仁宏 國立交通大學管理科學系
一、中文摘要 水貨已變成世界性的現象,不只發生 在開發中的市場,而且也發生在已成熟的 市場。雖然文獻對水貨的問題,已有所探 討,但都未從消費者的觀點研究。本研究 開發了衡量消費者對水貨態度的量表,並 探討影響消費者對水貨態度的前置變數。 分析結果顯示價格-品質的推斷和厭惡風 險對消費者的態度,有顯著的負面影響。 本文最後探討公司對水貨市場的策略。 關鍵詞:水貨市場、消費者態度 AbstractGray market activities have become global, occurring not only in less developed or volatile markets, but also in many
well-developed markets. Although the gray market problem has been discussed in the literature, pertinent research from a demand perspective remains scarce. This study establishes a valid measure of consumer attitude toward gray market goods and investigates the relationships between consumer attitude toward gray market goods and their antecedents. Data analysis reveals that both price-quality inference and risk averseness significantly and negatively affect consumer attitude toward gray market goods. Strategies for managers of international brands to address gray market problems are presented.
Keywords: Gray market, consumer attitude
二、目的
Managers of international brands must learn the necessary skills to promote their brands, and solve problems in international markets. Upsetting pricing stability, destroying marketing channels and damaging brand images are reported problems in gray markets, experienced by managers of international brands (Alberts, 1992; Cespedes, Corey, and Rangan, 1988). As defined by Bucklin (1993), "Gray market goods are genuinely branded merchandise distinguished only by their sale through channels unauthorized by the trademark owner." Since the 1980s, retail sales of gray market goods have been estimated at up to $10 billion per year in the USA (Alberts, 1992). For certain brands of watches and other fine merchandise, market shares of gray merchandise have been reported to be as high as 40% (Bucklin, 1993). According to Palia and Keown (1991), who surveyed U.S. companies that exported to Asia and had a sole agent there, 29% of these sole agents were experiencing problems of parallel distribution, 64% had problems of parallel imports’ being sold at a lower price and 77% had attempted to solve these problem without success. In a recent survey, Myers (1999) discovered that gray market activity has become global, occurring not only in less developed or volatile markets, but also in many well-developed markets. According to his survey of U.S. manufacturing exporters, almost 20% of respondents stated that their export ventures were strongly affected by the gray market. The evidence indicates that gray market problems have become ever more severe. Managers of international brands must be
prepared to address this issue to ensure success.
Since the gray market involves the diversion of goods from legitimate supply chains, most researchers have proposed combating strategies from a supply perspective. However, these strategies are hard to implement. First, given globalization, any proactive actions on the supply side will limit a brand manager’s marketing activities or have some negative impacts. For example, a “one-price-for-all” policy will reduce the brand’s profit margin and limit its market penetration (Howell, Britney, Kuzdrall, and Wilcox, 1986). Vertical integration is expensive and limits a brand manager’s channel strategies, while product differentiation increases production, promotion and other costs. Secondly, when the gray market appeared, authorized distributors were hurt and consumers obtained new reference prices. When authorized distributors can no longer provide additional value to consumers, brand managers cannot easily regain their market status through any reactive strategy. Finally, most gray market channel players are arbitragers who try to obtain short-term profits through price differentiation among countries (Chang, 1993; Palia and Keown, 1991). Managers of international brands have difficulty in finding arbitragers and stopping their activities in every channel and at each stage of the supply chain.
Some researchers have considered the legal aspects of these issues and tried to discover feasible solutions. However, within the existing legal climate, eliminating the gray market through legal activities in the US, Europe and Asia is almost impossible (Alberts, 1992; Chang, 1993; Gallini and Hollis, 1999; Prince, 2000).
One alternative that has not yet been considered is to address the gray market issue from a demand perspective, the perspective of the consumer. Understanding consumer attitude and thinking toward gray market goods may enable effective strategies for dealing with this problem to be discovered, given that consumers must choose between gray market and white market (authorized
channel) products. To the authors’ knowledge, research that addresses the gray market from the consumer’s perspective still does not exist. No valid scale for measuring consumer attitude toward gray market goods has been proposed.
The purpose of this study is to develop a scale on which to measure consumer attitude toward gray market goods and to examine factors that affect such attitude. Based on an analysis of empirical data, strategies using which managers of international brands can address gray market problems are proposed.
This study involves four parts. First, the relationships between consumer attitude toward gray market goods, its antecedents and its consequences, were examined. A conceptual model with four hypotheses was proposed. Second, a multi-item scale is developed to measure consumer attitude toward gray market goods. The procedure proposed by Churchill (1979) was used to construct valid measures. Third, the conceptual model was tested using the
structural equation modeling method. Finally, strategies using which managers of
international brands can address the gray market issues are provided.
三、文獻探討和假設
Development of Conceptual Model
Consumer attitude and intentions to purchase gray market goods, rather than purchasing behavior, are considered here. According to Fishbein’s extended model, known as the theory of reasoned action, behavior is determined by intentions, which are in turn determined by attitudes and subjective norms (Ajzen and Fishbein, 1980). The model represents an attempt to combine both individual level and interpersonal/group factors within a single paradigm. In the present study, however, the purchasing of gray market goods seems to be most determined by individual level factors, as claimed by Netemeyer (1992): “getting a good deal on a product would be viewed as a valued personal consequence.” Most behavioral models trace causal links from
attitude, through intention, to actual behavior, implying that behavioral intentions must be understood to predict behavior from attitudes (Kim and Hunter, 1993). The attitude- purchase intention link, which is internal and normally less susceptible to outside forces, is considered here, to reduce the effect of uncontrollable external factors (Kim and Hunter, 1993).
Consumer Attitude toward Gray Market
Goods and Its Correlates
"Attitude" means a learned predisposition to respond to an object in a consistently favorable or unfavorable way. It significantly plays an important role in consumer behavior. Attitudes cannot be observed directly, they are mental positions that marketers must try to infer through research measures (Wilkie, 1994). This article focuses on consumers’ attitude toward gray market goods in general, rather than any specific brand or specific product category. This work is thus consistent with that on the construction of measures that evaluate general consumer attitudes or tendencies (such as attitude toward advertising in general rather than toward a particular advertisement).
Although numerous causes of the gray market have been considered in the literature (Cespedes et al., 1988; Duhan and Sheffet, 1988; Palia and Keown, 1991), the main differences perceived by the consumer are the lower price and poorer guaranties (higher risk) of gray market. Normally, the products sold in the gray market are completely the same as those sold through authorized channels. Therefore, price and risk constructs are likely to be related to attitude toward gray market goods. Second, the literature on similar attitudes and their antecedents, such as attitude toward private label brands (Burton, Lichtenstein, Netemeyer, and Garretson, 1998), which have similar properties to those of gray market goods (lower price, limited guaranty from the retailer only), are considered. Third, 100 open-ended questionnaires were distributed to undergraduate students during marketing
classes to ascertain consumers’ direct associations with gray market goods. After they had read the definition of gray market goods, as given by Bucklin (1993), participants were asked to list their associations with them. Of the returned 81 respondents, 66% mentioned lower price, 81.9% mentioned quality concerns, 68.7% mentioned guaranties and risk, 9.9% mentioned legality. Consequently, three factors that might influence consumer’s attitude toward gray market goods were determined. They were price consciousness, price-quality inference, and risk averseness, which are discussed below.
Price Consciousness
Price plays an important role in affecting consumer behavior and has been studied extensively in the literature. Lichtenstein, Ridgway, and Netemeyer (1993) have examined seven price-related constructs and separated them according to their positive or negative effect on consumer purchasing behavior. According to Range Theory, people use the range of remembered price experiences to set lower and upper bounds on price expectations, such that the attractiveness of a market price is a function of its position within this range (Janiszewski and Lichtenstein, 1999). Reference price has been discussed as a factor that importantly affects a consumer’s purchasing behavior. After Adaptation-Level Theory was integrated into pricing theory, an internal reference price was presented as a degree of adaptation that depends on recent price experiences (Janiszewski and Lichtenstein, 1999). Rajendran and Tellis (1994) have found that within this context, the lowest price is an important cue for a reference price, whereas over time, the past prices of the actual brand seem to become the most important cue. The fact that consumers use the price in the authorized channel as a reference price is plausible, and so the gray market would take advantage of lower price to attract consumers' interest. Most researchers claim that price difference is an important factor when purchasing from the
gray market (Bucklin, 1993; Cavusgil and Sikora, 1988; Cespedes et al., 1988; Chang, 1993; Duhan and Sheffet, 1988; Lowe and McCrohan, 1989; Weigand, 1991). Palia and Keown (1991) surveyed U.S. exporters, and found that 64% of parallel imports were selling at a lower price. When the gray market sells simultaneously alongside an authorized channel, consumers with a higher price consciousness may prefer to select goods sold at the lower price in the gray market.
H1: Consumers’ price consciousness
positively affects consumers’ preference for gray market goods.
Price-Quality Inference
The belief in price-quality inference, "high price, high quality" and "low price, low quality", is important in pricing theory and in determining consumer behavior. According to the price-expectancy model of consumer choice, consumers evaluate products by comparing actual price with a referential or expected price determined from product quality and price-quality correlation of the product category (Ordonez, 1998). Ordonez's (1998) research supported the price-expectancy model and suggested that the relative preference for higher price/higher quality products over lower price/lower quality products increased as the subjective correlation between price and quality increased. Tellis and Gaeth (1990) examined the impact of information on consumers’ choice strategies. They found that when information on product quality is imperfect, the price-quality correlation is an important moderating factor that influences consumers’ behavior. According to Monroe and Krishnan’s (1985) price-perceived quality model and Chapman and Wahlers’ (1999) extended model, price positively affected perceived quality. For durable goods, Brucks, Zeithaml, and Naylor (2000) found that quality has six dimensions, ease of use,
versatility, durability, serviceability,
performance and prestige. Price influences consumers’ judgments of quality to various extents on the quality dimensions. Some
experimental research, however, did not support the price-quality inference. Sjolander (1992) used ice cream to test the effects of price on perceived product quality. The results did not significant support a direct link between the price cue and consumers' perceptions of quality. In a study performed to test the effect of store name, brand name and price discounts on consumers' evaluations and purchase intentions, Grewal (1998) demonstrated that the effect of price discounts on a brand's perceived quality was minimal.
Given that most gray market goods are sold at lower prices, the more a consumer maintains the price-quality inference, the lower the consumer’s perceived quality of gray market goods. Hence, price-quality inference is expected negatively to affect consumer attitude toward gray market goods. H2: A consumer who more strongly
maintains the price-quality inference has a more negative attitude toward gray market goods.
Risk Averseness
“Risk” in relation to choosing brands is the probability of occurrence of a problem with a particular product of a certain brand multiplied by the negative consequences of that problem (Peter and Ryan, 1976). When a consumer makes a purchase decision, “risk” implies “greater consequences of making a mistake” and “degree of inconvenience of making a mistake” (Batra and Sinha, 2000). Havlena and DeSarbo (1991) described the multidimensional nature of perceived consumer risk, involving performance, financial, safety, social, psychological, and time/opportunity dimensions. The perceived risk can powerfully influence consumer behavior. Mitchell (1992) argued that perceived risk influences the five stages of the consumer decision process, which are problem recognition, pre-purchase information search, evaluation of alternative, purchase decision and post-purchase behavior.
Consumers face two main risks when purchasing gray market goods. First, the gray
market increases the opportunity for the entry of black-market goods, also known as counterfeit goods (Lowe and McCrohan, 1989). Consumers who purchase goods from the gray market must risk a higher probability of purchasing counterfeit products and suffering various types of risk, including performance, financial, safety, social, psychological, and time/opportunity risk. The second risk arises in the post-purchase stage, including loss of warranty and service from the legitimate distributor. Some brand managers have asked their authorized distributors not to provide services at all or increase service charges to gray market goods, substantially raising consumers' risk and cost to prevent gray marketers’ free-ride. Hence, consumers’ risk averseness affects their attitudes toward gray market goods.
H3: Consumer’s risk averseness negatively affects consumer attitude toward gray market goods.
Consumer ethics may be argued to be worthy of consideration. Consumer ethics have been defined as, “the moral principle and standards that guide behavior of individuals or groups as they obtain, use and dispose of goods and service” (Muncy and Vitell, 1992). However, purchasing gray market goods seems not to violate or nearly violate any ethical standards of consumers (Muncy and Vitell, 1992). Since in the gray market, consumers legally purchase preferred branded product from a retailer they like, they do not typically feel that their behavior harms someone else, or that it is in any way unethical (Vitell and Muncy, 1992). Mathur (1995) considered the relationship between marketing ethics and the gray market, but from the perspective of the supplier, which is not considered here.
Purchase Intentions
The relationship between attitude and behavioral intentions has been examined. Two meta-analyses, with combined samples of over 10,000 participants, support the strong attitude-intention-behavior linkage (Kim and Hunter, 1993; Sheppard, Hartwick,
and Warshaw, 1988). Additionally, Armstrong, Morwitz, and Kumar (2000) stated that purchase intentions could provide better forecasts than a simple extrapolation from past sales trends. Berger, Ratchford and Haines (1994) recommended that managers’ efforts should be focused on altering consumer attitudes before guiding their behavioral decisions.
Product-class involvement represents the average interest a consumer has in a product category on a daily basis (Wilkie, 1994; Zaichkowsky, 1985), which might be a variable that importantly moderates consumers’ purchase intentions. For products with a lower consumer involvement, consumers tend to purchase impulsively, regardless of their original attitude toward the product attributes. In contrast, for products with a higher consumer involvement, consumers would spend more energy on consumption-related activities, and hence make more rational decisions. In such situations, consumers who have a more favorable attitude toward gray market goods would have stronger purchase intentions, and would be more likely to purchase gray market goods.
H4: For products with a higher consumer involvement, consumer's attitude and purchase intention toward gray market goods are positively related.
Conceptual Model
Based on the foregoing, Figure 1 presents a conceptual model.
Take in Figure 1. 四、研究方法
Measurement and Selecting Products
The procedure proposed by Churchill (1979) was applied to develop a scale to measure consumer attitude toward gray market goods. Once data were collected, the coefficient alpha, the item-to-total correlation and the exploratory and confirmatory factor analyses proposed by Churchill (1979),
Fornell and Larcker (1981), Gerbing and Anderson (1988), and Tian, Bearden, and Hunter (2001) were used to screen and purify the measurement items. The following section provides further details. Appendix A presents the final attitude scale, along with price consciousness, price-quality inference, risk averseness and purchase intention.
The price consciousness and price-quality inference construct measures were taken from Lichtenstein et al. (1993), while risk averseness construct measures were drawn from Burton et al. (1998). With regard to the purchase intention construct, a three-item measurement scale developed by Dodds (1991) and applied by Grewal (1998) was used. All of the above constructs and items were measured using 7-point Likert-type scales.
The products used to test the hypotheses must meet some criteria. First, the products must appear frequently in the gray market. Second, the products must be used by everyone, not specific people (so a perfume used by females is inappropriate). Third, the products must be associated with various levels of consumer involvement - high, middle and low. Three popular gray market goods in Taiwan were chosen, including beverages, watches, and mobile phones. The scale created by Zaichkowsky (1985) and revised by McQuarrie and Munson (1991) was applied in pretests to measure their levels of product-class consumer involvement. A total of 120 undergraduate students were asked to participate in the test during marketing classes. Each student was randomly assigned to one of three groups and asked to answer questionnaires designed to measure the product involvement of beverages, watches, and mobile phones. A total of 107 questionnaires were completed, representing a return rate of 89.2%, including 36 respondents in the beverage group, 34 in the watch group and 37 in the mobile ‘phone group. The mean scores of product involvement for beverages, watches, and mobile phones were 39.3, 47.5 and 52.9 respectively. The involvement score for beverages was lower than that for watches (t=-3.03), and that for watches was lower
than that for mobile ‘phones (t=-2.88). The scores are thus significantly different at the α=0.05 level. These three products involve relatively low, middle and high involvement on the part of consumers.
Developing Scales of Consumer Attitude toward Gray Market Goods
The first stage of the survey was conducted to develop scales of consumer attitude toward gray market goods. A clear definition and description of gray market goods following Bucklin (1993) was used to specify the domain of gray market goods. Similar scales of attitude measure in the literature were reviewed and modified to develop the initial items pool (e.g., consumer attitude toward private label brand, consumer attitude toward foreign goods). Consequently, an initial item pool of 12 measurement items was obtained. A convenient sample of 200 adults who joined marketing course at night school were invited to participate in the survey. A total of 156 questionnaires were completed and returned, representing a response rate of 78%. Of the respondents, 37.4% were male, and had an average age of 26.3 years. An exploratory factor analysis was used to filter the 12 initial measurement items and one factor model was suggested by a scree plot. After items with a factor loading below 0.6 were deleted (Sharma, 1996), six items were kept.
Churchill (1979) suggested that the developing procedure of measure should be repeated until satisfactory results were achieved. Although the first-stage of the survey led to the single component model of attitude, the possibility of the multidimensionality of attitude was kept open. A focus group discussion, as proposed by Churchill (1979), was then used to generate additional items to cover the entire breadth of attitudes. Ten undergraduate students participated in the discussion and provided various descriptions of gray market goods. After overlapping and similar items of the six items maintained in first stage of the survey were deleted, seven more items were selected. A total of 13 items were used in the
second stage of the survey.
In the second stage of the survey, 210 questionnaires, including all 13 items, were distributed to working adults who were pursuing Bachelors’ degrees at night schools in Northern Taiwan; 176 questionnaires were completed and returned, representing a response rate of 84%. Of the respondents, 40% were male and 60% were female, 26.4% were married and 73.6% were single; they had a mean age of 27.8 years old, and a mean personal income of NT$ 430,000 per year. Using principal component analysis, two factors were extracted from the 13 items, with eigenvalues of 7.1 and 1.2 respectively. However, a scree plot strongly supported a single component model. Items with a loading of under 0.6 were deleted (Sharma, 1996), leaving six items; one of them was a negative statement. A second principal component analysis was performed on the remaining six items; only one component was extracted, explaining 58% of total variance. The item-to-total correlations range from 0.45 to 0.77, and the Cronbach α of the six items is 0.85, supporting the internal consistency of the measure (Nunnally and Bernstein, 1994).
A confirmatory factor analysis was then performed using LISREL Ⅷ on data on another sample to confirm further the one-component model of attitude (Gerbing and Anderson, 1988). A total of 250 questionnaires that included six attitude scales were distributed to working adults who were pursuing Bachelors’ degrees at night school. The respondents in the sample differed from those in the previous surveys. Overall, 233 questionnaires were completed and returned, representing a 93% return rate. Of the respondents, 39% were males, 61% were females; the average age was 27.1 years old, and the mean personal income was $NT 405,000. Statistics concerning the data fit
(χ2 =7.96, d.f.=9, P=0.54, GFI=0.99, AGFI
= 0.97) support the one-component model. Estimated Lambdas and t-values indicate that each item contributes significantly to the measure (t-values range from 7.06 to 12.89). Hence, this one component model that includes six measurement items is used in
further analysis.
Since the gray market implies intra-brand competition (Bucklin, 1993), purchasing gray market goods is a very specific activity (choice within a specific brand). Sheth (1991) classified market choice behavior into three levels or types – 1. the choice to buy or not to buy; 2. the choice of product type, and 3. the choice of brand. The purchasing of gray market goods is likely to fall in a level below the third level (Bergen, Heide, and Dutta, 1998; Bucklin, 1993). Additionally, much experimental research has led to a unidimensional measure of attitude (Burton et al., 1998; Donthu, 1992), so the proposed unidimensional measure of attitude used here should be acceptable.
Model Test
The model tests used data from the second-stage survey, which included price consciousness, price-quality inference, risk averseness, and purchase intentions of gray market goods for the three selected products. At the end of the questionnaire, demographic data including gender, age, income, and marriage status were elicited, and a question was asked concerning whether the consumer had ever knowingly purchased gray market goods.
五、結果
Reliability
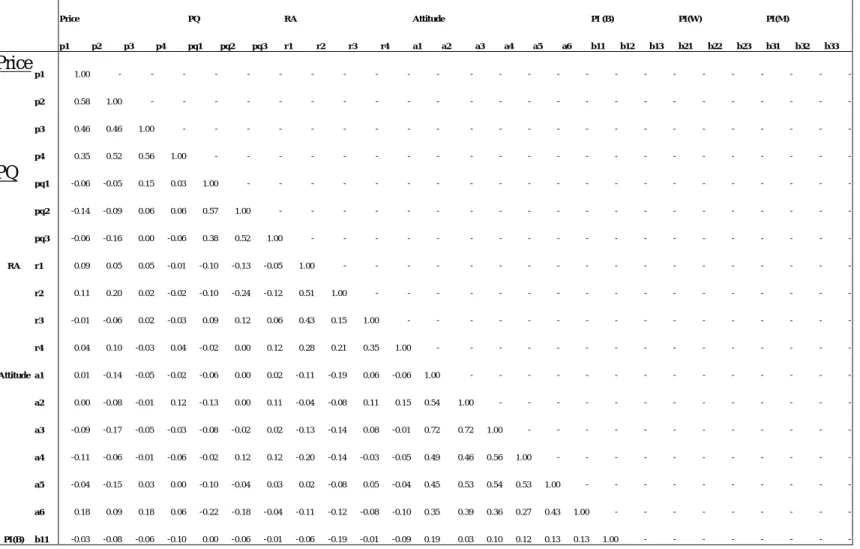
Table Ⅰ lists correlation matrix of all variables. In the correlation matrix, correlation coefficients between variables that belong to the same constructs are clearly higher than others, suggesting the internal consistency of multi-item measures.
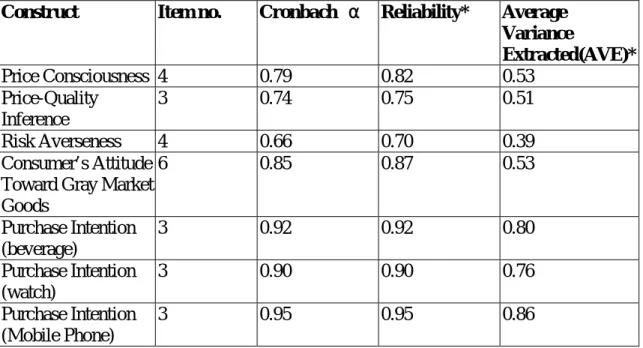
A formula proposed by Fornell and Larcker (1981) was applied to determine the reliability and the average variances extracted (AVE) to examine the reliability and validity of the measures. Table Ⅱ summarizes all the properties of the constructs. The Cronbach alpha values indicate that most measures have good internal consistency with α values above 0.7 (Nunnally and Bernstein,
1994); the only exception is the measure of risk averseness (α=0.66), which meets the minimal acceptable level of 0.65, as suggested by DeVellis (1991). The reliabilities of the measures of the constructs, ranging from 0.70 to 0.95, were good.
Validity
All the measured items are grouped together to run an exploratory factor analysis to verify the dimensionalities of measured constructs (Gerbing and Anderson, 1988). Seven factors with eigenvalues greater than one were extracted, representing three causal constructs (price consciousness, price-quality inference and risk averseness), the consumer attitude construct, and purchase intentions toward beverages, watches, and the mobile phones. High factor loadings appeared only between each construct and its indicating items after rotation, supporting the construct validity. For convergent validity, the last column of Table Ⅱ shows that most measures meet Fornell and Larcker’s (1981) criterion (AVE>0.5). Since it’s a more conservative criterion, we further examined the pattern of Lambda and t-values of the measures. All of the t-values that correspond to the measuring items of constructs are significant at p<0.01 level, and patterns of Lambdas also support convergent validity (Gerbing and Anderson, 1988). For discriminant validity, all of the AVE values listed in Table Ⅱ exceeded the squared correlations between constructs (Table Ⅱ , Ⅲ), supporting discriminant validity (Fornell and Larcker, 1981).
For criterion validity, consumers who had knowingly purchased gray market goods should have a more positive attitude toward gray market goods than others. Respondents were grouped according to whether they had knowingly purchased gray market goods. Then, one-way ANOVA was used to test the difference of attitude score. A total of 59.5% of respondents reported that they had experience of knowingly purchasing gray market goods, with a mean attitude score of 23.85; others did not and had a mean attitude score of 19.07. The attitude scores of the
consumers in the group who had purchased gray market goods are significantly higher than those of the other group, and it’s significant at α =0.01 level (F=19.03, P=0.00), supporting the known-group validity (Tian et al., 2001).
Take in Table Ⅰ
Take in Table Ⅱ
Estimation of Structure Coefficients
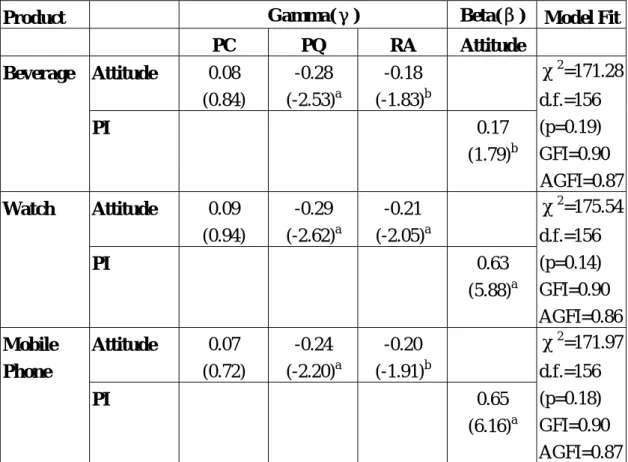
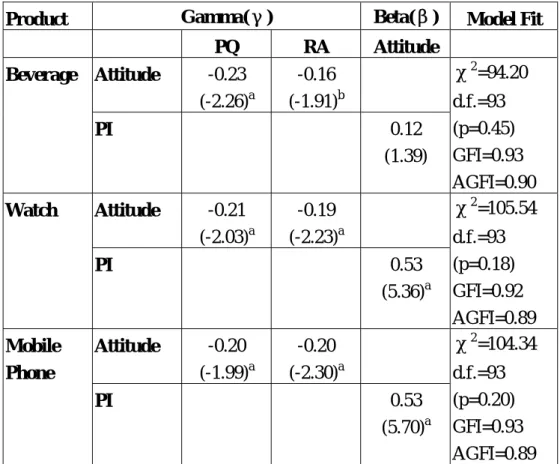
Model parameters were estimated separately using the LISREL Ⅷ program to test the proposed conceptual model across three product categories (beverages, watches and mobile ‘phones). TableⅢ presents the results. The fit statistics of each model meet acceptable levels (GFI=0.90, AGFI=0.86 or above). The effect of price consciousness on consumer attitude toward gray market goods is not significant at α=0.05 level, indicating that H1 is not supported. Since the effect of price consciousness on consumer attitude is insignificant across three product categories, the price consciousness construct was removed from the full model to yield a reduced model, the results of which are presented in TableⅣ. Fit statistics of each reduced model are favorable (GFI=0.92 or above, AGFI=0.89 or above).
The price-quality inference negatively and significantly affects consumer attitude at the α =0.05 level, indicating that H2 is strongly supported. A consumer that believes more strongly in the price-quality inference has a more negative attitude toward gray market goods. Risk averseness negatively and significantly affects consumer attitudes, implying that H3 is also supported. Finally, consumer attitude is expected to affect positively purchase intentions of gray market goods that have higher consumer involvement. From the estimated β values in TableⅣ, the effect of consumer attitude on purchase intentions of beverages is not significant. However, the positive influence of consumer attitude on purchase intentions
of watches and mobile phones is significant at α=0.05 level, supporting H4.
Take in Table Ⅲ Take in Table Ⅳ
六、結論和討論
The results of the analysis provide valuable insights for future research and managers of international brands who wish to create strategies for addressing gray market issues. First, the developed attitude scale fills the void in the literature and facilitates investigation into the gray market from the demand perspective. It opens a new direction for improving our understanding of the gray market. With these measures, practitioners can segment markets and develop an effective strategy to deal with the problems of the gray market.
Second, although most scholars and brand managers believe that price is the main reason that causes consumers to purchase gray market goods, this study reveals that the effect of price consciousness on consumer attitude is insignificant, for two possible reasons. One is similar to that proposed by Dodds (1991): the effect of price on perceived value and willingness to buy may be inverse quadratic (inverted U). If a quadratic relationship exists, then price positively affects attitude at a particular level, and negatively affects attitude at another level, eliminating the linear correlation between price and attitude. Another possibility relates to moderating factors, such as the product cost as a percentage of income, information, consumers’ knowledge, and others, which may exist between price consciousness and consumer attitude. Further research on the relationship between price consciousness and attitude toward the gray market goods is required.
Third, evidence indicates that the price-quality inference significantly and negatively affects consumer attitude toward gray market goods. With most gray market
importers’ free riding on advertising investment and services, low costs and prices have become their main advantage with which the gray market competes with authorized distributors. Gray markets attract consumers with high price sensitivities. However, given the price-quality inference, quality becomes the main concern of the consumers. Managers of international brands
could reinforce price-quality inference-related messages in their communication campaigns, and improve consumers’ perceptions of quality in authorized channels. Champion (1998) suggested that the gray market provides a new type of market segmentation based on consumers’ price sensitivity. High quality and extensive service will become a major competitive advantage with which authorized distributors can secure consumers with a low price-sensitivity. Thus, managers of international brands could maintain their competitiveness by emphasizing price-quality inference and improving the consumers’ perceptions of quality in authorized channels.
Fourth, the results of this study indicate that risk averseness negatively influences consumer attitude toward gray market goods. When purchasing gray market goods, consumers must bear two important risks – a higher likelihood of obtaining a counterfeit product and a deficient guarantee and poor servicing of the product after purchase. For managers of international brands, reminding consumers of the existence of gray market goods and educating them in identifying counterfeit products might not be a good idea, since doing so runs the risk of making potential customers feel threatened, reducing brand loyalty. An easier and safer way is to advise consumers “where” to buy brand products with a good guarantee and supported by good servicing by the brand owners. By promoting authorized channel outlets, their guarantees and their services, brand owners can reduce consumers’ purchasing risks and support authorized distributors, reducing the negative impact of the gray market.
Finally, this study used respondents in Taiwan to test the model. According to a
report in International Financial Statistics, Taiwan’s foreign trade dependency was as high as 82% in 2001, much higher than that of the U.S.A. (19%), Japan (18%), the U.K. (43%) and Germany (57%)[1]. Frequent foreign trade activity facilitates the growth of gray markets in Taiwan. Chang (1993) reported that Taiwan’s legal environment is more favorable for gray market distributors than that of the U.S.A. Gray market goods are widespread and most consumers are familiar with them. Thus, the use of respondents in Taiwan to examine issues concerning the gray market is appropriate. However, whether the results of this study can be extended to other cultures and economic environments, in which consumers may or may not be exposed to so many gray market goods, awaits further study.
This study suggests directions for future research. First, future research may use a detailed experimental design to elucidate further the effect of price consciousness on consumer attitude toward gray market goods, including moderating factors. Secondly, gray market goods of famous international brands appear frequently in several countries, and the influences of culture and economic environments on the model are important. Third, product familiarity may importantly moderate the effect of price-quality inference on consumer attitude. Finally, the appearance of the gray market and the reactions of brand owners may affect brand image, brand loyalty and store image. Future research should address these issues.
This research contributes to the existing literature by establishing a valid measure of consumer attitude toward gray market goods, providing a conceptual model, and suggesting feasible strategies for managers of international brands. By focusing on the demand side of the gray market, managers of international brands can better control the gray market and reduce its impact.
Note:
[1] Source: 1.International Financial Statistics, International Monetary Fund, Washington, D.C.
2. National Statistics, Directorate
General of Budget, Accounting and Statistic, Executive Yuan, R.O.C. 七、計劃成果自評 本計劃依原計劃內容執行,搜集了台 灣的資料,執行統計分析,並驗證假設。 本計劃具學術上和實務上的價值,已為國 際學術期刊接受。 八、附錄 Measurement Scales
(Respondents are requested to answer the following questions with answers from strongly agree to strongly disagree on a Likert 7-point scale, “-“ in parentheses means a negative statement)
Consumer Attitude toward Gray Market Goods
* Generally speaking, buying gray market goods is a better choice.
* Considering price, I prefer gray market goods.
* I like shopping for gray market goods. * Buying gray market goods generally benefits the consumer.
* There’s nothing wrong with purchasing gray market goods.
* I never consider gray market goods when choosing merchandise. (-)
Price Consciousness (Lichtenstein, Ridgway, and Netemeyer, 1993)
* I am not willing to go to the extra effort to find lower prices. (-)
* The money saved by searching for lower prices is usually not worth the time and effort. (-)
* I would never shop at more than one store to find lower prices. (-)
* The time it takes to find lower prices is usually not worth the effort. (-)
Price-Quality Inference (Lichtenstein, Ridgway, and Netemeyer, 1993)
* Generally speaking, the higher the price of a product, the higher the quality.
indicator of its quality.
* You always have to pay a bit more for the best.
Risk Averseness (Burton, Lichtenstein, Netemeyer, and Garretson, 1998)
* I don’t like to take risks.
* Compared to most people I know, I like to “live life on the edge”. (-)
* I have no desire to take unnecessary chances on things.
* Compared to most people I know, I like to gamble on things. (-)
Purchase Intention (Grewal, 1998) * I would purchase _______.
* I would consider buying ________. * The probability that I would consider buying _________.
八、參考文獻
Ajzen, I. and Fishbein, M. (1980),
Understanding attitudes and predicting social behavior. Englewood Cliffs, NJ:
Prentice-Hall.
Alberts, Sam J. (1992), "Trademarks and gray market goods: Why U.S. trademark holders should be held strictly liable for defective gray market imports," The
George Washington Journal of International Law & Economics, Vol.25
No.3, pp.841-873.
Armstrong, J Scott, Morwitz, Vicki G, and Kumar, V (2000), “Sales Forecasts for Existing Consumer Products and Services: Do Purchase Intentions Contribute to Accuracy ?” International
Journal of Forecasting, Vol.16 No.3,
pp.383-397.
Batra, Rajeev and Sinha, Indrajit (2000), " Consumer-Level Factors Moderating the Success of Private Label Brands,"
Journal of Retailing, Vol.76 No.2,
pp.175-191.
Berger, Ida E., Ratchford, Brian T., and Haines, George H. (1994), "Subjective Product Knowledge as a Moderator of the Relationship Between Attitudes and Purchase Intentions for a durable
Product," Journal of Economic
Psychology, Vol.15 No.2, pp.301-314.
Brucks, Merrie, Zeithaml, Valarie A., and Naylor, Gillian (2000), "Price and Brand Name as Indicators of Quality Dimensions for Consumer Durables,"
Academy of Marketing Science, Vol.28
No.3, pp.359-374.
Bucklin,Louis P. (1993), "Modeling the International Gray Market for Public Policy Decisions," International Journal
of Research in Marketing, Vol.10 No.4,
pp.387-405.
Burton, Scot, Lichtenstein, Donald R., Netemeyer, Richard G., and Garretson, Judith A. (1998), "A Scale for Measuring Attitude Toward Private Label products and an Examination of its Psychological and behavioral correlates," Academy of Marketing
Science, Vol.26 No.4, pp.293-306.
Cavusgil, S.Tamer and Sikora, Ed. (1988), "How Multinationals Can Counter Gray Market Imports," Columbia Journal of
World Business, Winter, pp.75-85.
Cespedes, Frank V., Corey, E. Raymond, and Rangan, V.Kasturi (1988), "Gray Markets: Causes and Cures," Harvard
Business Review, Vol.66 No.4,
pp.75-83.
Champion, David (1998), "Marketing: The bright side of gray markets," Harvard
Business Review, Vol.76 No.5,
pp.19-22.
Chang, Tung-Zong (1993), "Parallel Importation in Taiwan: A View from a Newly Emerged Country and a Comparative Analysis," International
Marketing Review, Vol.10 No.6,
pp.30-41.
Chapman, Joe and Wahlers, Russ (1999), "A Revision and Empirical Test of the Extended Price-Perceived Quality Model," Journal of Marketing Theory
and Practice, Vol.7 No.3, pp.53-64.
Churchill, Gilbert A. (1979), "A Paradigm for Developing Better Measures of Marketing Constructs," Journal of
Marketing Research, Vol.16 No.1,
DeVellis, Robert F. (1991), Scale
Development: Theory and Applications.
SAGE Publications.
Dodds, William B., Monroe, Kent B., and Grewal, Dhruv (1991), "Effects of Price, Brand, and Store Information on Buyers' Product Evaluations," Journal of
Marketing Research, Vol.28 No.3,
pp.307-319.
Donthu, Naveen (1992), “Comparative Advertising Intensity,” Journal of
Advertising Research, Vol.32 No.6,
pp.54-61.
Duhan, Dale F. and Sheffet, Mary Jane (1988), "Gray Markets and the Legal Status of Parallel Importation," Journal
of Marketing, Vol.52 (July), pp.75-83.
Fishbein, Martin and Ajzen, Icek (1981), “On Construct Validity: A Critique of Miniard and Cohen’s Paper,” Journal of
Experimental Social Psychology, Vol.17
(May), pp.340-350.
Fornell, Claes and Larcker, David F. (1981), "Evaluating Structural Equation Models with Unobservable Variables and Measurement Error," Journal of
Marketing Research, Vol.18 No.1,
pp.39-50.
Gallini, Nancy T. and Hollis, Aidan (1999), " A Contractual Approach to the Gray Market," International Review of Law
and Economics, Vol.19 No.1, pp.1-21.
Gerbing, David W. and Anderson, James C. (1988), “ An Updated Paradigm for Scale Development Incorporating Unidimensionality and Its Assessment,”
Journal of Marketing Research, Vol.25
(May), pp.186-192.
Grewal, Dhruv (1998), "The Effect of Store Name, Brand Name and Price Discounts on Consumers' Evaluations and Purchase Intentions," Journal of
Retailing, Vol.74 No.3, pp.331-352.
Howell, Roy D., Britney, Robert R., Kuzdrall, Paul J., and Wilcox, James B. (1986), "Unauthorized Channels of Distribution: Gray Markets," Industrial Marketing
Management, Vol.15 No.4, pp.257-263.
Janiszewski, Chris and Lichtenstein, Donald R. (1999), “A Range Theory Account of
Price Perception,” Journal of Consumer
Research, Vol.25 (March), pp.353-368.
Kim, Min-Sun and Hunter, John E. (1993), “Relationships among Attitudes, Behavioral Intentions, and Behavior: A Meta-Analysis of Past Research, Part 2,” Communication Research, Vol.20 No.3, pp.331-364.
Lichtenstein, Donald R., Ridgway, Nancy M., and Netemeyer, Richard G. (1993), “Price Perceptions and Consumer Shopping Behavior: A Field Study,”
Journal of Marketing Research, Vol.30
(May), pp.234-245.
Lowe, Larry S. and McCrohan, Kevin F. (1989), "Minimize the Impact of the Gray Market," Journal of Business
Strategy, Vol.10 No.6, pp.47-50.
Mathur, Lynette Knowles (1995), “The Impact of International Gray Marketing on Consumers and Firms,” Journal of
Euro-Marketing, Vol.4 No.2, p.39-.
McQuarrie, Edward F. and Munson, J. Michael (1991), “A Revised Product Involvement Inventory: Improved Usability and Validity,” Advances in
Consumer Research, Vol.19,
pp.108-115.
Monroe, Kent B. and Krishnan, R. (1985), “ The Effect of Price on Subjective Product Evaluations,” Perceived Quality:
How Consumers View Stores and Merchandise, J. Jacoby and J. Olson,
Eds., Lexington, MA: D.C.Heath, pp.209-232.
Muncy, James A. and Vitell, Scott J. (1992), “Consumer Ethics: An Investigation of the Ethical Beliefs of the Final
Consumer,” Journal of Business
Research, Vol.24 No.4, pp.297-312.
Myers, Matthew B. (1999), "Incidents of Gray Market Activity among U.S. Exporters: Occurrences, Characteristics, and Consequences," Journal of
International Business Studies, Vol.30
No.1, pp.105-126.
Netemeyer, Richard G. (1992), “A Comparative Analysis of Two Models of Behavioral Intention,” Journal of the
Academy of Marketing Science, Vol.20
Nunnally, Jum C. and Bernstein, Ira H.
(1994), Psychometric Theory: 3rd
edition. McGraw-Hill, Inc.
Ordonez, Lisa D. (1998), "The Effect of Correlation Between Price and Quality on Consumer Choice," Organizational
Behavior and Human Decision Processes, Vol.75 No.3, pp.258-273.
Palia, Aspy P. and Keown, Charles F. (1991), "Combating Parallel Importing: Views of U.S. Exports to the Asia-Pacific
Region," International Marketing
Review, Vol.8 No.1, pp.47-56.
Peter, J.P. and Ryan, M.J. (1976), “An Investigation of Perceived Risk at the Brand Level,” Journal of Marketing
Research, Vol.13, pp.184-188.
Prince, Melvin (2000), " Seeing Red Over International Gray Markets," Business
Horizons, Vol.43 No.2, pp.71-74.
Rajendran, K.N and Tellis, Gerard J (1994), “Contextual and Temporal Components of Reference Price,” Journal of
Marketing, Vol.58 No.1, p.22-.
Sharma, Subhash (1996), Applied
Multivariate Techniques, John Wiley &
Sons, Inc.
Sheppard, Blair H., Hartwick, Jon, and Warshaw, Paul R. (1988), “The Theory of Reasoned Action: A Meta-Analysis of Past Research with Recommendations for Modifications and Future Research,” Journal of
Consumer Research, Vol.15 (December),
pp.325-343.
Sheth, Jagdish N., Bruce I. Newman, and Barbara L. Gross (1991), Consumption
Values and Market Choices: Theory and Applications. South-Western Publishing
Co.
Sjolander, Richard (1992),"Cross-Cultural Effects of Price on Perceived Product Quality," European Journal of
Marketing, Vol.26 No.7, pp.34-44.
Tellis, Gerard J. and Gaeth, Gary J. (1990), “Best Value, Price-Seeking, and Price Aversion: The Impact of Information and Learning on Consumer Choices,”
Journal of Marketing, Vol.54 (April),
pp.34-45.
Tian, Kelley Tepper, Bearden, William O., and Hunter, Gary L. (2001), “Consumers’ Need for Uniqueness: Scale Development and Validationm,”
Journal of Consumer Research, Vol.28
(June), 50-66.
Vitell, Scott J. and Muncy, James (1992), “Consumer Ethics: An Empirical Investigation of Factors Influencing Ethical Judgments of the Final Consumer,” Journal of Business Ethics, Vol.11, pp.585-597.
Wilkie, William L. (1994), Consumer
Behavior, 3rdedition, NY: John Wiley & Sons, Inc.
Zaichkowsky, Judith Lynne (1985), “Measuring the Involvement Construct,”
Journal of Consumer Research, Vol.12
- 14 -
Table Ⅰ: Correlation Matrix
Price PQ RA Attitude PI (B) PI(W) PI(M)
p1 p2 p3 p4 pq1 pq2 pq3 r1 r2 r3 r4 a1 a2 a3 a4 a5 a6 b11 b12 b13 b21 b22 b23 b31 b32 b33 p1 1.00 - - - - - - - - -p2 0.58 1.00 - - - - - - - -p3 0.46 0.46 1.00 - - - - - - -Price p4 0.35 0.52 0.56 1.00 - - - - - - -pq1 -0.06 -0.05 0.15 0.03 1.00 - - - - - - -pq2 -0.14 -0.09 0.06 0.06 0.57 1.00 - - - - - - -PQ pq3 -0.06 -0.16 0.00 -0.06 0.38 0.52 1.00 - - - - - - -r1 0.09 0.05 0.05 -0.01 -0.10 -0.13 -0.05 1.00 - - - - - - -r2 0.11 0.20 0.02 -0.02 -0.10 -0.24 -0.12 0.51 1.00 - - - - - - -r3 -0.01 -0.06 0.02 -0.03 0.09 0.12 0.06 0.43 0.15 1.00 - - - - - - - -RA r4 0.04 0.10 -0.03 0.04 -0.02 0.00 0.12 0.28 0.21 0.35 1.00 - - - - - - -a1 0.01 -0.14 -0.05 -0.02 -0.06 0.00 0.02 -0.11 -0.19 0.06 -0.06 1.00 - - - - - -a2 0.00 -0.08 -0.01 0.12 -0.13 0.00 0.11 -0.04 -0.08 0.11 0.15 0.54 1.00 - - - - -a3 -0.09 -0.17 -0.05 -0.03 -0.08 -0.02 0.02 -0.13 -0.14 0.08 -0.01 0.72 0.72 1.00 - - - -a4 -0.11 -0.06 -0.01 -0.06 -0.02 0.12 0.12 -0.20 -0.14 -0.03 -0.05 0.49 0.46 0.56 1.00 - - - -a5 -0.04 -0.15 0.03 0.00 -0.10 -0.04 0.03 0.02 -0.08 0.05 -0.04 0.45 0.53 0.54 0.53 1.00 - - - -Attitude a6 0.18 0.09 0.18 0.06 -0.22 -0.18 -0.04 -0.11 -0.12 -0.08 -0.10 0.35 0.39 0.36 0.27 0.43 1.00 - - - -PI(B) b11 -0.03 -0.08 -0.06 -0.10 0.00 -0.06 -0.01 -0.06 -0.19 -0.01 -0.09 0.19 0.03 0.10 0.12 0.13 0.13 1.00 - - -
-- 15 -- b12 0.03 -0.06 0.01 -0.11 -0.05 -0.09 -0.03 -0.03 -0.19 -0.02 0.00 0.15 0.02 0.06 0.09 0.07 0.18 0.85 1.00 - - - -b13 0.09 -0.05 0.04 -0.03 -0.08 -0.09 -0.03 -0.01 -0.21 -0.02 -0.02 0.15 -0.02 0.05 0.03 0.14 0.20 0.75 0.80 1.00 - - - -b21 0.03 0.03 -0.02 0.03 -0.12 -0.07 -0.12 -0.04 -0.17 0.07 0.13 0.32 0.44 0.36 0.22 0.36 0.33 0.19 0.14 0.14 1.00 - - - - -b22 0.05 -0.04 -0.02 -0.08 -0.11 -0.15 -0.09 0.04 -0.11 0.07 0.16 0.33 0.44 0.38 0.20 0.42 0.37 0.14 0.14 0.14 0.85 1.00 - - - -PI(W) b23 0.09 -0.04 -0.02 -0.03 -0.24 -0.14 -0.07 -0.05 -0.12 0.02 0.08 0.29 0.34 0.30 0.17 0.32 0.30 0.12 0.14 0.20 0.71 0.69 1.00 - - -b31 0.01 0.03 -0.03 -0.06 -0.11 0.00 -0.01 -0.06 -0.18 0.13 -0.01 0.39 0.46 0.40 0.32 0.44 0.39 0.14 0.11 0.13 0.53 0.48 0.46 1.00 - -b32 0.02 -0.02 -0.03 -0.07 -0.14 -0.03 -0.05 -0.01 -0.18 0.13 0.02 0.43 0.45 0.40 0.29 0.47 0.39 0.15 0.18 0.20 0.50 0.54 0.47 0.92 1.00 -PI(M) b33 0.01 -0.03 -0.06 -0.09 -0.09 -0.04 -0.01 0.02 -0.08 0.16 0.03 0.37 0.43 0.43 0.25 0.44 0.36 0.07 0.06 0.08 0.46 0.46 0.55 0.84 0.81 1.00 Remark:
PC – Price Consciousness PQ – Price-Quality Inference RA – Risk Averseness
Attitude – Consumer Attitude Toward Gray Market Goods PI(B) – Purchase Intention of Beverage PI(W) – Purchase Intention of Watch PI(M) – Purchase Intention of Mobile Phone
- 16 -
Table Ⅱ: Summary of Constructs Measures
Construct Item no. Cronbach α Reliability* Average
Variance Extracted(AVE)* Price Consciousness 4 0.79 0.82 0.53 Price-Quality Inference 3 0.74 0.75 0.51 Risk Averseness 4 0.66 0.70 0.39 Consumer’s Attitude Toward Gray Market Goods 6 0.85 0.87 0.53 Purchase Intention (beverage) 3 0.92 0.92 0.80 Purchase Intention (watch) 3 0.90 0.90 0.76 Purchase Intention (Mobile Phone) 3 0.95 0.95 0.86
- 17 -
Table Ⅲ: Parameter Estimation of Full Model
Product Gamma(γ) Beta(β) Model Fit
PC PQ RA Attitude Attitude 0.08 (0.84) -0.28 (-2.53)a -0.18 (-1.83)b Beverage PI 0.17 (1.79)b χ2 =171.28 d.f.=156 (p=0.19) GFI=0.90 AGFI=0.87 Attitude 0.09 (0.94) -0.29 (-2.62)a -0.21 (-2.05)a Watch PI 0.63 (5.88)a χ2 =175.54 d.f.=156 (p=0.14) GFI=0.90 AGFI=0.86 Attitude 0.07 (0.72) -0.24 (-2.20)a -0.20 (-1.91)b Mobile Phone PI 0.65 (6.16)a χ2 =171.97 d.f.=156 (p=0.18) GFI=0.90 AGFI=0.87 Remark: Numbers in parentheses indicate t-values
a : significant at α=0.05 level
b : significant at α=0.1 level
PC : Price Consciousness PQ : Price-Quality Inference RA : Risk Averseness
Attitude : Consumer attitude toward gray market goods
- 18 -
Table Ⅳ: Parameter Estimation of Reduced Model
Product Gamma(γ) Beta(β) Model Fit
PQ RA Attitude Attitude -0.23 (-2.26)a -0.16 (-1.91)b Beverage PI 0.12 (1.39) χ2 =94.20 d.f.=93 (p=0.45) GFI=0.93 AGFI=0.90 Attitude -0.21 (-2.03)a -0.19 (-2.23)a Watch PI 0.53 (5.36)a χ2 =105.54 d.f.=93 (p=0.18) GFI=0.92 AGFI=0.89 Attitude -0.20 (-1.99)a -0.20 (-2.30)a Mobile Phone PI 0.53 (5.70)a χ2 =104.34 d.f.=93 (p=0.20) GFI=0.93 AGFI=0.89 Remark: Numbers in parentheses indicate t-values
a : significant at α=0.05 level
b : significant at α=0.1 level
PQ : Price-Quality Inference
RA : Risk Averseness
Attitude : Consumer attitude toward gray market goods
- 19 -
Figure-1 Conceptual Model
Remark: PC – Price Consciousness PQ – Price-Quality Inference
RA – Risk Averseness
Attitude – Consumer attitude toward gray market goods
PI – Purchase Intention PC RA PQ Attitude PI