運用累積展望理論於創新服務之適當期調整 - 政大學術集成
179
0
0
全文
(2) An Application of Cumulative Prospect Theory to Appropriate Expectation Positioning of New Service 運用累積展望理論於創新服務之適當期望調整. by Hsi-Yun Wang. 立. 政 治 大. ‧ 國. 學. A Dissertation Submitted in Total Fulfillment of the Requirement for the Degree of. ‧. Master of Science. er. io. sit. y. Nat. In. n. aManagement information Systems iv l C n hengchi U. Supervisor: Soe-Tysr Yuan, Professor, MIS, NCCU. NATIONAL CHENGCHI UNIVERSITY Jul 2014 © Hsi-Yun Wang. 2.
(3) ACKNOWLEDGEMENT The accomplishment of this thesis must be ascribed to a lot of people’s blood and assistance. In the beginning, I would like to appreciate the person who is not only playing the teacher but also playing the soul in my two-year graduate life: Prof. Yuan Soe-Tsyr. It is not necessary to emphasize her knowledge and passion but the consideration and tenderness. I learned and grew up from her encouragement to overcome every challenge and frustration in these two years. Besides researching, the suggestion and sharing of her life philosophy and emotional aspiration also make me. 政 治 大. think a different side of life. Her great selfless cultivation will be kept in my mind and. 立. heart and never be forgotten.. ‧ 國. 學. The Service Science Research Center (SSRC) family grant helping hands of maturing this thesis. Those postdoctoral fellows of Gary, Cindy, Susy and Iting, the. ‧. big brothers/sisters- James, Steven, Lavender and Eugene and my partners in arms-. sit. y. Nat. Michael and Sandy, accompany me at every moment indeed. In our warm comfortable. n. al. er. io. lab, we study and research for ambition, we laugh for every happiness thing in daily. i n U. v. life and discuss and argue for ideas and now we move on for our next step of our lives.. Ch. engchi. It is my fortune and pleasure to meet all of you guys!. Finally, it’s hard for me to put it into words that how lucky I have many lovely family and friends, and they are the strongest and permanent support team. Their tolerance of my emotion and complaining and encouragements of keep going to give me largest confidence of trusting myself help me complete and conquer every challenge. Thank them for always letting me pursue my dream. Hope one day I can make you proud. In the end, I would like to thank my dear friend, Ryan, be with me every day. Sherry in SSRC. 2014/7/13 3.
(4) ABSTRACT In the era of service innovation, the question of when to evaluate which innovation services and how to achieve personalized evaluation is still not clear. This is especially true under the situations of uncertainty and risk when it comes to bringing the effectiveness of service innovation promotion and decision making, i.e., for service providers to retain service quality and competitiveness and for service receivers to efficiently and accurately decide whether to try new service. Therefore, an appropriate expectation positioning mechanism proposed in this. 政 治 大 service promotion decisions 立 capable of achieving each stakeholder’s purposes as. study aims to collect psychological information from service receivers to make. ‧ 國. 學. well as satisfying service receivers, utilizing the psychological information of psychological values and probability weights.. ‧ sit. y. Nat. Keywords: Customer Expectations, Behavior Economics, Behavior Change,. n. al. er. io. Psychological value, Cumulative Prospect Theory.. Ch. engchi. i n U. v. 4.
(5) INDEX CHAPTER 1 INTRODUCTION .............................................................................. 13 1.1 BACKGROUND AND MOTIVATION ........................................................................ 13 1.2 RESEARCH QUESTION ......................................................................................... 18 1.3 RESEARCH METHOD............................................................................................ 20 1.4 PURPOSE AND CONTRIBUTION ............................................................................. 22 1.5 CONTENT ORGANIZATION ................................................................................... 23 1.6 TERMINOLOGIES.................................................................................................. 25 1.7 LIMITATIONS OF THE STUDY ................................................................................ 26 CHAPTER 2 LITERATURE REVIEW .................................................................. 28 2.1 BEHAVIOR CHANGE ............................................................................................. 28. 政 治 大. 2.2 DECISION MAKING UNDER UNCERTAINTY ............................................................ 30 2.3 MODE OF THINKING (SYSTEM1 & SYSTEM2)........................................................ 32 2.4 GAP OF SERVICE QUALITY.................................................................................... 35 2.5 CUMULATIVE PROSPECT THEORY (CPT) ............................................................. 41. 立. ‧ 國. 學. CHAPTER 3 MOTIVATING APPLICATIONS ..................................................... 44. ‧. 3.1 CONCEPTUAL FRAMEWORK OF BMIND .............................................................. 44 3.1.1 Preference Analysis ..................................................................................... 45 3.1.2 Appropriate Expectation Positioning .......................................................... 46 3.1.3 Visualization-based Cognition Behavior Reframing................................... 47. sit. y. Nat. n. al. er. io. 3.2 SYSTEM ARCHITECTURE OF BMIND................................................................... 49 3.2.1 Building a Mental State Module ................................................................. 51 3.2.2 Appropriate Mental State Module ............................................................... 51 3.2.3 Communicating with Cognition Module ..................................................... 52 3.3 SYSTEM SCENARIO .............................................................................................. 54. Ch. engchi. i n U. v. CHAPTER 4 METHODOLOGY ............................................................................. 57 4.1 MOTIVATING CONCEPT ........................................................................................ 57 4.2 CONCEPTUAL MODEL.......................................................................................... 61 4.3 SYSTEM ARCHITECTURE...................................................................................... 71 4.3.1 Psychological Value (personal value function)........................................... 73 4.3.2 Probability weight (personal weight function) ........................................... 80 4.3.3 Utility value ................................................................................................. 85 CHAPTER 5 APPLICATION SCENARIO ............................................................ 89 5.1 AN OVERVIEW OF APPLICATION CONTEXT ............................................................ 89 5.2 THE SYSTEM JOURNEY OF THE APPLICATION ........................................................ 90 5.
(6) 5.3 DETAILED VIEWS OF THE BMIND SYSTEM EXPERIENCE .................................... 92 CHAPTER 6 EVALUATION .................................................................................. 100 6.1 PROPOSITIONS ................................................................................................... 101 6.2 ASSUMPTIONS ................................................................................................... 103 6.3 EXPERIMENTS DESIGN DETAILS ........................................................................ 105 6.3.1 Data Collection Procedure Design ........................................................... 105 6.3.2 Questionnaire Question Design ................................................................ 106 6.3.3 Design principle and experiment details .................................................. 107 (a) Design principle and experiment details for Proposition 1 .................... 107 (b) Design principle and experiment details for Proposition 2 .................... 113 (c) Design principle and experiment details for Proposition 3 .................... 115 (d) Design principle and experiment details for Proposition 3-A................ 118 (e) Design principle and experiment details for Proposition 4 .................... 121 6.4 EVALUATION RESULTS....................................................................................... 121 Experiment and results for Proposition 1 .......................................................... 121. 立. 政 治 大. ‧. ‧ 國. 學. Experiment and results for Proposition 2 .......................................................... 131 Experiment and results for Proposition 3 .......................................................... 133 Experiment and results for Proposition 3-A ...................................................... 142 Experiment and results for Proposition 4 .......................................................... 151 6.4 DISCUSSION OF FINDING ................................................................................... 154 6.4.1 Findings for new service provider ............................................................ 154. sit. y. Nat. al. er. io. 6.4.2 Findings for BMIND system ..................................................................... 156. v i n Ch 7.1 CONTRIBUTIONS ................................................................................................ 161 U i e h n c .................................................... 161 (1) The designed interacted adjusting g system n. CHAPTER 7 CONCLUSION ................................................................................. 161. (2) Psychological information of behavioral change ........................................ 162 (3) Applying the cumulative prospect theory ..................................................... 162 7.2 MANAGERIAL IMPLICATIONS ............................................................................. 163 (1) Stimulate user to co-create utility with BMIND system ............................... 163 (2) Stimulate user to do behavioral change via interacting (making choice) with adjusting system ................................................................................................. 163 (3) Using the innovative way to promote new service ....................................... 164 (4) Behaviors of different roles of BMIND users ............................................... 164 7.3 LIMITATIONS AND FUTURE WORKS ................................................................... 166 7.4 CONCLUSION REMARKS .................................................................................... 167 APPENDIX A ........................................................................................................... 169 6.
(7) APPENDIX B ........................................................................................................... 171 APPENDIX C ........................................................................................................... 172 REFERENCE ........................................................................................................... 175. 立. 政 治 大. ‧. ‧ 國. 學. n. er. io. sit. y. Nat. al. Ch. engchi. i n U. v. 7.
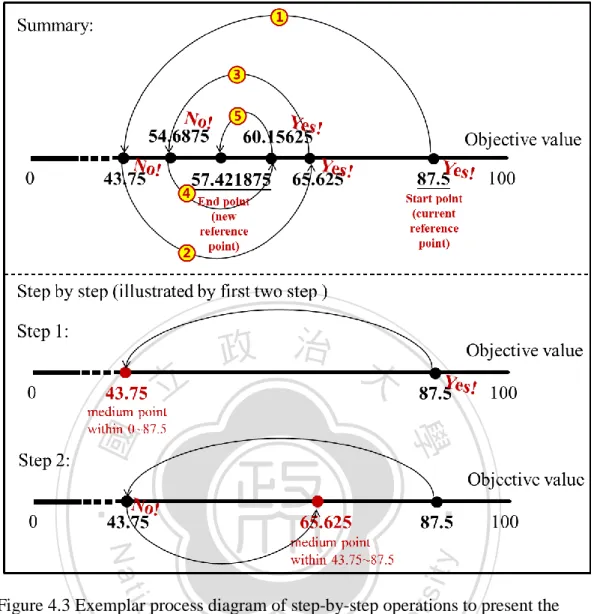
(8) FIGURE INDEX CHAPTER 1 INTRODUCTION .............................................................................. 13 FIGURE 1.1 CLASSICAL SIMULTANEOUS LIGHTNESS CONTRAST (SOURCE: LOGVINENKO, 2002) ................................................................................................. 14 FIGURE 1.2 STAGE OF CHANGE (SOURCE: PROCHASKA, 1998).................................. 15 FIGURE 1.3 DESIGN SCIENCE RESEARCH FRAMEWORK (HEVNOR ET AL., 2004) ....... 23 CHAPTER 2 LITERATURE REVIEW .................................................................. 28 FIGURE 2.1 FOUR LEVEL OF UNCERTAINTY (SOURCE : COURTNEY, 1997) .................. 31 FIGURE 2.2 THE FAMOUS EXPERIMENT OF SYSTEM 1 (SOURCE: MULLER-LYER, 1889) .................................................................................................................................. 35 FIGURE 2.3 GAPS OF SERVICE QUALITY IN HUMAN’S MENTAL SYSTEM (SOURCE : PARASURAMAN, ZEITHAMEL, AND BERRY, 1985) ...................................................... 37 FIGURE 2.4 THE ATTRIBUTE OF EXPECTED SERVICE.................................................... 38 FIGURE 2.5 VALUE FUNCTION IN CPT (SOURCE : TVERSKY, KAHNEMAN, 1992) ....... 42 FIGURE 2.6 WEIGHTED CUMULATIVE PROBABILITIES FUNCTION IN CPT (SOURCE :. 立. 政 治 大. ‧ 國. 學. TVERSKY, KAHNEMAN, 1992) ................................................................................... 43 CHAPTER 3 MOTIVATING APPLICATIONS ..................................................... 44. ‧. sit. y. Nat. FIGURE 3.1 CONCEPTUAL FRAMEWORK OF BMIND ................................................. 45 FIGURE 3.2 SYSTEM ARCHITECTURE OF BMIND SERVICE ........................................ 50. io. er. CHAPTER 4 METHODOLOGY ............................................................................. 57 FIGURE 4.1 GAPS OF SERVICE QUALITY IN HUMAN’S MENTAL SYSTEM ....................... 57 FIGURE 4.2 CONCEPTUAL MODEL ............................................................................. 61 FIGURE 4.3 SYSTEM ARCHITECTURE ......................................................................... 71 FIGURE 4.2 THE MODIFICATION OF OUTCOME VIA INTERACTING WITH USER .............. 76 FIGURE 4.3 EXEMPLAR PROCESS DIAGRAM OF STEP-BY-STEP OPERATIONS TO PRESENT. n. al. Ch. engchi. i n U. v. THE PROCEDURE OF GENERATING OUTCOMES ............................................................ 77. CHAPTER 5 APPLICATION SCENARIO ............................................................ 89 FIGURE 5.1 THE SYSTEM JOURNEY OF THE USER........................................................ 91 FIGURE 5.2 PERSONALITY INFORMATION AND REGISTERING PAGE ........................... 92 FIGURE 5.3 THE CATEGORY OF NEW SERVICE CHOSE BY SERVICE PROVIDER .............. 93 FIGURE 5.4 THE NAME (TOP) AND DESCRIPTION (DOWN) OF NEW SERVICE FILLED IN BY SERVICE PROVIDER .................................................................................................... 93 FIGURE 5.5 KEYWORDS OF INSIGHT FOR SERVICE PROVIDER...................................... 94 FIGURE 5.6 THE PREFERENCE ATTRIBUTES OF USER ................................................. 95 FIGURE 5.7 THE CUSTOMIZED QUESTION OF SPECIFIC ATTRIBUTE............................ 96 8.
(9) FIGURE 5.8 THE CUSTOMIZED QUESTION OF SPECIFIC ATTRIBUTE............................ 98 CHAPTER 6 EVALUATION .................................................................................. 100 FIGURE 6.1 THE PROCEDURE COMPARISON............................................................. 105 FIGURE 6.2 THE QUESTIONNAIRE QUESTION OF ONLINE SHOPPING SERVICE FOR PROPOSITION 1 (1/4) ............................................................................................... 109 FIGURE 6.3 THE QUESTIONNAIRE QUESTION OF ONLINE SHOPPING SERVICE FOR PROPOSITION 1 (2/4) ............................................................................................... 109 FIGURE 6.4 THE QUESTIONNAIRE QUESTION OF ONLINE SHOPPING SERVICE FOR PROPOSITION 1 (3/4) ............................................................................................... 110 FIGURE 6.5 THE QUESTIONNAIRE QUESTION OF ONLINE SHOPPING SERVICE FOR PROPOSITION 1 (4/4) ............................................................................................... 111 FIGURE 6.6 THE QUESTIONNAIRE QUESTION OF MUSIC STREAMING SERVICES FOR PROPOSITION 1 (1/4) ............................................................................................... 111 FIGURE 6.7 THE QUESTIONNAIRE QUESTION OF MUSIC STREAMING SERVICES FOR PROPOSITION 1 (2/4) ............................................................................................... 112. 立. 政 治 大. ‧. ‧ 國. 學. FIGURE 6.8 THE QUESTIONNAIRE QUESTION OF MUSIC STREAMING SERVICES FOR PROPOSITION 1 (3/4) ............................................................................................... 112 FIGURE 6.9 THE QUESTIONNAIRE QUESTION OF MUSIC STREAMING SERVICES FOR PROPOSITION 1 (4/4) ............................................................................................... 113 FIGURE 6.10 THE QUESTIONNAIRE QUESTION OF ONLINE SHOPPING SERVICE FOR PROPOSITION 2 ........................................................................................................ 114. sit. y. Nat. n. al. er. io. FIGURE 6.11 THE QUESTIONNAIRE QUESTION OF MUSIC STREAMING SERVICES FOR PROPOSITION 2 ........................................................................................................ 115 FIGURE 6.12 THE PROCEDURE OF Q&A WITH SYSTEM. ............................................ 118 FIGURE 6.12 THE PROPOSITION 1 TEST.................................................................... 122 FIGURE 6.13 MATHEMATICAL SYMBOLS................................................................... 123 FIGURE 6.13 VALUE OF 𝑡𝛼 ...................................................................................... 125. Ch. engchi. i n U. v. FIGURE 6.14 BAR CHART OF RESULT OF THE HIGHEST PSYCHOLOGICAL VALUE ....... 132 FIGURE 6.15 THE EVOLUTION OF URICA SCORE..................................................... 134 FIGURE 6.16 PROPORTION OF DECREASING CATEGORY ............................................ 138 FIGURE 6.17 PROPORTION OF UTILITY VALUE (GAIN OR LOSS) OF NEW SERVICE ...... 141 FIGURE 6.21 THE PROPOSITION 3-A TEST ABOUT CONSCIOUS OF ADJUSTING........... 143 FIGURE 6.22 THE PROPOSITION 3-A TEST ABOUT CONFIDENCE OF ADJUSTING ........ 145 FIGURE 6.18 MENTAL ACTIVITY PROPORTION......................................................... 148 FIGURE 6.19 COMBINATION PROPORTION ............................................................... 149 FIGURE 6.20 SEQUENCE OF MENTAL ACTIVITY ....................................................... 150 FIGURE 6.23 PROPORTION OF BEHAVIORAL CHANGE CYCLE .................................... 152 FIGURE 6.24 EVOLUTION OF URICA SCORE ........................................................... 153 9.
(10) CHAPTER 7 CONCLUSION ................................................................................. 161 REFERENCE ........................................................................................................... 172. 立. 政 治 大. ‧. ‧ 國. 學. n. er. io. sit. y. Nat. al. Ch. engchi. i n U. v. 10.
(11) TABLE INDEX CHAPTER 1 INTRODUCTION .............................................................................. 13 TABLE 1.1 THE DEFINITION OF NEW SERVICES OF RADICAL INNOVATIONS (SOURCE: JOHNSON ET AL., 2000) ............................................................................................. 27 CHAPTER 2 LITERATURE REVIEW .................................................................. 28 TABLE 2.1 THE DEFINITION OF STAGE OF BEHAVIOR CHANGE (SOURCE: AFAO, 1996) .................................................................................................................................. 28 TABLE 2.2. THE TERMS FOR THE TWO SYSTEMS USED BY A VARIETY OF THEORISTS AND THE PROPERTIES OF DUAL-PROCESS THEORIES OF REASONING (SOURCE: KEITH STANOVICH ET. 2000)................................................................................................ 33 CHAPTER 3 MOTIVATING APPLICATIONS ..................................................... 44. 政 治 大. CHAPTER 4 METHODOLOGY ............................................................................. 57. 立. ‧ 國. 學. TABLE 4.1 THE DEFINITION OF EACH CONSTRUCT ..................................................... 62 TABLE 4.2 THE DEFINITION OF RECEIVING INFORMATION .......................................... 75. ‧. TABLE 4.3 THE DEFINITION OF VARIABLES OF VALUE FUNCTION................................ 78 TABLE 4.4 THE DEFINITION OF VARIABLES OF WEIGHT FUNCTION.............................. 83 TABLE 4.5 THE DEFINITION OF VARIABLES OF UTILITY FUNCTION OF PROSPECT THEORY ..................................................................................................................... 86. y. Nat. sit. CHAPTER 5 APPLICATION SCENARIO ............................................................ 89. al. er. io. TABLE 5.1 RESULT OF EXPECTATION ADJUSTING IN THE ENCOUNTER 1 .................... 95. v. n. TABLE 5.2 RESULT OF EXPECTATION ADJUSTING IN THE ENCOUNTER 2 .................... 96 TABLE 5.3 RESULT OF EXPECTATION ADJUSTING IN THE ENCOUNTER 3 .................... 98. Ch. engchi. i n U. CHAPTER 6 EVALUATION .................................................................................. 100 TABLE 6.1 DESIGN EVALUATION METHODS (SOURCE: HEVNER ET AL., 2004) ........ 101 TABLE 6.1 THE URICA QUESTIONNAIRE: READINESS TO CHANGE SCORE (DICLEMENTE, C.C., SCHLUNDT, D., & GEMMELL, L., 2004) ................................. 116 TABLE 6.2 INTERVIEW QUESTION DESIGN ............................................................... 118 TABLE 6.3 INTERVIEW QUESTION DESIGN ............................................................... 119 TABLE 6.2 DESCRIPTIVE STATISTICS ........................................................................ 123 TABLE 6.3 THE FORMULA AND INTERPRETATION OF THE TWO-SAMPLE T TEST ....... 124 TABLE 6.4 INDEPENDENT SAMPLE TEST (TWO-SAMPLE T TEST) ............................. 124 TABLE 6.5 SUMMARY OF THE STATISTICAL RESULT .................................................. 126 TABLE 6.6 INTERVIEW QUESTION FOR SURMISE OF RESULT OF PROPOSITION 1 ........ 127 TABLE 6.7 IN DEPTH INTERVIEW ABOUT PERCEIVE OF GAIN AND AVOID LOSS........... 127 TABLE 6.8 THE SUMMARY OF THE SURMISE THE POSSIBLE REASONS ........................ 129 11.
(12) TABLE 6.9 THE MEANING OF URICA SCORE ........................................................... 133 TABLE 6.10 BEHAVIOR AND OPINION OF SUBJECT ................................................... 135 TABLE 6.11 BEHAVIOR AND OPINION OF SUBJECT.................................................... 135 TABLE 6.12 THE SUMMARY OF THE QUALITATIVE DATA OF CONSTANT CATEGORY ... 137 TABLE 6.13 DISTINGUISHING RULE OF SCORE .......................................................... 138 TABLE 6.14 THE SUMMARY OF THE DECREASING CATEGORY ................................... 138 TABLE 6.15 THE SUMMARY OF THE QUALITATIVE DATA OF DECREASING CATEGORY 139 TABLE 6.16 THE SUMMARY OF THE PROPOSITION 3 ................................................. 141 TABLE 6.17 DESCRIPTIVE STATISTICS ...................................................................... 143 TABLE 6.18 ONE-SAMPLE T TEST ............................................................................ 143 TABLE 6.19 SUMMARIZED FINDING FOR TEST OF CONSCIOUSNESS OF ADJUSTING.... 144 TABLE 6.20 DESCRIPTIVE STATISTICS ...................................................................... 145 TABLE 6.21 ONE-SAMPLE T TEST ............................................................................ 146 TABLE 6.22 BEHAVIOR AND OPINION OF SUBJECT ................................................... 146 TABLE 6.23 SUMMARIZED FINDING FOR TEST OF CONFIDENCE OF ADJUSTING ......... 147 TABLE 6.24 THE SUMMARY OF THE PROPOSITION 3-A............................................. 151. 立. 政 治 大. ‧ 國. 學. ‧. TABLE 6.25 THE SUMMARY OF THE PROPOSITION 4 ................................................. 153 TABLE 6.26 THE DESIGNED OPENING QUESTIONS OF INTERVIEW ............................. 154 TABLE 6.27 THE SUMMARY OF THE NEW SERVICE PROVIDERS’ SUGGESTION AND OPINION................................................................................................................... 155 TABLE 6.28 9-ITEM VERSION OF URICA FOR WILLINGNESS TO TRY THE SERVICE .... 159. sit. y. Nat. io. er. CHAPTER 7 CONCLUSION ................................................................................. 161 REFERENCE ........................................................................................................... 172. n. al. Ch. engchi. i n U. v. 12.
(13) CHAPTER 1 INTRODUCTION. 1.1 Background and Motivation The service business environment nowadays faces challenges as the new service’s quantity keep rising. In Service Profit Chain, if service providers want to let customer satisfy, they should provide attractive value service designed and delivered to meet targeted customers’ needs (James L. Heskett, 1994). There are some critical missions that business should overcome in advance. First, let human (potential users. 政 治 大 concern. Second, it is imperative to find a more effective way to assist human who 立. or target market) know the new service can increase utility value which they really. have to decide whether to accept the new service or not. For those conditions, in the. ‧ 國. 學. service provider’s view and they should find out the way to persuade target users of. ‧. new service to accept and act to user the new service. The critical thing is let their. y. Nat. target users know that the new service can bring them more benefits than the old ones. er. io. sit. or the old manners. If service businesses want to let their users know their product’s advantages, they should let their user trust they can gain more utility value in using. n. al. the new service.. Ch. engchi. i n U. v. Termed prospect theory, it has been extraordinarily influential. It is based on the method that human evaluate gains and losses from their current status. In an experiment, human adapt to the reduced light in a movie theater when entering it, then finding it not particularly dark after a few seconds, then readapt to the much brighter light outside when leaving the theater, and then finding it not to be unusually bright after a few seconds (Dawes, 2001, p.195). In the above example, in the former, the reference point is brightness of the movie theater before changing brightness. Thus, in the further, the reference point is the brightness of outside. In addition, the utility of above example is the feeling of brightness. But since choice might vary owing to 13.
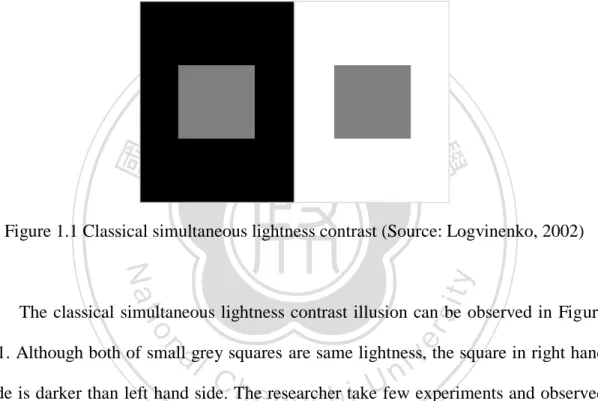
(14) outer environmental noise interference when considering gain or loss, it consequently cannot reveal the underlying preferences. From the above mentioned example we inference that human‘s current reference point is influenced by external environment. From the anchoring effect, the information of external environment would influence customer expectation (current reference point). In the following case (Figure 1.1), it presents the surrounding information will affect our perception.. 立. 政 治 大. ‧. ‧ 國. 學. Figure 1.1 Classical simultaneous lightness contrast (Source: Logvinenko, 2002). sit. y. Nat. n. al. er. io. The classical simultaneous lightness contrast illusion can be observed in Figure. i n U. v. 1.1. Although both of small grey squares are same lightness, the square in right hand. Ch. engchi. side is darker than left hand side. The researcher take few experiments and observed that the anchoring effect have critical influence in lightness perception in humans (Logvinenko, 2002). According to the last example, the influence of external environment includes the brightness of outside, weather and person who control light. As the same as other activities, human will be influenced by external environment when they position their expected outcome utility of activities. For example, when a new service is promoted, a ranking list of related services from some marketing research usually influences consumer expectation (reference point). In general, this list is usually dynamic. It 14.
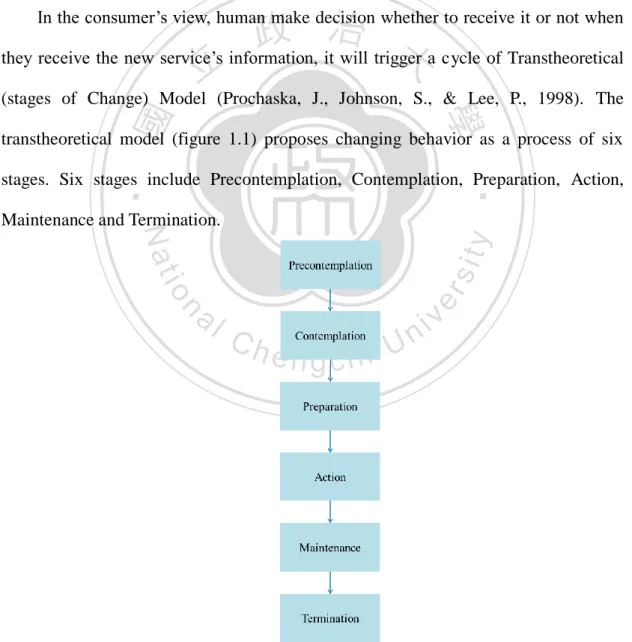
(15) causes consumers not to apply those information to evaluate benefit of new service, and even leads consumers to position an unsuitable expectation. Therefore, in this paper we propose a way which provides individual with an appropriate reference point of an uncertainty decision to let human can accurately evaluate the utility value. The individual reference point can overcome above problem. It can prevent human from having over-expectation or under-expectation utility value (e.g., monetary, time) about the acceptance of a new service). This method can assist service provides to effectively delivery their service to potential user.. 政 治 大 they receive the new service’s information, it will trigger a cycle of Transtheoretical 立 In the consumer’s view, human make decision whether to receive it or not when. (stages of Change) Model (Prochaska, J., Johnson, S., & Lee, P., 1998). The. ‧ 國. 學. transtheoretical model (figure 1.1) proposes changing behavior as a process of six. ‧. stages. Six stages include Precontemplation, Contemplation, Preparation, Action,. n. al. er. io. sit. y. Nat. Maintenance and Termination.. Ch. engchi. i n U. v. Figure 1.2 Stage of Change (Source: Prochaska, 1998) On the way from the second step to the third step of behavioral change cycle, it 15.
(16) called contemplation step to preparation step. Before human decide to have a plan to use new service and intend to take action in the immediate future, they must be aware of the pros of changing but also can identify the cons. In Neoclassical Economics, Expectancy Theory (Vroom, 1964) is applied to compute the utility value of the event’s outcome (the benefit that new service brings). This theory uses the pure value (for example, wealth, time and other things) of outcome to be the utility value. Expectancy Theory has a critical problem that the pure value cannot stand for human’s psychological utility value of view. For example, the meaning of gaining. 政 治 大 outcome will represent highly heterogeneous meanings to different individual persons. 立 four-hundred dollars to a billionaire is different from a beggar. That is, the same pure. In order to modify this shortcoming of Expectancy Theory, researches propose Moral. ‧ 國. 學. Expectation (Daniel Bernoulli, 1738). This method transform event’s outcome to. ‧. psychological value as utility value in the decision. In behavioral finance view, we. sit. y. Nat. find utility value evaluating from this method can not fit in every individual person,. io. er. because the same utility value is represented as different mental utility values for each of users. The behavioral finance’s scholars improve this drawback to develop Prospect. al. n. v i n Theory. The theory evaluates C the utility value of uncertainty event via individual hengchi U. reference point which can distinguish individual persons by their loss aversion (Kahneman Daniel, and Amos Tversky, 1979). In “Thinking, Fast and Slow” (Kahneman, 2011), it mentioned an experiment about reference point. There are three bowl of water, from left to right, iced water, room-temperature water and warm water respectively. Put left and right hand into the iced water and warm water respectively, then put both of them to the room-temperature water. The left hand feels warm, on the contrary, the right hand feels cold. It is the same to evaluate the utility value about an outcome. In the situation of 16.
(17) making decision of uncertainty event, the common reference point is status quo. But human also can regard anticipated outcome to be the reference point, which is usually influenced by psychological factor, factor of environment, society and other things that decision makers concerns (Kahneman, 2011).Therefore, we develop a way to interact with human a few times and then compute the appropriate reference point (in this paper, called new reference point) to the user (decision maker) who is considering whether to accept the new service. After above, we apply new reference point to compute the utility value, and represent the positive utility value (gain) to user. Let. 政 治 大. user know accepting new service is really good to him/her, making user willing to accept new service.. 立. Totally based on individual factors and both concern factors of environment, this. ‧ 國. 學. method can bring highly effectiveness to decision maker in making a decision on. ‧. uncertainty situation about the adoption of a new service.. n. er. io. sit. y. Nat. al. Ch. engchi. i n U. v. 17.
(18) 1.2 Research Question From decision maker’s evaluating outcome format we know that decision’s utility value is highly related to two parts: (1) loss aversion and (2) probability sensitive. The exiting knowledge further shown when decision maker evaluate the uncertainty event’s outcome utility value not based on the outcomes of decision, stead of it involving the gap between decision maker’s expected utility value on outcome and the outcome’s real utility value (Kahneman, 1979). When human make a decision on an uncertainty event or consider whether. 政 治 大 current situation and situation after changing (Scholl, 2002). Until make sure to accept 立 accept a new service, they must compare the cons, pros and utility value between the. the new service will better than another option, they tend to act to accept and use the. ‧ 國. 學. new service.. ‧. In this research, we aim at the issues about effective evaluating method of. sit. y. Nat. computing mental utility value development which are illustrated as below:. io. er. (a) Whether providing a high-quality new service expected to eliminate the gap 5 analogy and can change the human’s behavior (willingness to accept new service) and. n. al. increase their utility value?. Ch. engchi. i n U. v. In Cumulative Prospect Theory, human have a reference point which is influenced by human expectation, environment and society and so on (Albert Bandura, 1977). It is used synonymously with the term current reference point to mean the reference point is generated by decision maker’s intuition. Then take current reference point as the balance point to compute the gain and loss from the decision. But, current reference point usually is not appropriate enough to represent the decision maker’s status quo. When human face an uncertainty event, fast thinking (system 1) (Daniel Kahneman, 2011) usually lead human jump to conclusion and affect their decision. There exists a thinking bias to make human can’t accurately evaluate utility value. For 18.
(19) example, focusing effect, the tendency to place too much importance on one attribute; impact bias, tendency to overestimate the length or the intensity of the impact of future feeling status, and so on. Because of thinking bias, decision makers usually overestimate or underestimate the expectation of decision outcome. Compared with prospect theory, the method which proposed by our study, pick up the high-weight attribute (e.g., time, monetary) and via a series of step to find out the new reference point. The new reference point is generated based on the decision maker’s psychological value, psychological behavior and other decision maker concern. We. 政 治 大 position suitable expectation. Let decision making under a suitable expectation, we 立 anticipate it can reflect the individual real situation, and it can help decision maker. expect that this way can bring decision maker more utility value.. ‧ 國. 學. (b). Is quality of expected service influenced by individual loss aversion? Do each. ‧. attribute have own value function?. sit. y. Nat. There are lots of attributes that should be considered in the moment at which. io. er. human are making decisions on uncertainty event, such as the amount of monetary, the cost of wasting time, material, self-principles or regulations and others dependent. al. n. v i n on event. Most weight, priorityC and level of loss aversion h e n g c h i U are changing over human’s value, behavior, culture, even over time. Individuals usually care different things,. someone care money more than time, and vice versa. Everyone focuses on different aspects (attributes) in the same event, thence they have different levels of loss aversion on different attributes. In addition, the attributes which an individual concerns depend on event. How to generate the right value function to the right attribute to the right person in order to accurately evaluate the utility value is a critical issue.. 19.
(20) 1.3 Research Method In this study, we would like to develop an individual autonomous service evaluation platform that can be achieved by taking advantage of human like bounded rationality in decision making and abstractive representation of platform components related to human’s mentality, environmental factors, factors of new services and others each target users of new service concerns when they face an problem of acceptable new service. Owing to some features of Cumulative Prospect Theory we use it as the base of the system.. 政 治 大 Prospect Theory is a behavioral finance that elaborate the manner that human 立. (a) Prospect Theory. choose between the certainty result and probabilistic alternatives that involve risk, that. ‧ 國. 學. the probability of every outcome are known. It is used to evaluate mental utility value. ‧. when human make decisions (decide whether accept new service or not). Decision. y. Nat. maker are not totally rational in uncertainty situation, therefore prospect theory. er. io. sit. computing utility from decision maker’s mental characters, behavioral characters and others. By means of above way to reveal the irrational psychological factors which. n. al. Ch. influence the choosing behavior.. engchi. i n U. v. (b) Prospect Theory is individual based. Human make decision in an uncertainty environment, the utility of decision dependent on the gap between outcome’s status and decision maker’s expectation instead of the just outcome’s status. As a result of this point, human who evaluate utility of decision usually have own reference point, which usually represent individual’s current situation. Current reference point is influenced by the human’s values and behavior, which distinguish the gain and loss dimension. The decision’s utility value evaluating process is totally dependents on the individual decision maker’s mental factors. 20.
(21) Subject (individual) value function means value function generated by individual’s level of loss aversion about attribute. Individual has different level of importance about the same attribute. The level of importance affects the feeling of gain and loss and dependent on attribute. That is, level of loss aversion is a parameter in value function. In conclusion, individual loss aversion make individual value function. (c) Cumulative Prospect Theory In order to improve the prospect theory, cumulative prospect theory is an advance. 政 治 大 unlikely events, but underweight average events. The main modification to Prospect 立. development and variant of prospect theory. Human tend to overweight extreme in. Theory is that cumulative probabilities are transformed, rather than the probabilities. ‧ 國. 學. itself. CPT improves the weight function to compute weight of probabilities accurately.. ‧. The major point in Cumulative Prospect Theory is transforming object (public) Subject. sit. y. Nat. cumulative probabilities into subject (individual) cumulative probabilities.. io. er. (individual) cumulative probabilities mean that generated by human’s attitude (weight) when they face the probability of outcome in uncertainty situation. Cumulative. al. n. v i n Cutility Prospect Theory make evaluating becomeU individual, accurate, credibility h e nvalue i h gc and easily.. This study aims to provide a method that can position an appropriate reference point (expectation) for human, drawing upon human’s loss aversion to generate an individual value function and applying individual value function to demonstrate their gain and loss area. In addition, the method also generates probability function attained from the interactions with human a few times. With the value function and probability function, the method can then evaluate the utility value (benefit).. 21.
(22) 1.4 Purpose and Contribution In this study, we will assist service providers (business) to promote their service and help service receiver (consumer) to improve their evaluating mechanism. Not only help businesses deliver advantages of their service to potential consumers, but also help consumers have an appropriate and fit expectation on the uncertainty event. From Transtheoretical (stages of Change) Model (Prochaska, J., Johnson, S., & Lee, P. , 1998), Human usually spent a lot of time on evaluating whether the pro’s utility value is more than con’s utility value or not. We want to make human have. 政 治 大 cycle and make them can create more utility value from changing cycle. 立. highly effective changing cycle, make them can spend less time to complete changing. In this study, we focus on the evaluating procedure in changing cycle. Evaluating. ‧ 國. 學. procedure occurs in the contemplation step. After human finish and get the positive. sit. y. Nat. step.. ‧. consequence from evaluating action, they will move to next step, called Preparation. io. er. Therefore, in order to achieve the above benefits we should diminish the time of evaluating procedure and make human have further cognition about their. n. al. psychological concerns.. Ch. engchi. i n U. v. We also would like to build up a structure of system eliciting the individual value function and weight function to anticipate the more appropriate reference point and to evaluate the accurately utility value under uncertainty situation.. 22.
(23) 1.5 Content Organization This study is followed the framework of Design Science in Information System Research, which was proposed by Alan, Salvatore, Jinsoo, and Sudha on 2004 (Figure 1.3). In this framework, we could define the Environment of our research problem in Chapter one Introduction, and then we discuss researches to build the Knowledge Base what we did in Chapter two Literature Review. After that, in the IS Research part, we will develop a system to solve the relevant problem.. 政 治 大. 立. ‧. ‧ 國. 學. n. er. io. sit. y. Nat. al. Ch. engchi. i n U. v. Figure 1.3 Design Science Research Framework (Hevnor et al., 2004). There are five chapters comprised in the thesis proposal, the remainder proceeds as follows:. . Chapter 2 Literature Review Investigate the related research proposed by others, providing the theoretical. basis for this research. The investigated field of research includes quality of service, 23.
(24) gap of quality service, mental activities (system 1, system 2), prospect theory and cumulative prospect theory. . Chapter 3 Motivation Application Establish conceptual framework and system architecture of the BMIND. (Behavior Modification for Insightful Design) service system. Describe how the system operates to improve human willingness to accept new service. . Chapter 4 Research Method Establish the conceptual model framework of research which is followed by. 政 治 大 Chapter 5 Application Scenario 立. developing the system. . an application scenario, we. take. travel. (http://www.lazybox.com.tw/app) as an example.. LazyTrip. Chapter 6 Evaluation. ‧. . APP –. 學. ‧ 國. Illustrate. sit. y. Nat. In this chapter, we would propose some propositions in order to verify our goals,. io. findings will be discussed in the end of this chapter.. n. al. . Chapter 7 Conclusion. Ch. engchi. er. also assumptions are also raised. Then the results would be provided, and the. i n U. v. This chapter elaborates conclusions, limitations, and future work of this research. Subsequent scholars might get inspiration from future work, and extend the research to break up the limitations. Also the contributions are manifested toward academic and the real market.. 24.
(25) 1.6 Terminologies The main observation of Prospect theory is that human tend to think uncertainty outcome value usually relate to an individual reference point rather than final outcome’s status. Therefore, the gain means outcome value above the individual reference point, in other words, the loss means outcome value below the individual reference point. In computing procedure, value function and weight function are used to calculate the outcome value and weight of probability respectively. . Reference point means a balance point that is applied in evaluating the outcome. 政 治 大 expectation outcome value. The value function is defined on deviation from a 立. value. It is usually the individual status quo, but it can represent the human’s. reference point to distinguish gain and loss area.. ‧ 國. 學. . Value function means a function deviation from a reference point and it normally. ‧. concave for gain, commonly convex for losses. And it is generally steeper for. sit. y. Nat. losses than for gains. The indifferent between concave (gain) curve and convex. al. n. . io. 2011).. er. (loss) curve is influenced by individual loss aversion about outcome (Kahneman,. Ch. Weight function means a function represent. engchi. iv n human’s U. weight of probability.. Weighting function for gain (w+) and losses (w-) based on median estimates of parameters. Because prospect theory treats preferences as a function of decision weights and it assumes the weight don’t always correspond to probability (Plous, S., 1993). It modify in Cumulative Prospect Theory.. 25.
(26) 1.7 Limitations of the Study In this study, the category of “new service” is limited to Major innovation, Start-up business and New services for the market presently served from classification of new services (Johnson et al, 2000). There are two main categories of innovations, radical innovations and incremental innovations. Abernathy differentiated incremental from radical innovation (Abernathy, 1978), while illustrated a similar concept called continuous and discontinuous technological changes (Porter, 1986). The definitions are as follows (Bonomelli, 2010): . Radical innovations A radical innovation. 立. 政 治 大 requires completely new. knowledge (competence. departure from the normal technological trajectory. Incremental innovations. ‧. . 學. ‧ 國. destroying). New products and processes, emerged from unpredictable. sit. y. Nat. An incremental innovation builds upon existing knowledge (competence. io. er. enhancing). A series of small improvements to an existing product or product line that usually helps maintain or improve its competitive position over time.. al. n. v i n In our study, we focus on C that via procedure of U h e n g c h i behavioral change let human be. willing to accept new service. Based on above definitions, new service of radical innovations is more appropriate to apply in this study. If human decide to adopt a. discontinuous technological change (radical innovations), human usually make progress on the procedure of behavioral change and finish it. For example, Apple’s iTune is a radical innovations, it change human’s behavior of buying music. On the contrary, incremental innovations are progressing little by little. Even then human already adopted the new service (incremental innovations), they didn’t notice the change, for example, visible changes in appearances, rotatable screen of camera. There are three types in radical innovations, including Major innovations, 26.
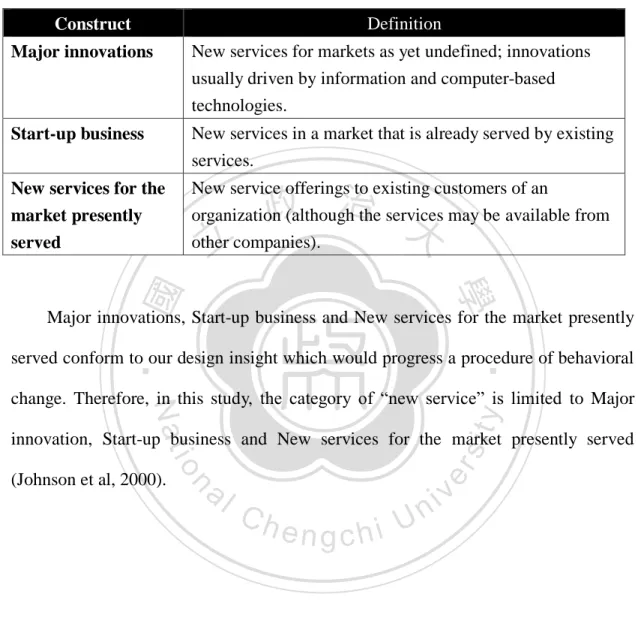
(27) Start-up business and New services for the market presently served. The definition of above innovations as follows: Table 1.1 The definition of new services of radical innovations (Source: Johnson et al., 2000) Definition. Construct Major innovations. New services for markets as yet undefined; innovations usually driven by information and computer-based technologies.. Start-up business. New services in a market that is already served by existing services.. New services for the market presently served. New service offerings to existing customers of an organization (although the services may be available from other companies).. 立. 政 治 大. ‧ 國. 學. Major innovations, Start-up business and New services for the market presently. ‧. served conform to our design insight which would progress a procedure of behavioral. sit. y. Nat. change. Therefore, in this study, the category of “new service” is limited to Major. io. al. n. (Johnson et al, 2000).. er. innovation, Start-up business and New services for the market presently served. Ch. engchi. i n U. v. 27.
(28) CHAPTER 2 LITERATURE REVIEW. In the previous chapter, we have showed our deep concern for identifying appropriate expectation especially in face of prompting new service. Some of the existing literatures provide us the basis with how the service receivers evaluate the service, for example, to compute the utility value (benefit) of new service or understand the thinking model of decision maker. Grounded on the prior knowledge, the relationship between behavior change, thinking mode, and gap of service quality are the support for our control of new service expectation setting:. 立. 2.1 Behavior change. 政 治 大. ‧ 國. 學. In the consumer’s view, human make decision whether to try new service or not when they receive the new service’s information, it will trigger behavior change. In. ‧. this research, our purpose is make human willingness to try new service. Therefore, in. y. Nat. io. sit. this section we refer the past research (Prochaska, 1998) to understand features and. n. al. er. drawback of stage of behavior change, in order to overcome the drawbacks and improve the efficiency of behavior change.. Ch. engchi. i n U. v. Behavior change is often a goal for staff working directly with constituents, organizations, governments, communities, or individual (Glanz, 1990). There are five stage of behavior change as followings:. Table 2.1 The definition of stage of behavior change (Source: AFAO, 1996) Stage. Definition. Pre-contemplation. In this stage, changing a behavior has not been considered; human might not realize that change is possible or that it might be of necessary to them.. Contemplation. Something happens to prompt human to start thinking about change, perhaps receiving information that change is 28.
(29) good for them or hearing someone had changed, resulting in the need for further change. Human prepare to start the desired change, and this requires gathering information, finding out how to achieve. Preparation. the change, ascertaining skills necessary, deciding when change should take place, talking with others to see how they feel about the likely change, considering what will be the impact of change and who will be affected. Human make changes, acting on previous decisions, experience, information, new skills, and motivations for. Action. making the change. Human practices are required for the new behavior to be consistently maintained.. Maintenance. 立. 政 治 大. In order to improve the efficiency of the behavior change, we find the stage with. ‧ 國. 學. longest time (about six months) is the contemplation stage (Patten et al., 2000;. ‧. Prochaska et al., 1992). Human in this stage weigh the pros and cons of making the change which can cause them to remain here for long periods of time (Patten et al.,. y. Nat. io. sit. 2000; Prochaska et al., 1992). When they determine to try new service can bring. n. al. er. benefit than risk and cost, they enter to Preparation stage. Due to human wasting. Ch. i n U. v. much time to evaluate whether change brings more benefit, our research helps human. engchi. make their preparation more efficient and more accuracy.. 29.
(30) 2.2 Decision making under uncertainty Uncertainty is essentially existent in most decision making and evaluating. For the problem of human appraising whether a new service is worth trying, it can be viewed as decision making in an uncertainty environment. A resolution is through some formula from behavioral finance such as Cumulative Prospect Theory (CPT). In this research, we want to improve accuracy of decision and diminish bias under uncertainty. Therefore, it is imperative to find out the level of uncertainty and identify the uncertainty to which this research belongs. Courtney (1997) indicated the. 政 治 大 are A clear-enough future, Alternate future, A range of future, True ambiguity. But the 立 four levels of uncertainty and describes how business make strategy. The four level. previous literature is applied in business-level decision, such as evaluate whether. ‧ 國. 學. entering emerging markets or developing emerging technologies, instead of leading. ‧. human to achieve maximum benefit of decision under uncertainty. In this research, we. sit. y. Nat. apply four levels of uncertainty on personal decision about trying new service. And,. io. er. how decision maker (user) face the uncertainty situation to manage their expectation and get maximum benefit. In highly uncertain business environments, what makes for. al. n. v i n C h issue. Some executives a good strategy becomes an important seek to shape the future engchi U with high-stakes bets. This section will describe four levels of uncertainty and try to. find the way to make strategy under uncertainty for business (Courtney, 1997). It is aimed to identify which level of uncertainty to which the act of trying new service would belong: (the diagrammatic presentation of four level of uncertainty is showed in Figure 2.1). 30.
(31) 政 治 大. 立. ‧ 國. 學. Figure 2.1 Four level of uncertainty (Source : Courtney, 1997). ‧ sit. y. Nat. Level 1: A Clear-Enough Future. al. n. strategy development.. er. io. At level 1, managers can develop a single forecast that is precise enough for. Ch. Level 2: Alternate Future. engchi. i n U. v. At level 2, the future can be described as one of a few alternate outcomes or discrete scenarios. In this level, analysis can’t forecast which outcome will occur, although it may help establish probability. Level 3: A Range of Future At level 3, a range of potential futures can be identified. That range is defined by a limit number of variables, but the actual outcome may lie anywhere along a continuum bounded by that range. The range included the gains and losses outcomes. Level 4: True Ambiguity 31.
(32) At level 4, multiple dimensions of uncertainty interact to create an environment that is virtually impossible to predict. In this research, we want to find the outcome of trying a new service under uncertainty environment. According to our observation, the outcomes of new service is more similar to Level-3. That is, the way that we identify outcomes is via a limited number of variables and the interactions with user in our service system. Outcomes including gain or loss are in a range of potential futures.. 2.3 Mode of thinking (system1 & system2). 政 治 大. When users position their expectation of new service, psychological activities. 立. which including two modes of thinking, system 1 and system 2 (Stanovich, West,. ‧ 國. 學. 2000) see the Figure 2.3, will start to operate to help user do decision. Previous research (Table 2.1) about thinking mode can bring us more knowledge about. ‧. psychological activities of user. System 1 and system 2 both influence user’s thinking. y. Nat. sit. (Figure 4.1), in here, we discuss about setting expectation of new service. These two. n. al. er. io. systems (system1 & system2) can’t be turned off, so we should take attention to them.. i n U. v. Therefore, we apply existing knowledge (operations of thinking mode, possible bias. Ch. engchi. and so on) to design our system and overcome their drawback. The drawback of thinking mode is usually existing bias. In this research, we via interaction and computing try to diminish bias of psychological activities and to achieve maximum benefit. In human’s psychology, there are existing two systems about their modes of thinking, system 1 and system 2. In recent ten years, mental systems were examined by psychologists. There are not really a “system” (for example, alimentary system) which must operate by a predicted process and interact to others. In human’s brain, it does not have a part called a system. System 1 and system 2 are virtual role in 32.
(33) human’s mentality. Appling the term to describe the mental mechanisms that make human understand their meanings easier is the purpose of these term strategy. A summary of the generic properties distinguished by several two thinking modes is presented in Table 2.2.. Table 2.2. The terms for the two systems used by a variety of theorists and the properties of dual-process theories of reasoning (Source: Keith Stanovich et. 2000). 立. 政 治 大. ‧. ‧ 國. 學. n. er. io. sit. y. Nat. al. Ch. engchi. i n U. v. System 1, is an automatic operation, fast, effortless. Even though it needs effort, it must use a little effort. It is not controlled by self (Keith Stanovich, Richard West, 2000). Ordered by degree of complexity, the followings are some examples about new services for system 1: . Detect one new service is more complex than another new service.. . When seeing the new service’s interface, reveal disgust and impatient. 33.
(34) . Understand the easy sentence in new service’s synopsis.. . Recognize and judge a descriptive sentence that belongs to which service domain.. These mental events are related to two human’s mode of thinking. They automatically appear, are effortless or use a little effort. The function of system 1 includes all nature characters’ skill. We naturally perceive surroundings, cognize staffs, concentrate on events, averse loss, and so on. Other mental activities become fast and automatic with keeping practice in a long-term. In system 1, human learn to. 政 治 大 explain and figure out the difference between different societal situations. But, system 立. connect two thinking modes (system 1 and system 2) and some skill. For example,. system 2 to access propose and help.. 學. ‧ 國. 1 can’t solve every problems or decisions. When system 1 face a challenge, it will call. ‧. In addition, system 1 usually exists bias and system 1 usually has systematic. sit. y. Nat. errors in some specific situation. System 1 usually keeps silent about major charges. io. er. while admitting minor ones. System 1 likes to respond easier questions, instead of answer the major questions. System doesn’t understand logic and statistic. Moreover,. al. n. v i n system 1 has a big drawback. C That is, system 1 never h e n g c h i U turns off. As the following. famous example (see Figure 2.2), we can know the difference between image (illusion) and belief (truth).. 34.
(35) Figure 2.2 the famous experiment of system 1 (Source: Muller-Lyer, 1889) Above is a general picture, there are two straight line, in the two side of lines with different direction fin shaped lines. Obviously, the bottom line is longer than top line as we see in the picture and we believe what we see. But, if we have ever seen this picture, which we know these two lines have same length. This a famous wrong impression that propose by Muller-Lyer (Müller-Lyer, 1889). If we use ruler to evaluate these two lines, we can know they have same length. In the above example, although our belief tells us that as long as these two lines, we “see” the bottom one is. 政 治 大. longer than above one. We choose to believe the evaluated result, but we can not avoid the operation of system 1.. 立. System 2 is much different from system 1. System 2 must use attention to do a. ‧ 國. 學. lots effort on mental activities. Its operations include complexity calculation. System. ‧. 2 is usually related to agent's choosing, attention and objective experiences. When we. sit. y. Nat. consider about ourselves, it represents we use system 2 to make decisions. It also. io. and how to do.. al. er. means conscious, rational, etc.. It has belief and it can choose, decide how to think. n. v i n C h the followingUare some examples about new Ordered by degree of complexity, engchi. services for system 2: . Search the memory to find out the some experience about relative service.. . Fill up the form.. . Compare within two services, determine which is more effective.. . Check a complex process of new service.. 2.4 Gap of service quality An essential process of service delivery is proposed by previous research (Parasuraman, Zeithamel and Berry, 1985). It indicates the gap of service quality 35.
(36) during the delivery procedure and the factor of expected service (Figure 2.1). It demonstrates the gap of service delivery and the problem about gap, which can help improve service quality. The reason why users don’t feel worth trying new service is usually about unfit expectation (Valarie A. Zeithaml, 1988). Service quality as perceived by consumers depends on the size and direction of an additional gap, also called expectation (gap 5 analogy in Figure 2.1). There are five gap in service quality, they exist in the service delivery process, from management perception to customer expectation. Therefore, in. 政 治 大 That is, expected service, proposes the composition of expected service to analyze 立. this research, our goal is giving user a more appropriate expectation on decision.. what reasons influence expectation of new service for user. But the expected service is. ‧ 國. 學. usually distorted, due to influence of factors of environment. Applying previous. ‧. literature (Parasuraman, Zeithamel,and Berry, 1985), this research wants to modify. sit. y. Nat. the composition of expected service according to user’s concerns. Making the. io. research.. al. er. expectation of new service to become more accurate for user is the purpose of this. n. v i n C hon service deliveryUpart to increase service quality. In this paper, we hope to focus engchi. That is, there are five dimensions about service quality, Reliability, Responsiveness,. Assurance, Empathy, Tangibles (Parasuraman, Zeithamel, and Berry, 1988). In the service delivery process, service quality is influenced by the gaps of service quality (Parasuraman, Zeithamel and Berry, 1985). Gaps make service quality decrease, cut down consumers received value from new service. Following Figure 2.1, there are five gap in improving the service quality process, first, Gap 1, the difference is between customer’s expected service and management perceptions of consumer expectations; Gap 2, the difference is between management perceptions of consumer expectations and service quality specifications; Gap 3, the difference is between 36.
(37) service quality specifications and service delivery; Gap 4, the difference is between service delivery and external communication to customers; Gap 5, the difference is between customer’s expected service and customer’s perceived service. Above gaps can reference following figure.. 立. 政 治 大. ‧. ‧ 國. 學. n. er. io. sit. y. Nat. al. Ch. engchi. i n U. v. Figure 2.3 gaps of service quality in human’s mental system (source : Parasuraman, Zeithamel, and Berry, 1985) Gap 5 is the reason that service fail. It is the last step in service process. There are four other gaps before Gap 5. But they contribute to Gap 5. Gap 5 is the challenge. It is the reason consumers do not willing to accept the new services. Even though the above four gaps are eliminated excluding Gap 5, the service still fails. The bigger the gap 5 exists, the harder to satisfy consumers. Users do not tell new service provider 37.
(38) what they expect or how they will perceive service. When human encounter a new service, they will have an expected service in their mind. The expected service is used to evaluating the benefit outcome about accepting new service. Human compare expected service and perceived service to determine which they gain or loss from new service. Expected service is related to three factor, word of mouth, personal needs and past experience (Parasuraman, Zeithamel, and Berry, 1988).. 立. 政 治 大. ‧. ‧ 國. 學 er. io. sit. y. Nat. Figure 2.4 the attribute of expected service. According to the description about system 2 (one of the thinking mode, system 2. n. al. Ch. is usually related to agent's choosing, attention. engchi. iv n and U objective. experiences.), we. inference that these three factors have dominant influence from operation of system 2. The followings will illustrate the relevance between three factors of expected service and operation of system 2 about accepting new service. . Word of mouth :. Word of mouth plays an important role in service. That are difficult to evaluate before consumer purchase or accept new service and before direct experience of new service. In tangible view, experts (including marketing analysis report, friends and family) are word-of-mouth sources. However, in intangible value, the social value (Sheth, Newma, Gross, 1991) of new service is also word-of-mouth 38.
(39) sources. Whatever tangible or intangible word-of-mouth can affect the levels of desired and predicted service (Customer expectations of service, p66). When human receive the positive or negative word-of-mouth about new service, they may go through choosing, comparing and other action that controlled by system 2. These activities are triggered by human’s consciousness.. . Personal needs :. The most important factor about desired or expected service level is personal. 政 治 大 understand the psychological and physical well-being of the consumers. Personal 立 needs. Personal needs are those status quo and conditions necessary to. needs are the pivotal factor which shaped what consumers desire in service.. ‧ 國. 學. Personal needs can be classified to many categories, including physical, social,. ‧. psychological and functional (Customer expectations of service, p60). Human. sit. y. Nat. apply their attention to think and be aware what they want and what they care. It. io. er. means that human perceiving their personal needs is a mental activity. That is, the activity is controlled by themselves, instead of automatic from intuition. We. al. n. v i n Ch can inference that the desire evaluating, requirement analyzing or other activity engchi U about generating personal needs are influenced by operation of system 2.. Because system 2 is responsible for mind computing (including memory, analysis, compare and so on). . Past experience :. Past experience, the consumer’s previous contact to service that is relevant to the new service which tends to promote to consumers. Past experiences is another force in shaping consumers’ desires, predictions and expected service. If consumer had used the similar services they would be compared with new service on quality, social value, cost and so on. For example, assume service 39.
(40) provider release a new reservation system. Thus, consumer probably compare the response time with all previous reservation systems they used. Consumers also compare across industries. Past experience, human search previous memory and compare, evaluate which one is better. These mental activities are belonging to the operation of system 2. In addition, the mental activities in this factor (past experience) are classified to the high-level operation in system 2.. 立. 政 治 大. ‧. ‧ 國. 學. n. er. io. sit. y. Nat. al. Ch. engchi. i n U. v. 40.
(41) 2.5 Cumulative Prospect Theory (CPT) In order to improve the prospect theory, cumulative prospect theory is an advance development and variant of prospect theory. In order to judge a decision whether it brings positive utility value, researchers propose methods to evaluate it. Among them, Cumulative Prospect Theory (CPT) is a method which computes utility value of decision according to personal perception (psychological value, probability weight). This method can help us compute utility value of new service. In this research, we apply the variables and formula in our process. Through interact with. 政 治 大 value of variable with bias. This way can increase the accuracy of utility value. 立. user to get the value of variable make result more accurate, instead of directly use the. In order to assess the utility value of a decision for individual, researches. ‧ 國. 學. improve the existing way (expected utility theory, prospect theory) to propose. ‧. Cumulative Prospect Theory. It, as a tool, is applied to compute benefit of trying new. sit. y. Nat. service in this research.. io. er. Expected utility theory existed for many decades as the dominant normative and descriptive model of decision making under uncertainty, but it has come under some. al. n. v i n C h 1992). It proposed (Tversky, human engchi U. questions in recent years. evaluate utility of. decision by value of outcome. For example, there are two person, a poor and a rich, and they both gain 10 dollars from a decision. In the expected utility theory, it declares they have same utility in above situation. But it has some bias in this point because the utility that human really feel is usually the situation in which the poor feel more than the rich. Since they have different status quo (reference point) in this event, the theory can not use the same standard to present the utility of individual. Therefore, there is a general agreement that the theory does not provide a sufficient description of individual choice. CPT comprises above observations in modification of Expected Utility Theory 41.
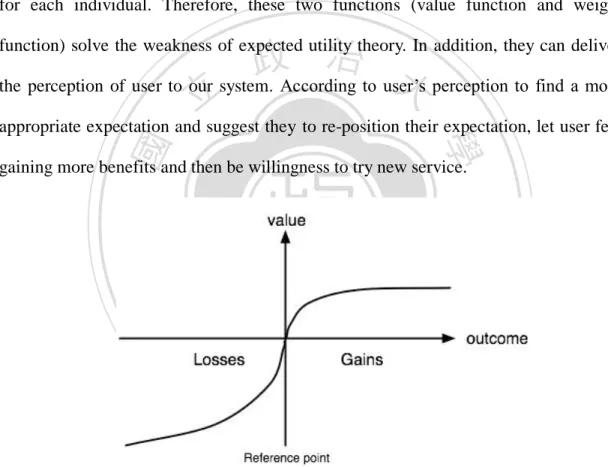
(42) via replacing final value with outcomes relative to the reference point (expectation), replacing the utility function with a value function (see Figure 2.5) that depend on outcome, and replacing probabilities with weighted cumulative probabilities, also called weight function (see Figure 2.6). These two functions (value function and weight function) is generated from interacting with user; so they can represent the psychological value (Tversky, Kahneman, 1992) and attitude of probability weight of user. Regarding as psychological value, it means the subjective value of each attribute for each individual. Therefore, these two functions (value function and weight. 政 治 大 the perception of user to our system. According to user’s perception to find a more 立 function) solve the weakness of expected utility theory. In addition, they can deliver. appropriate expectation and suggest they to re-position their expectation, let user feel. ‧ 國. 學. gaining more benefits and then be willingness to try new service.. ‧. n. er. io. sit. y. Nat. al. Ch. engchi. i n U. v. Figure 2.5 Value function in CPT (Source : Tversky, Kahneman, 1992). 42.
(43) Figure 2.6 weighted cumulative probabilities function in CPT (Source : Tversky, Kahneman, 1992). 立. 政 治 大. ‧. ‧ 國. 學. n. er. io. sit. y. Nat. al. Ch. engchi. i n U. v. 43.
(44) CHAPTER 3 MOTIVATING APPLICATIONS. BMIND is consisted of Behavior Modification for Insightful Design. The objective of the BMIND research project aims at helping people achieve intentional behavior change that can help result in transformative service innovation (i.e., the industrial or societal changes, moving beyond design being simply creating new values or improving existing values for narrowly targeted customers). When human receive promotion of new service (information, description of features of new service),. 政 治 大 engaging customers to think about modifying their existing behaviors into ones that 立. it will trigger an intentional behavior change. Intentional behavior change is about. would enable and sustain the new value capture on the part of customers. This project. ‧ 國. 學. will develop a generic intentional behavior change framework featuring a set of. ‧. methods and models to facilitate intentional behavior change towards transformative. sit. y. Nat. service innovation. The role of this research is responsible for finding an appropriate. io. n. al. er. expectation positioning of new service during medium of intentional behavior change.. Ch. 3.1 Conceptual Framework of BMIND. engchi. i n U. v. BMIND service system is a set of approaches that aim to help human finish the intentional behavior change in the terms of three core procedure (Preference Analysis, Appropriate Expectation Positioning and Visualization-based Cognition Behavior Reframing). In BMIND service system, the three procedures have to include the five stage of intentional behavior change cycle that is comprised of Pre-contemplation, Contemplation, Preparation, Action and Maintenance. In addition, in each procedure based on different academic domain to apply the existing knowledge to design BMIND service system. Figure 3.1 then demonstrates the conceptual framework of BMIND. 44.
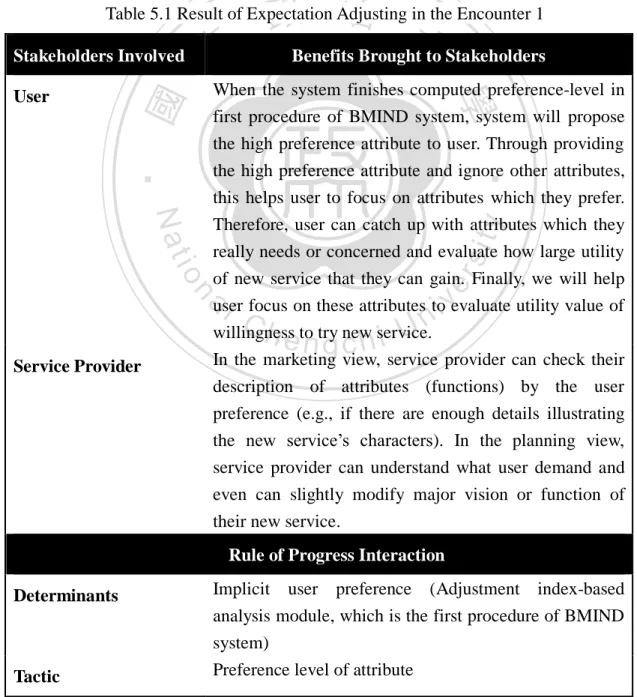
(45) Procedure of BMIND service system Visualization-based Cognition. Appropriate Expectation. Preference Analysis. Behavior Reframing. Positioning. Behavior Economics. Psychology. Communication. Existing Knowledge (Academic domain). 立. 政 治 大. Pre-contemplation Contemplation. Preparation. Action. Maintenance. ‧. ‧ 國. 學 Trans-theoretical Model. sit. al. er. io. 3.1.1 Preference Analysis. y. Nat. Figure 3.1 Conceptual Framework of BMIND. n. v i n C h Model, user who According to the Trans-theoretical are not considering a change engchi U. means user in the stage of pre-contemplation. Moving out the pre-contemplation stage. is the starting point of the whole behavior change process. From the point of view of accepting a new service, user in the stage of pre-contemplation may yield to their current state and have no intention to use a new service. They are under-informed about the benefits they will gain if they accept the new service. Therefore, in order to build a generic intentional behavior change framework to help people change their behavior, understanding the reason why these people still stay in the stage of pre-contemplation is significant. The purpose of this procedure is to collect the data that can describe the current 45.
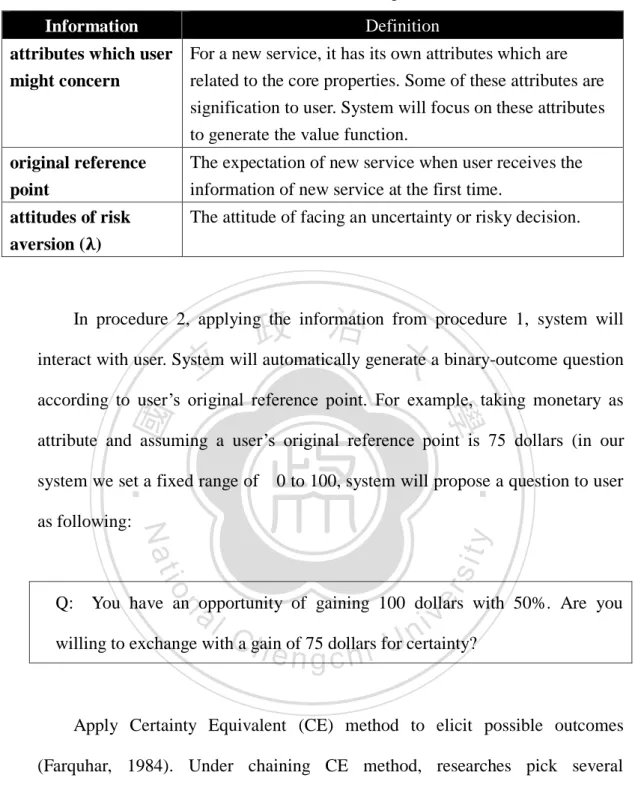
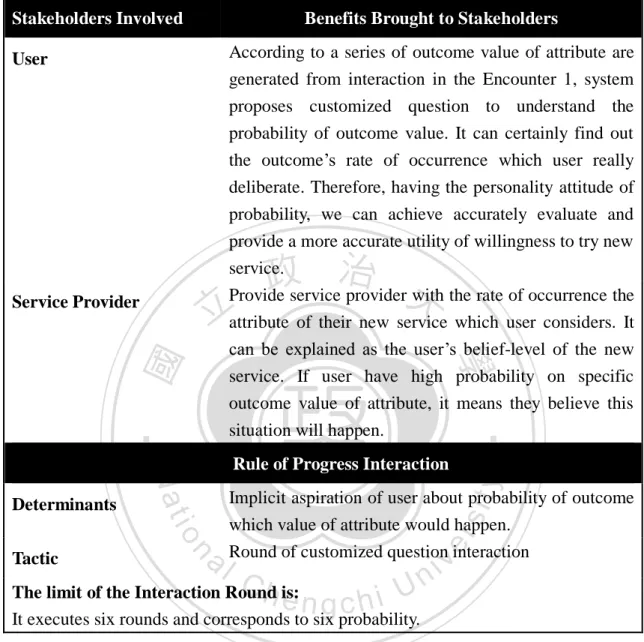
(46) state of the user in the first stage. First, system needs to understand user’s current mental states that illustrate the hypothetical state or process that correlates to feeling and thinking, consisting of a group of mental representations and propositional attitudes; so we can find the factors that affect the process of decision making of accepting a new service. To achieve goal, based on psychological methodologies, we develop a preference analysis module of the new service and try to use the result to build a mental state model for each user. After building the models, system can analyze them in the procedure and help user raise their consciousness of the need to. 政 治 大 The attribute preferences will be delivered to next procedure as user’s mental 立. change and move to the next stage of change.. information. The term of subjective perceived attribute importance in the conceptual. ‧ 國. 學. model (See 4.2) of second procedure of BMIND system is represented the attribute. ‧. io. sit. y. Nat. 3.1.2 Appropriate Expectation Positioning. er. preferences.. According to Trans-theoretical Model, user who in the stage of Contemplation. al. n. v i n CUnless evaluate the utility of changing. guarantee the pros is more than cons U h e nthey i h gc. bringing from behavior change, they don’t quit evaluating and still staying in this. stage. Therefore, the most important mission in stage of Contemplation is “evaluating”. From the point of view of using a new service, the users in stage of Contemplation compute the utility of new service, unless they guarantee the benefit is more than cost bringing from accepting new service. In order to build a generic intentional behavior change framework to help people change their behavior, BMIND helps user find appropriate expectation and improve the efficiency of evaluating. Based on the domain of behavior economics to design and to solve the problem of inappropriate expectation of new service for user, BMIND provides an interacting 46.
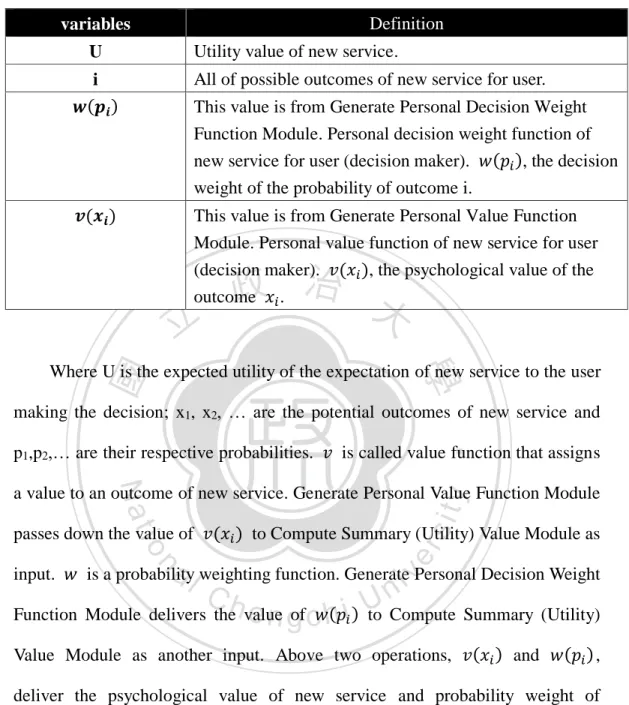
數據
+7
相關文件
We have derived Whitham equations to the SGN model and show that they are strictly hyperbolic for arbitrary wave amplitudes, i.e., the corresponding periodic wave trains
during daytime. The barn owl is endangered because people are moving to barns and also because mice eat chemicals and the owls eat the mice and they die. 57). Stage 2:
Then they work in groups of four to design a questionnaire on diets and eating habits based on the information they have collected from the internet and in Part A, and with
• Given a direction of propagation, there are two k values that are intersections of propagation direction and normal surface.. – k values ⇒ different phase velocities ( ω /k)
Stage 6 Special Program of Study – Personal Development, Health and Physical Education Life
Stage 6 Special Program of Study – Personal development, health and physical education life
• Meeting time: Allows students to use a very fast an d easy way, in order to check meeting time with tea cher or TAs... Revised
In particular, if s = f(t) is the position function of a particle that moves along a straight line, then f ′(a) is the rate of change of the displacement s with respect to the
