Clean Development Mechanism in North-South Trade
Lo, Chu PingDepartment of Agricultural Economics National Taiwan University
Abstract
Purpose- There is great conflict between some developed countries and developing
countries (e.g., the U.S. vs. China) regarding attitudes toward reducing global
warming. In this paper, I argue that open trade doesn’t necessarily increase world
pollution if Clean Development Mechanism (CDM) is generously undertaken and if
the CDM devotes considerable real resources in transfers of the associate abatement
technology.
Design/methodology/approach- The impacts of trade on environment can be
decomposed into scale, technique and composition effects. In this paper, I incorporate
abatement assets into Copeland and Taylor’s (1994) model to argue that the technique
effect stems from an increasing in pollution taxes and in international diffusion of
abatement technology; however, the former is fully offset but the latter is facilitated
by the CDM.
Finding- While world pollution is jointly determined by the composition and
technique effects, in contrast to literature, open trade doesn’t necessarily increase
Originality/values- Currently, there are more about one half of the CDM projects that
allocate no real resources in technology transfers. This study addresses how voluntary
investment of the CDM from the North (e.g., the U.S.) to the South (e.g., China)
might reduce pollution on a global level only if having “generously” technology
transfer.
Keywords Kyoto Protocol, Clean Development Mechanism, Pollution, Trade.
Paper Type Research paper
1. Introduction
Copeland and Taylor (1994) applied the framework of Dornbusch, Fischer, and
Samuelson (1977) to examine the linkage between trade and environment. In their
model, open trade allows the principles of comparative advantage to determine the
global pattern of trade and location of production, making the developed countries
specialize in lower pollution goods while the developing countries specializes in
higher pollution-intensive goods. The impacts of trade on environment can be
decomposed into scale effect, technique effect and composition effect. In their model,
open trade drives some marginal industries that are more pollution-intensive than the
existing industries in the developed countries to the developing countries; however,
these relocated industries are less pollution-intensive than the existing industries in
the developing countries. As a result, the average pollution intensity in the developed
countries decreases while that in the developing countries increases with the open
trade, which is so called the composition effect.1 Copeland and Taylor (1994) argue
that the composition effect, driven by foreign direct investment (FDI) due to open
trade, always dominates while the rest are fully offset, leading to a higher level world
1
The scale effect measures the increase in pollution created by an increase in the aggregate incomes and consumption, holding constant the techniques of production and the composition of final output. The technique effect reflects the reduction in aggregate pollution arising from a switch to less
pollution in the aggregate.
However, although open trade leads to an increase in aggregate production and
consumption (income effect) and shifts the pollution-intensive industries from the
developed to the developing countries (composition effect), it is feasible to argue that
the open trade does not necessarily increase world pollution if the developed countries
are generously devoting resources in the transfer of advanced technology in pollution
abatement associated with the increase in trade and investment (technique effect).
Therefore, I apply the technology transfer scheme to Copeland and Taylor’s (1994)
model to address, in what circumstances, the technique effect may dominate the
income and composition effects regarding to pollution abatement.
Global warming, which is largely due to the human pollution of greenhouse gas
emissions, has received great attention in the media recently. For the sake of climate
protection, the majority of the world reached an international agreement on reduction
in greenhouse gases, the Kyoto Protocol. As part of this agreement, industrialized
countries promised to reduce their collective emissions of greenhouse gases by 5.2%
compared to 1990, with the commitment period specified from 2008 to 2012.
Unfortunately, the domestic compliance costs (payment for emission reduction
permits and carbon credits) are substantially high compared to the benefits of
a global public good to free riders (e.g., unconstrained countries and countries outside
the Kyoto agreement),2hindering most developed countries from achieving their
self-imposed emission targets such that the Kyoto Protocol has little effect (van
Kooten, 2003; Böhringer and Vogt, 2006; Barrett, 2009).
Furthermore, there is great conflict between some developed countries and
developing countries (e.g., the U.S. vs. China) regarding attitudes toward reducing
global warming. At the heart of the current conflict between the U.S. and China in
regards to the issue of global warming is that those who polluted the world first (i.e.,
the developed countries) should take more responsibility for fixing the global
warming issues until the developing countries catches up in terms of economic
development. While developing countries (e.g., China and India) have little role in the
historic emissions and need space for economic development, developed countries (e.
g., the U.S.), are responsible, both historically and currently, for the majority of
greenhouse gases emissions, are stressing that the developing countries should also
presently take binding targets of emission cuts because of their rapid economic
growth, leading to conflict.
In order to mitigate the conflict and to reduce greenhouse gas emissions
2
For example, van Kooten (2003) estimated that the annual compliance cost for Canada ranges conservatively from $2.9 billion to about $6.2 billion, while the cost for Japan ranges from $17.5 billion to about $412.2 billion, and the cost for the Netherlands ranges from $900 million to about $2.44 billion. However, alternatively, these countries can generously transfer their clean and advanced
corporately, the Clean Development Mechanism (CDM) was designed to allow the
developed countries (called Annex 1 countries) to invest in projects that reduce
pollution emissions in the developing countries. This is an alternative to more
expensive pollution reductions in their own countries, thereby providing a
cost-effective alternative to the binding commitments. For example, if the voluntary
measures (e.g., CDM) are successfully undertaken by Japan, the total compliance
costs would be reduced by about 13% in comparison to relying solely on domestic
measures (van Kooten, 2003). Most importantly, the aim of this specific design is to
encourage investment and technology transfer from the developed countries to assist
the developing countries in achieving sustainable economic development by enabling
necessary economic growth, while also contributing to the stabilization of greenhouse
gas pollution in the atmosphere by the technique effect (Willis et al., 2006; Ellis et al.,
2007).
The CDM projects have increased substantially from 64 projects and about 100k
tons in expected certified emissions reductions (CERs) by 2012 in January 2005 to
2647 projects and about 2300 Million tons in expected certified emissions reductions
in November 2009 (Schneider et al., 2008). The soaring increase in the CDM projects
can, contrary to initial doubts about its potential, be a key pillar on a future regime to
existing low-carbon technologies for the reduction of emissions while having
sustainable economic development (UNFCCC, 2007; Capoor and Ambrosi, 2007;
Schneider et al., 2008).
Moreover, Seres et al. (2009) have examined 3,296 registered and proposed
CDM projects, and have found that roughly 36% of the projects involve technology
transfer. They further have found that 53% of the projects claim both equipment and
knowledge transfers, while about 32% of the projects that claim technology transfer
involve only equipment imports, and 15% of the projects involve transfers of
knowledge alone. The transfer of abatement technology, in terms of equipment and
knowledge, accounts for a significant share of emission reductions.
In real practice, Chinese government’s policy has a priority is to obtain advanced
technology from Annex 1 countries, however, this orientation conflicts with the
interest of foreign technology transfer who favor selling their own equipment to
maximum profits. As a result, China has undertaken the greatest number of projects
and reported the largest emission reduction on the global CDM market, while the
CDM projects involving technology transfer in China is still small (Wang, 2009).
Therefore, in this current model, I only refer the intangible knowledge, which is
non-rival goods, to abatement assets.
problems inherent to the Kyoto Protocol, which requires the developed countries to
voluntarily provide climate protection as a global good, but to address how voluntary
investment with corresponding technology transfer might reduce pollution on a global
level. Therefore, I develop a simple model by incorporating abatement assets into
Copeland and Taylor’s (1994) model, where the developed countries (i.e., the North)
voluntarily transfers clean technology to the developing countries (i.e., the South) in
order to fulfill the commitment to environmental protection. On one hand, the
composition effect after open trade increases pollution levels in the South, but on the
other hand, the technique effect due to the transfer of clean technology reduces
pollution levels there. In aggregate, the net impact of the two effects on pollution
levels in the developing countries is ambiguous, and may lead to an aggregate
reduction in world pollution if the technique effect dominates. Note that, in Copeland
and Taylor’s (1994) model, the composition effect due to open trade always
dominates such that the world pollution in the aggregate has to increase with an
increase in trade and FDI. However, in this current paper, I argue that it is not
necessary for world pollution to increase with an increase in trade and investment if
technology transfer is generously undertaken.
The paper is organized as follows. In Section 2, I revisit Copeland and Taylor’s
Section 4 demonstrates how technique effect due to CDM transfers affects world
pollution after open trade. Section 5 concludes.
2. The Model
In a world where the North is highly developed and the South is less developed, there is a continuum of private consumption goods, indexed by z[0,1]. The output of a
consumption good z is a function of pollution discharge (d) and labor input (l) . In
the following analysis, the Southern variables are indicated by an asterisk.
Copeland and Taylor (1994) first define the production function as
) ( )
(z ( )l z
y z y , where 0 is a constant factor and (z) is a parameter with a limitation of 0 ( )z . The total labor supply is exogenously given and is 1
allocated into either production or pollution abatement in each sector z as
) ( ) ( ) (z l z l z
l y a , where l is the amount of effective labor assigned to production y
and la is the amount of effective labor assigned to abatement. The unconstrained
level of pollution is defined as d0(z)(1)y(z)ly(z), which determines the amount of pollution generated in the absence of any abatement activity. Particularly, they design an abatement technology as
1 1 0 0 0 1 0 ( ) [ , ( )] ( ) [ ] [ ( ) ] a a d y A l d y d y d y l ,
which reflects diminishing returns to abatement activity while the A l d y[ ,a 0( )] is
concave in la and is asymptotic to d y0( ). With A[0,d y0( )] , the abatement 0
Combining these above set-ups, the pollution discharge by a representative firm is given by ( , , ) 0( ( )) [ , 0( ( ))] [ 1 ]1 ( ) a a a y y d y l z d y z A l d y z l l , which reduces in
labor assigned to abatement (i.e., la) but increases in output of goods (i.e., y ).
Rearrange the pollution discharge equation, Copeland and Taylor (1994) obtain their
output function: y(d,l;z)l1(z)d(z) if d l, but ( , , )y d l z otherwise.0 3 I extend Copeland and Taylor’s (1994) model by introducing abatement assets. In
this extension, each country is endowed with a stock of abatement assets that can be
freely allocated across all production sectors as H
zh z dz ~ 0 ( ) and
1 ~ * * ) ( zh z dz Hfor the North and South, respectively. Here, h(z) is the sector abatement asset in
sector z , and the North possesses much more abundant abatement assets compared
to the South, that is, H H*. In order to employ the endowed abatement assets in a
specific sector, I rewrite the abatement technology in Copeland and Taylor’s (1994)
model: s s a a e h l d d d z y d h l A 1 1 1 1 1 0 1 0 1 0 0 ] ) ( ) ( [ ))] ( ( ; , [ , (1)
where 0 s1. Intuitively, a country that is endowed with a greater stock of
abatement assets should present a higher efficiency in any sector abatement
technology if the abatement assets generate positive knowledge externalities to other
3
Copeland and Taylor (1994) assumed y d l1 ly
. With ly0 and la 0, we must have 1
y
sectors. Here, I apply the term
s
1
to represent the impact of the externalities
generated by the aggregate abatement assets, which is increasing diminishingly in the aggregate abatement assets (i.e., s H( )0 and s H( )0), but is irrelevant to a
sector abatement asset h. This is a key assumption in this model, which will be
discussed in more detail below. Furthermore, as implied in (1), the abatement function is concave in l and a h, reflecting an assumption of diminishing returns to
abatement activity: 0 a e l A , 2 0 2 a e l A and 0 h Ae , 2 0 2 h Ae . We also have 0 )] ( ; , 0 [ h d0 y
Ae and Ae[la,0;d0(y)]0 if no dedicated labor or sector assets are
allocated to abatement.
With the assumptions of y(z)(z)ly(z) and d0(z)(1)y(z)ly(z) that are made by Copeland and Taylor (1994), equation (1) can be rewritten as
s s a e h l y d z y d h l A 1 1 1 1 1 0 0( ( ))] [( ) ] ; ,
[ . In order to show the presence of positive abatement asset externalities, we must have Ae Ae s 0
H s H , which requires 0 e A s
while we already have s H( )0. With 1 s 0, the inequality 0
e
A s
holds if d h.4 Thus, in this paper, I assume d h to ensure positive knowledge externalities exist in the abatement technology, leading to Ae 0
H
. It is also reasonable to argue that the efficiency of abatement technology improves
4
The equation (1) can be rewritten as s e h l y h d A 1 1 0 ( ) . The inequality Ae 0 s holds if y
diminishingly with an increase in the abatement assets as 2 2 0 e A H , which echoing with the key assumption of s H( )0 and s H( )0.
The pollution discharged after abatement is given by d d0Ae. Incorporating
the pollution emission d into equation (2), we obtain the production function as
y (dsh1s)(z)(l)1(z) if ld, (2) but ( , , )y d l z otherwise.0 5 The labor/pollution combination that minimizes costs
for a firm satisfies
wl d z z s ( ) 1 ) ( , (3)
where is the pollution tax in the North and is larger than the South’s pollution tax
as . Here, * w is the wage rate. Implication in (3), the share of pollution charges in the cost of producing good z is always ( ) z , where ( )z is to 0
order the goods in terms of increasing pollution intensity. 6
Being derived from (2), the abatement asset and pollution combination that
minimizes costs satisfies
rh d s s 1 , . (4) z The total cost of pollution handling for a firm consists of a tax payment for pollution
discharges (i.e., ) and the costs of employing abatement assets (i.e., d rh). The 5 The relation y (d hs 1 s) l1 ly l leads to a limitation of 1 s s d h l
. On the other hand, we already assume d to ensure that positive knowledge externalities exist. The intersection of the h
two inequality is . l d
6
share of pollution charges in the total cost of handling pollution is always s for all
z, that is, s is irrelevant to z . Here, r is the return to the abatement assets, which
is the same for all sector while we have already assumed that the abatement assets are
freely allocated across all production sectors. That is, r is determined by a country’s
aggregate abatement assets while the individual industry just takes the price of
abatement assets as given. Considering that the pollution tax rates and the returns
to abatement assets r are uniform within a nation, the equilibrium in (4) then
implies that 0 0 ( ) 1 ( ) z z d z dz s D s r h z dz rH
, (5) where 0 ( ) zD
d z dz denotes aggregate pollution in the North. An implication of (5)is that, ceteris paribus, the more a country is endowed with abatement assets, the less
the aggregate pollution, and the smaller the share of abatement costs in the total cost of handling pollution, as indicated by s H( ) . It echo our key assumption that the 0
s captures the impact of positive externalities generated by a country’s aggregate
abatement assets, and pollution supposedly reduce with an increase in the aggregate
abatement assets diminishingly.
3. Equilibrium
among consumers of both the North and South, where the share of spending on each
good is constant, as in the model of Dornbusch, Fischer, and Samuelson (1977). The
utility function specified by Copeland and Taylor (1994) is then given by
D dz z x z b U
1 0 ( )ln[ ( )] , (6) where )x(z is the consumption of good z , )b(z is the continuum counterpart tothe many-commodity budget share, and
1 0b( dzz) 1. Here D denotes total pollution discharged in this country, and 1 denotes that the marginal wiliness to
pay for pollution reduction is a non-decreasing function of pollution levels. To
simplify matters, both the North and South are identical in size and in population
density, and pollution has only a local effect, so that the damage caused by pollution
has similar effects in both countries, as indicated by * 0.
Maximizing a consumer’s utility function with the consumer’s budget constraint
leads to an indirect utility function of a consumer:
D L I dz z p z b dz z b z b V
1 0 1 0 ( )ln[ ( )] ( )ln[ ( )] ln( ) , (7) where )p(z is price of good z , I denotes national income of the North, and Lrepresents total labor supply in the North. The North’s government chooses its
pollution tax by taking consumer and producer behaviors as given by maximizing
the indirect utility with respect to :
LVD VI D I 1 , (8)
where Copeland and Taylor (1994) assume the prices p(z) as given while choosing
the pollution tax. Equation (8) shows that “pollution taxes are increasing in income
since environmental quality is a normal good, and nondecreasing in the aggregate
pollution level since the marginal rate of substitution between consumption and
pollution is nondecreasing.” (Copeland and Taylor, 1994). Similarly, the pollution tax
in the South is given by * D*1I*. With DD*, I and I* , Copeland 1 and Taylor argue in equilibrium. *
Following a standard methodology, we can derive the unit cost function from
equations (2) and (3) as ( )(1 ) ( ) 1 ( ) 1 ( )(1 ) 1 ( )(1 ) 1 ( )(1 ) ( , , ; ) ( , ) ( ) z s z z z s z s z s c w h z s z h w A , (9) where 1 1 1 (1 ) ( , ) [(( ) ( ) ) ] 1 1 s s s s s s z s
and A denotes the productivity
in the North and the South’s productivity is given by A . In (9), the unit product cost *
of a good is increasing in the country’s wage rate and pollution tax rate, but is
decreasing in the country’s productivity and abatement assets. An industry that is
endowed with greater stock of abatement assets, ceteris paribus, tends to have cost
advantage in that sector.
Similarly, the unit cost function in the South is given by c w( *,*,h z*; ). For given wage and tax rates in each country, good z will be produced in the North if
* * * ( , , ; ) ( , , ; )
* * ( , , ; )* * * ( ) ( , , ; ) w A c h z C z w A c h z , (10) where ( , , ; )c h z Ac w( , , ; )h z w and * * * * * * * * ( , , ; ) A ( , , ; ) c h z c w h z w . The term * * * ( , , ) ( , , ) c h c h in (10) decreases in * and increases in * h
h , but varies with *
.
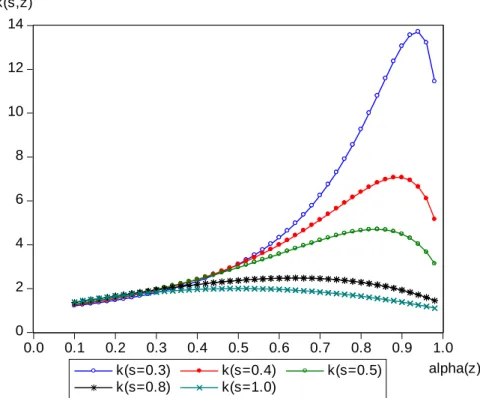
By simulating ( , )s z with respect to s and ( ) z , Figure 1 shows that values of ( , ) s z changes with pollution intensity of goods in different level of s. Here, we have ( )z to denote that pollution intensity increases with z . We also have 0
( ) 0
s H to denote that a smaller value of s corresponds to a greater stock of
abatement assets. The North, which is bountiful in the aggregate abatement assets
compared to the South, should have a smaller s than the South. As illustrated in
Figure 1, a country endowed with a greater stock of abatement assets (e.g., s0.3)
slightly has cost advantage than a country with a lower stock of abatement assets (e.g.,
0.8
s ) in producing the low pollution-intensity goods (i.e., ( )z 0.3) as
indicated by ( (s H z), )( (s H*), )z . To the contrary, the country that is endowed with a greater stock of abatement asset has largely cost disadvantage in producing
high pollution-intensive goods as indicated by ( (s H z), )( (s H*), )z when ( ) z
is larger than 0.3.
With the simulation of ( , )s z in Figure 1 and with AA* and h , I argue h*
that the North has the comparative advantage in producing the low pollution goods
South. As a result, there exist a z to equal the inequality (10). We can illustrate (10)
as a downward sloping curve with respect to z as in Figure 2.
Note as above, b(z) is the continuum counterpart to the many-commodity
budget share and ( )z is the share of output returns to labor for each good
production. Therefore, we can obtain the balance of trade schedule as
0 1 ( )[1 ( )] ( ) ( )[1 ( )] z z b z z dz B z b z z dz
, (11)which shows a upward sloping curve with respect to z as in Figure 2. In equilibrium, the North has cost advantages in producing goods along [0, ]z , and the South has cost
advantages in producing goods along [ ,1]z .
4. Pollution, CDM, and Technology Transfer
The goods along [z~,1] are produced in the South, with the remaining goods produced
in the North. Balanced trade leads to:
I (~z)(II*), (12) where z
zb z dz ~ 0 ( ) ) ~ ( denotes the share of world spending on Northern goods. The aggregate pollution of the North is the sum of pollution generated by the
production of Northern output:
D
zd z dz
z s H z p z y z dz
z s H z b z II dz ~ 0 * ~ 0 ~ 0 ) )( ( ) ( ) ( ) ( ) ( ) ( ) ( ) ( . (13)where z
z z b z dz ~ 0 ( ) ( ) ) ~ ( is the share of Northern pollution charges in world income. The next step is plugging the optimal pollution tax in (8) into (14) to get
expressions for pollution in the two economies:
1 ) ) ~ ( ) ~ ( ) ( ( z z H s D and 1 * * * * ) ) ~ ( ) ~ ( ) ( ( z z H s D . (15)
Rewriting (12) in percent change notation (e.g.,
D dD Dˆ ) yields: ˆ 1(ˆ ˆ ˆ) s D and ˆ* 1(ˆ* ˆ* ˆ*) s D , (16)
where ˆ denotes the composition effect and ˆ sˆ denotes the technique effect. Open trade changes the goods produced in each country (a composition effect),
increases real income (a scale effect), and creates incentives for governments to adjust
their pollution taxes (a technique effect). After opening up trade from autarky,
relatively clean industries are relocated in the North while pollution-intensive
industries are relocated in the South. Copeland and Taylor (1994) argue that
composition effect dominates the other two effects and conclude that open trade
always lowers the pollution level in the North, increases the pollution level in the
South, and increases worldwide pollution if the conditions and * A* w* 1
A w
hold.7 However, in this model, international spillovers of intangible abatement
technology also contributes to the technique effect, such that pollution is not only
determined by the composition effect but also by the technique effect, and only the
7
The presumption of * and A* w* 1
scale effect is fully offset after open trade.
It has been well documented that openness to trade brings up gains from trade,
including specialization according to comparative advantage and the realization of
economies scale, suggesting that open economy will enjoy higher levels of income
and consumption than in autarky. Additionally, among others, Grossman and Helpman
(1991) argued that trade in goods facilitates the exchange of intangible ideas, leading
to international knowledge spillovers, accelerating the growth of the economy.8 Thus,
in this current model, the technique effect comes from two sources: one arises from an
increase in pollution taxes that leads to adoption of cleaner production method.
However, this type of technique effect is fully offset as argued in Copeland and
Taylor’s (1994) model. The other technique effect arises from gains from trades due to
international knowledge spillovers that is separated from the above one, so that we
have s Hˆ( *) after open trade in (16). The intangible assets are non-rival, so that 0
the international knowledge spillovers will not reduce the abatement assets in the North as ˆ(s H) . 0
Adding the two items in (16) together, we obtain the world pollution as: Dˆ Dˆ* 1(sˆ sˆ*) 1[( ˆ* ˆ*) ( * *)]
. (17) The first brackets in (17) indicate that the net technique effect is negative while we
8
already argued on the above that sˆ* . The second brackets in (17) indicate the sˆ 0
net composition effect that is positive as argued already by Copeland and Taylor
(1994). The overall world pollution emissions reflect the relative strength of the
composition effect and the technique effect.
Proposition 1: The technique effect stems from not only the rising pollution taxes but
also the international diffusion of abatement technology, and only the former is fully
offset by the composition effect. Thus, the overall world pollution emissions reflect the
relative strength of the composition effect and the technique effect.
CDM as an Instrument of Technology Transfer
Currently, the Kyoto Protocol is an international agreement under which the
North has promised to reduce its greenhouse gas emissions to a certain level. The
CDM, a part of the Kyoto Protocol, provides a flexible way to reach the emission
reduction target, which allows the North to invest in CDM projects that reduce
emissions in the South as a way to earn emission reduction credits without hindering
its economic development. My model provides a channel for the CDM to play a role
in reducing world pollution, in which the CDM can help buster the technique effect
such that world pollution may become lower.
The CDM is often associated with the transfer of technologies from the North to
technologies transferred (de Coninck et al., 2007). It has been found that technology
transfers occur in about 30% to 40% of the CDM projects, accounting for about 64%
to 80% of the annual emission reductions (Haites et al., 2006; Glachant et al., 2007;
Seres, 2007). Being a key means to boost technology transfer and diffusion, CDM
consists of two forms of transfers: transfer of machinery and equipment and transfer
of knowledge, skills, and know-how (Glachant et al., 2007). A host country imports
the machinery and equipment from the North involves dedicated technology transfer
costs; however, technology transfer may also occur costless through knowledge
diffusion via CDM projects. All the tangible and intangible assets transfer occurs
within the CDM projects contribute to the technique effect in reducing pollution. Note
that these transfers increase not only the South’s abatement asset but also the world’s
abatement assets as a whole with the intangible knowledge diffusion.
Supposed that there are some abatement assets H HT HI have been
transferred to the South from the North, where H and T H denotes tangible and I
intangible abatement assets, respectively. The CDM transfers increases the South’s abatement assets by but reducing the North’s tangible assets by H HT because
the intangible assets are non-rival goods. For simplicity, let’s assume all the intangible
assets are costless diffused across national borders, although they are not in real
transfers, leading to a fall in pollution by sˆ* , but giving a rise to the pollution in 0
the North by sˆ0. While the term s is decreasing diminishing with the abatement
assets, accompanying with the assumption of H H* and H HT, we should
observe a favorable technique effect on net as indicated by sˆ sˆ* . That is, the CDM
transfer generates disproportionate impact on the abatement capability in each country,
and is in favor of the South, reducing pollution in the aggregate for the world as a
whole. Even if the CDM involves in no real resources of technology transfer (i.e.,
I
H H
), we should still observe a favorable technique effect on net because of the knowledge spillovers. However, the contribution of knowledge spillovers alone
should be limited in reducing world pollution.
Proposition 2:Open up trade may lead to a lower level of world pollution if CDM is
generously undertaken. Conversely, world pollution likely grows with the open trade
if the undertaken CDM involves in little or no dedicated clean technology transfer.
Copeland and Taylor (2005) introduce a general equilibrium model to
demonstrate that emission permit trade (a mechanism in the Kyoto Protocol) in a free
trade world may increase world pollution and make the countries involved worse off.
However, the clean technology transfer, highlighted in CDM scheme, is not addressed
in their model and their equilibrium is non-cooperative. Instead, Yang (1999)
technology transfer from the North to the South in order to mitigate pollution
externalities. Yang shows that the unilateral technology transfer not only reduces
global greenhouse gas emissions but also improves the welfare of the North, the South
and the world as a whole if there is fully cooperation between the North and the South
and if the transfers are restricted to ameliorating environmental externalities.9 The
Proposition 2 in this paper is in line with Copeland and Taylor (2005) when there is
no clean technology transfer involved, and is in line with Yang (1999) when the
dedicated clean technology transfer is generously undertaken.
Yang (1999) further shows in his simulation that the unilateral technological
transfers represent only a tiny portion of the North’s wealth. Therefore, no substantial
financial obstacles should prevent such transfers. Take Yang’s argument seriously, I
also assume that the transferred assets contribute no substantial financial obstacles to
the North in this current model. However, the welfare analysis is not addressed in this
model.
5. Conclusions
I have incorporated abatement assets into Copeland and Taylor’s (1994) model to
show that pollution of greenhouse gas emissions is not only determined by the
composition effect but also by the technique effect, and only the scale effect is fully
9
offset. This model provides a channel for technology transfer mechanism to play a
role in reducing world pollution, in which the developed countries can help facilitate
the technique effect such that world pollution may become lower if not only the CDM
but also all the FDI projects are generously undertaken with considerable advanced
technology transfer. To the contrary, world pollution likely grows if the undertaken
CDM (and FDI) involve in none or few dedicated advanced technology transfer.
The above argument finds indirect support from an empirical analysis of Zhang
and Schoengold (2011) on the potential for emissions control policy in China. They
examine the potential for emissions control within China’s power generation sector
for which accounts for the majority of its carbon emissions. Zhang and Schoengold
find out that the optimal emission tax rate is moderate when abatement technology
allows removing at least 30 percent of newly generated emissions. That is, it implies
that economic growth of a developing country can be achieved while still keeping the
emission stock at a stable level provided that efficient abatement technology is
available.
Unfortunately, Seres et al. (2009) argued that the CDM does not have an explicit
technology transfer mandate, but it contributes to technology transfer by financing
emission reduction projects that use technologies not available in the host countries.
(2009) further found that 53% of the projects claim both equipment and knowledge
transfers and 15% of the projects involve transfers of knowledge (i.e., intangible
abatement assets) alone. They have also founded that technology transfer in the CDM
projects is less likely occurring in the world’s largest population countries, such as
Brazil, China, and India. Consider that those projects that involve in technology
transfer can account for the majority of the CERs, the CDM in its future modified
form should encourage the CDM projects with technology transfers involved, but
dispirit those with pure emission credits trading. Most important, compared to total
FDI from developed countries to developing countries, the investment associated with
CDM appears to be still small (de Coninck et al., 2007). Therefore, for the sake of
world pollution reduction, the developed countries better render the developing
countries advanced technology voluntarily when carrying out their FDI.
On the other hand, it takes real resources to successfully transfer clean
technologies across national borders, which deters the technique effect.10 If the
technology transfer costs are taken into account, the success of the CDM/FDI is
highly dependent on the technological capabilities in the host countries. In order to
increase technology transfer under possible future clean development mechanisms,
10
While the Northern firms “encode” the relevant know-how, the Southern subsidiaries must “decode” the essential know-how to successfully adapt, digest, and integrate new technologies in local conditions
international and domestic policy makers need to complement the CDM/FDI by
fostering host country’s specific improvement in investment conditions, especially in
their technological capabilities.
The simple extension described in this paper considers intangible technology
transfer costs to be negligible and assume away cross-border pollution. A natural
extension of this model is to endogenize the technology transfer costs and allow
cross-border pollution, which will offer additional insights as to the role of technology
transfer costs, clarifying the complex interactions between technology transfer, trade,
and pollution. I hope to investigate these issues in future research.
References
Aronsson, Thomas , Backlund, Kenneth , Sahlén, Linda. (2006). Technology Transfers and the Clean Development Mechanism in a North-South General Equilibrium Model, Umeå University, Department of Economics in its series Umeå Economic Studies with number 697.
Barrett, Scott. (2009). Rethinking Global Climate Change Governance. Economics, 3(5): 1-12.
Böhringer, C. and C. Vogt. (2006). Economic and Environmental impacts of the Kyoto Protocol. The Canadian Journal of Economics 36(2): 475-494.
Buckley, P. and M.C. Casson. (1976). The Future of the Multinational Enterprise. London: Macmillan.
Capoor, K. and Ambrosi, P. (2007). State and Trends and the Carbon Market, The World Bank.
Copeland, B. R. and M. S. Taylor (1994). North-South Trade and the Environment.
Quarterly Journal of Economics 109(3): 755-787.
Copeland, B. R. and M. S. Taylor (2005). Free Trade and Global Warming: a Trade Theory View of the Kyoto Protocol. Journal of Environmental Economics and
Management 49(2): 205-234.
Dechezlepretre, A. Glachant, M. and Ménière, Yann. (2008). The Clean Development Mechanism and the International Diffusion of Technologies: an Empirical Study.
Energy Policy 36: 1273-1283.
de Coninck, H.C., hake, F., van der Linden, N.H. (2007). Technology Transfer in the Clean Development Mechanism. Climate Policy 7(5): 444-456.
Dornbusch, R.; S. Fischer; and P. Samuelson. (1977). Comparative Advantage, Trade, and Payments in a Ricardian Model with a Continuum of Good. American
Economic Review 67(5): 823-39.
Ellis, J., Winkler, H., Corfee-Morlot, J. Gagnon-Lebrun, F. (2007). CDM: taking stock and looking forward. Energy Policy 35: 15-28.
Glachant, Matthieu, Antoine Dechezleprêtre, Yann Ménière. (2007). The Clean Development Mechanism and the International Diffusion of Technologies: An Empirical Study. Fondazione Eni Enrico Mattei in its series Working Papers with number 2007.105.
Haites, E., Duan, M. S., Seres, S. (2006). Technology Transfer by CDM Projects.
Climate Policy 6: 327-344.
Schneider, Malte, Andreas Holzer, and Volker H. Hoffmann. (2008). Understanding the CDM’s Contribution to Technology Transfer. Energy Policy 36: 2930-38.
Seres, S. (2007). Analysis of Technology Transfer in CDM Projects. Energy Policy 37(11): 4919-4926.
UNFCCC. (2007). Bali Action Plan-Document FCCC/CP/2007/L.7/Rev.1.
van Kooten, G. C. (2003). Smoke and Mirrors: The Kyoto Protocol and Beyond.
Canadian Public Policy 29(4): 397-415.
Wang, Bo. (2009). Can CDM bring technology transfer to China?- An empirical study of technology transfer in China’s CDM projects. Energy Policy 38: 2572-2585.
Willis, M., M. Wilder, and P. Crunow. (2006). The Clean Development Mechanism: Special Considerations for Renewable Energy Projects. Renewable Energy and
International Law Project. Baner & McKenzie.
Yang, Zili. (1999). Should the North Make Unilateral Technology Transfers to The South? - North-South Cooperation and Conflicts in Responses to Global Climate Change. Resource and Energy Economics 21(1): 67-87(21).
Zhang, Z. and K. Schoengold. (2011). Carbon emissions control policies in China’s power generation sector. China Agricultural Economic Review 3(3): 350-368.
0 2 4 6 8 10 12 14 0.0 0.1 0.2 0.3 0.4 0.5 0.6 0.7 0.8 0.9 1.0 ALPHA k(s=0.3) k(s=0.4) k(s=0.5) k(s=0.8) k(s=1.0) alpha(z) k(s,z)
Figure 1 Stimulation of ( , )s z by different levels of s.