大眼華
鳊
親緣地理與族群遺傳結構之研究
許桂菁
12蔡昆展
3邵廣昭
2王建平
1林弘都
1* 1國立成功大學生命科學研究所 2中央研究院生物多樣性研究中心 3國立成功大學生物多樣性研究所 (收稿日期:2005.6.7,接受日期:2005.10.17) 摘 要 本研究利用粒線體DNA 研究大眼華鳊之親緣地理與族群遺傳結構,Tajima’s D 統計上呈現顯 著負值,高的平均單型多樣性(h = 0.999) 與低核苷酸歧異值(π= 0.009)顯示大部分的族群歷經族群 擴張。族群間分化指數平均值為0.583,顯示族群間具較低的基因交流而呈現高度分化。以聚類分 析(neighbor-joining)法重建親緣關係圖,但並無法明顯再依地理區或河系分群,顯示大眼華鳊 群正處於譜系排序(lineage sorting)的狀態。根據 NCA 法分析,顯示大眼華鳊族群曾經歷過去破 碎化事件與長距離拓殖等歷史事件,在網狀親緣關係(network)的分析中發現淡水河與閩江的關 係最為密切,顯示淡水河的大眼華鳊應由閩江擴散而來。 關鍵詞:大眼華鳊、親緣地理、族群遺傳結構緒 言
親緣地理(phylogeography)研究的是歷史與 空間事件對於物種族群與地質事件之間的關係 (Avise, 2000),親緣地理除了用來檢視族群 枝序分歧的歷史及空間內容之外,透過結合過 去跟現代的生物地理學資訊以及分子訊息,用 於解釋相近緣族群之間的演化動態(Gifford et al., 2004)。親緣系統方法可以用來測試種內變異關 係、演化模式及其過程的假說(e.g., Avise, 2000; Avise et al., 1987; Emerson, 2002; Schneider et al., 1998; Gifford et al., 2004)。 初級性淡水魚類終生不下海,在地理分佈 上,必須依賴水系的相連才可擴遷,故初級性 淡水魚類在分佈上就具有『島嶼』的擴遷模式 (Salzburger et al., 2003),因此其演化及分佈模 式,常會反應出一個地區在古地質生物學上的 複雜性,尤其是水系的發展、分離還有相連結 的過程(Bermingham and Martin, 1998; Durandet al., 1999)。由於此特性,初級性淡水魚類在 地理分布上經常出現動物地理區(Meffe and Vrijenhoek, 1988),因此藉著瞭解初級性淡水魚 類的親緣地理,可以幫助我們瞭解此地區水系 過去所經歷的歷史與演化事件。 大眼華鳊 (Sinibrama macrops)在分類地位上 屬於鯉科 (Cyprinidae)、魚白 亞科(Cultrinae), 主要棲息於河流或湖泊水域中,此種在台灣僅 分布於淡水河水系,但根據中國動物誌中冊的 描述(Luo, 1998),大眼華鳊主要分布於台灣 與西江水系,但在地理上與台灣最近緣的福建 地區,則分布另一種伍氏華鳊(S. affinis)。 Xie 等人(2003)則利用多變量形態度量學方 法,認為大眼華鳊與伍氏華鳊在形態上並無明 顯差異,因此,認為大眼華鳊與伍氏華鳊應屬 同種,但由於大眼華鳊的模式產地為台灣,該 研究缺少台灣的大眼華鳊標本,因此無法界定 大眼華鳊的分類地位。因此,本研究欲利用分 子標示來釐清台灣之大眼華鳊與中國之伍氏華 鳊是否屬於同種。 台灣由於板塊運動和冰河期影響的關係, 初級性淡水魚類呈現極明顯的動物地理區系, 台灣淡水魚類的動物地理區系最早是由大島正
滿(Oshima, 1923)提出,他主張台灣的淡水魚 類相北部地區與中國舊北帶相魚類相似,台灣 南部地區則與珠江東洋區系相似,中部則為過 渡地帶。Tzeng(1986)則根據台灣淡水魚類的 分布,將台灣淡水魚動物區劃分為東部、南部 和北中部等三個動物地理區。根據過去的地質 歷史,台灣和中國大陸因冰河時期來臨造成海 平面下降,而有過數次的相連,初級性淡水魚 類藉水系相連時期,分布到台灣島上(黃等, 1995)。Lee(1981)將中國的淡水魚分為五大 區、二十一亞區,其中以閩浙亞區在地理位置 上與台灣最近,此區包括舟山群島至天台山以 南,武夷山以東與韓江以北區域,因此根據台 灣 與 中 國 大 陸 過 去 地 質 歷 史 來 看 ( 黃 等 , 1995),台灣的淡水魚應與中國閩浙亞區魚類 具有較近緣的關係(Oshima, 1923)。 粒線體 DNA 由於具有母系遺傳、不重組、 演 化 速 率 較 核 DNA 快 約 5-10 倍 等 特 性 (Futuyma, 1998),常被應用於族群遺傳或親
緣地理的研究(Bermingham and Martin, 1998;
Bernatchez and Wilson, 1998)。本研究利用粒
線體 DNA 控制區片段,研究中國閩浙亞區與台 灣地區之華鳊物種在分類上的關係,並藉由其 族群遺傳結構,探討淡水河系與中國水系過去 之地質歷史。
材料與方法
本研究在中國閩浙亞區之六個河系與台灣 淡水河系選取 10 個族群共 71 個個體,中國大 陸的六個河系分別為浙江省錢塘江水系的屯溪 (TS)與衢州(CZ)兩個族群,歐江水系為麗 江(LH)一個族群,福建省交溪水系的福安 (FA)族群,閩江水系的光澤(KG)與邵武 (SW)兩族群,大彰河水系的永泰(UT)與 九龍江水系的彰平(CP)與華安(HA),其中 以九龍江水系之海南華鳊(Sinibrama melrosei) 作為外群分析,另外我們在台灣淡水河水系的 新店(SD),選取了三個個體(表一)。 野外採集樣本以 95%酒精保存,攜回實驗 室後,取部分肌肉組織以酚/ 氯仿法(Blin and Stafford, 1976)萃取 DNA,我們以 Loop1 (F) (5’-AGG AGG TGT TCT TGC ACT AC-3’) and Loop2(R) (5’- AGC TAC TTT CGT GTA TTG GG-3’) (Wang et al., 2000, 2004),作為引物,進行 PCR 反 應 增 幅 粒 線 體 DNA 序 列 。 每
100µLPCR 反應中,包括 10 ng 的樣本 DNA、
10µL 10 倍反應緩衝液、10µL 之 dNTP(8mM)、
10µL 之氯化鎂(25mM)、10 pmole 之 Loop1
與 Loop2 引物與 4U of DNA 聚合酵素 (Taq
polymerase, Promega, Madison, WI, USA),以 溫度循環機(MJ Thermal Cycler)進行 DNA 酵
素聚合反應(PCR)反應,反應步驟如下:以
95℃進行 4 分鐘變性反應,再以 94℃變性 45 秒、48℃進行黏合反應 1 分 15 秒,72℃ 進行延 長反應 1 分 30 秒,此循環反應進行 30 個循
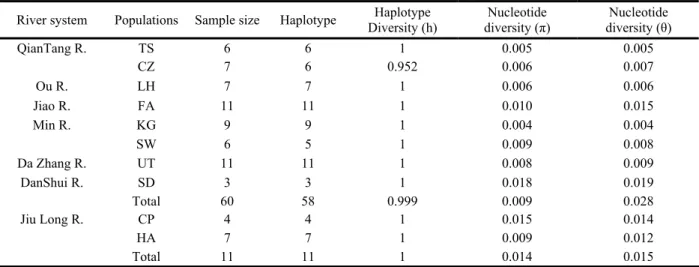
表一、大眼華鳊與海南華鳊族群之採樣點、樣本數、序列單型歧異度及核苷酸歧異度
Table 1. Materials of Sinibrama macrops and S. affinis used for mtDNA analyses and nucleotide and haplotype diversities in each
population.
River system Populations Sample size Haplotype Diversity (h) Haplotype diversity (π) Nucleotide diversity (θ) Nucleotide
QianTang R. TS 6 6 1 0.005 0.005 CZ 7 6 0.952 0.006 0.007 Ou R. LH 7 7 1 0.006 0.006 Jiao R. FA 11 11 1 0.010 0.015 Min R. KG 9 9 1 0.004 0.004 SW 6 5 1 0.009 0.008 Da Zhang R. UT 11 11 1 0.008 0.009 DanShui R. SD 3 3 1 0.018 0.019 Total 60 58 0.999 0.009 0.028 Jiu Long R. CP 4 4 1 0.015 0.014 HA 7 7 1 0.009 0.012 Total 11 11 1 0.014 0.015
環,最後進行十分鐘 72℃延長反應,以 4℃保
存 PCR 產 物 , 所 得 產 物 以 1.0% 洋 菜 膠 於
1×TAE 緩衝液進行電泳,最後以膠體純化套組
(gel purification kit; QIAGEN, Valencia, CA,
USA)進行純化,所得產物以 ABI 377XL 自動 定序儀(Applied Biosystem, Foster City, CA, USA) 進行雙向序列定序。
DNA 分 子 序 列 以 CLUSTAL X 1.81 (Thompson et al., 1997) 進 行 排 序 比 對 (alignment),所得結果再進行人為調整。聚
類 分 析 法 (neighbor-joining (NJ) tree ) 使 用
Kimura 二 參 數 法 ( Kimura 2-parameter distance )為參數 (Kimura, 1980),以 MEGA 2
( Molecular Evolutionary Genetics Analysis
Version 2) (Kumar et al., 2001)套裝軟體進行親
緣 關 係 樹 重 建 , 再 進 行 1000 次 重 排
(bootstrap ) , 以 測 驗 親 緣 關 係 之 可 信 度
(Felsenstein, 1985)。網狀親緣關係(network)
以 MINSPNET (Excoffier and Smouse, 1994)建
立,以 Templeton 等人(1987) 與 Templeton and
Sing (1993) 所 提 觀 念 進 行 Nested claded analysis,最後以 GeoDis 2.0 (Posada et al., 2000) 進行各分系群(clade)與地理關係分析,所得
結果依據 Templeton 等人(2004)所提之檢索,進
行各分系群(clade)經歷歷史事件描述。
各族群序列多型性變異利用 DnaSP vs. 3.95
(Rozas and Rozas, 1999)套裝軟體進行分析,以 核苷酸變異值(nucleotide diversity (θ) (Jukes and Cantor, 1969), nucleotide diversity (π) (Nei, 1987))與單型多樣性( haplotype diversity (h) (Nei and Tajima, 1983))描述, 族群間基因交流
值 (FST) 亦 利 用 DnaSP vs. 3.95 (Rozas and
Rozas, 1999)進行分析,測試族群間與地理區間 遺 傳 變 異 程 度 , 則 利 用 Arlequin Ver. 2000 (Excoffier et al., 2000) 套裝軟體以分子變異分析 (AMOVA)方式分析,其中 фCT為地理區間的 分化程度,фST為族群間的分化程度,фSC為地 理區內族群間的分化程度。為了解大眼華鳊族 群在過去歷史中,是否經歷族群波動,本研究 亦利用DnaSP vs. 3.95 軟體,進行 Tajima’s D 測 驗。
結 果
本研究利用 PCR 增幅粒線體 DNA 控制區 及其附近片段為遺傳標示物,此片段包括部分 細 胞 色 素 b ( cytochrome b ) 片 段 、 threoninetRNA 基因、proline tRNA 基因,完整控制區片段 ( D-loop region)、phenylalanine tRNA gene、 與部分 12S rRNA 基因片段,由於控制區片段為 非 轉 譯 片 段 , 因 此 每 個 個 體 間 會 有 插 入 (inserting)與缺失(deleting)的變化,我們所 得長度變化在 1804-1822bp,在序列鹼基對比例 方面,A 所佔比例為 31.6%,T 佔約 27.3%,C 佔約 23.7%,G 佔約 17.4%,呈現 A-T rich,只
特 徵 在 其 他 魚 類 亦 有 報 導(Faber and Stepien,
1998; Wang et al., 2000; Englbrecht et al., 2000; Perdices et al., 2004; Wang et al., 2004)。另外, 在控制區序列中,大眼華扁具有一段短的重複
片 段 (AT repeat ) , 此 特 徵 在 台 灣 石 魚 賓
Acrossocheilus paradoxus (Wang et al., 2000)與台
灣鏟頷魚 Varicorhinus barbatulus (Wang et al.,
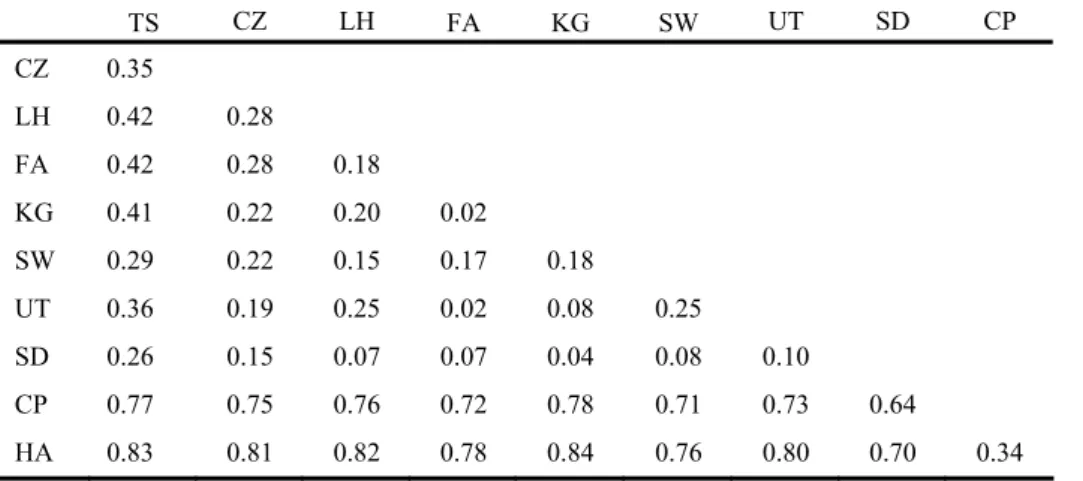
2004)是相同的。 我們在大眼華鳊 60 個個體中得到了 58 個單型 (haplotype ) , 平 均 單 型 多 樣 性 ( haplotype diversity; h)為 0.999,顯示大眼華鳊族群具有 極高的遺傳多樣性,核苷酸歧異值(θ, π)以閩 江的光澤最低(θ=0.004, π=0.004),台灣淡水 河新店群為最高(θ=0.018, π=0.019),各族群 θ 與 π 的 平 均 值 分 別 為 0.009 與 0.028 ( 表 一)。九龍江的 11 個海南華鳊個體中,得到了 11 個單型、,平均單型多樣性(h)為 1,θ 與 π 的平均值分別為 0.014 與 0.015。利用 DNAsp 估算族群間分化指數(FST),大眼華鳊在浙江 地區的族群分化指數較高(0.28-0.42),在福 建地區河系相對較低(0.02-0.25),族群間分 化指數平均值為 0.583,顯示族群間具高度分 化 , 但 在 大眼 華 鳊 與 海南 華 鳊 ( 九龍 江 ) 之 間,分化指數在 0.70 以上(表二)。另外,我 們亦利用分子變異分析(AMOVA)來瞭解變異 的 分 佈 模 式, 我 們 以 武夷 山 系 與 台灣 海 峽 為 界,分別為武夷山系以北的浙江群,包括錢塘 江與歐江兩水系、三個族群,武夷山以南的福 建群,包括礁溪、閩江水系與大彰河三水系、 四個族群,以及台灣的淡水河水系一族群,結 果顯示,絕大部分的變異分佈於族群內,約佔 98.84%,存在於族群間與地理區間的變異,只 佔1.16%(表三)。
表二、大眼華鳊和海南華鳊族群基因交流值(斜角線上方)族群間分化指數(斜角線下方)
Table 2. Matrix of pairwise Nm (above diagonal) and FST (below diagonal) between 10 populations of Sinibrama macrops and S.
affinis based on mtDNA.
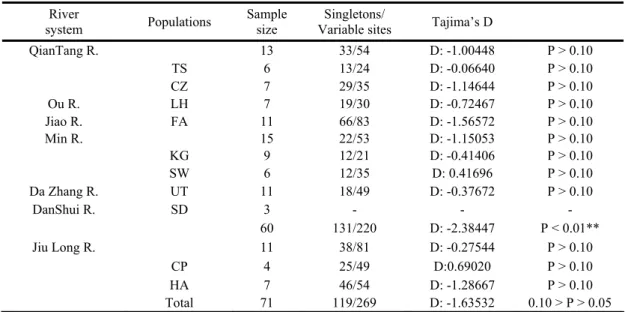
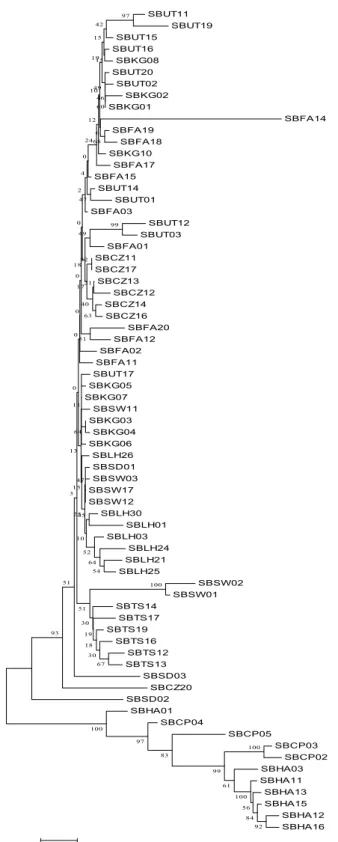
TS CZ LH FA KG SW UT SD CP CZ 0.35 LH 0.42 0.28 FA 0.42 0.28 0.18 KG 0.41 0.22 0.20 0.02 SW 0.29 0.22 0.15 0.17 0.18 UT 0.36 0.19 0.25 0.02 0.08 0.25 SD 0.26 0.15 0.07 0.07 0.04 0.08 0.10 CP 0.77 0.75 0.76 0.72 0.78 0.71 0.73 0.64 HA 0.83 0.81 0.82 0.78 0.84 0.76 0.80 0.70 0.34 Tajima’s D 分析上,在大眼華鳊族群方面, 雖然大部分族群D值均呈現負值,但並未達顯 著水準,但若將所有個體混合一起,則達顯著 水準(P < 0.01),顯示對大眼華鳊而言,此物 種呈現族群擴張,在海南華鳊族群中,九龍江 所有個體一併計算,雖未達顯著水準(0.10 > P > 0.05 ) , 但 亦 顯 示 具 較 弱 的 族 群 擴 張 ( 表 四)。 利 用 MEGA2 以 聚 類 分 析 ( neighbor-joining)法重建大眼華鳊與海南華鳊親緣關係 圖(圖一),圖中可以清楚分為兩大群,分別 為海南華鳊(九龍江群 CP、HA)與大眼華鳊 群,但大眼華鳊群並無法明顯再依地理區或河 系 分 群 , 顯 示 大 眼 華 鳊 群 正 處 於 譜 系 排 序 (lineage sorting)的狀態。 以套裝軟體 MINSPNET 建構網狀親緣關係
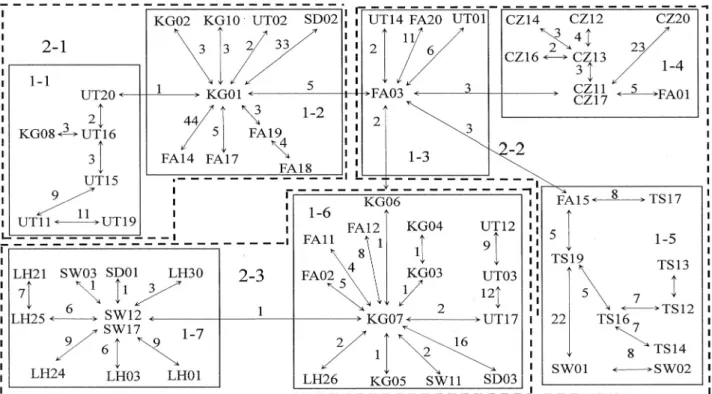
圖(minimum spanning network)中(圖二), 發 現 大 眼 華鳊 各 族 群 並無 法 行 成 單一 分 系 群 (clade),每一個分系群(clade)均由兩個以 上族群所組成,其中,台灣淡水族群,分別分 布於分系群(clade) 1-2、1-6 與 1-7 中,顯示 淡水河族群並未因台灣海峽阻隔而形成單系群 (monophyletic group),在網狀親緣關係圖建 構中,我們將之區分為三個階層以進行 nested clade analysis,在分系群(clade)2-1 中,包含 分系群(clade)1-1 與分系群(clade)1-2,此 分系群(clade)中以福建群水系為主,分系群 (clade)2-2 包含分系群(clade)1-3、分系群 (clade)1-4 與分系群(clade)1-5,分系群 (clade)1-3 主要以福建群的大彰河與交溪兩族 群為主,分系群(clade)1-4 則大部分以錢塘江 的衢州族群為組成,分系群(clade)1-5 主要以 錢塘江的屯溪群為主,但亦包含部分閩江邵武 與交溪的個體,分系群(clade) 2-3 包含分系 群(clade)1-6 與分系群(clade)1-7,分系群 (clade ) 1-6 以 福 建 群 個 體 為 主 , 分 系 群 (clade)1-7 則包含閩江邵武與歐江麗水兩族群 個體,在網狀親緣關係(network)分析中,分 系群(clade) 2-2 位在內部(interior)顯示此 群 屬 於 較 為 古 老 的 部 分 , 而 位 在 內 部 (interior)位置的單型,以閩江水系族群個體 居多,顯示閩江可能擁有較為古老的族群,但 若以族群位置來看,浙江水系的族群多位在末 端 (Tip ) , 如 錢 塘 江 的 衢 州 群 位 在 分 系 群 ( clade)1-4,屯溪群位在分系群(clade)1-5,歐江麗水則位在分系群(clade)1-7 的位 置,顯示浙江各水系,應該屬於較為晚期擴遷
的 族 群 , 我 們 再 以 GeoDis 2.0 (Posada et al.,
2000)進行 Nested clade analysis 的分析,分析各
表三、利用Arelequin 2000 套裝軟體分析大眼華鳊族群與 地理區間遺傳分化關係
Table 3. AMOVA results for testing genetic subdivision
between populations of Sinibrama macrops using of Arelequin 2000. ** P<0.05
Source of variation components Variance Percentage of variation Among groups -0.00099 ** -0.20 Among populations within
groups 0.00678** 1.36 Within populations 0.49405 ** 98.84
表四、大眼華鳊和海南華鳊族群之Tajima’s D 測試結果
Table 4. Tajima’s D statistics in 10 populations of Sinibrama macrops and S. affinis
River
system Populations
Sample size
Singletons/
Variable sites Tajima’s D
QianTang R. 13 33/54 D: -1.00448 P > 0.10 TS 6 13/24 D: -0.06640 P > 0.10 CZ 7 29/35 D: -1.14644 P > 0.10 Ou R. LH 7 19/30 D: -0.72467 P > 0.10 Jiao R. FA 11 66/83 D: -1.56572 P > 0.10 Min R. 15 22/53 D: -1.15053 P > 0.10 KG 9 12/21 D: -0.41406 P > 0.10 SW 6 12/35 D: 0.41696 P > 0.10 Da Zhang R. UT 11 18/49 D: -0.37672 P > 0.10 DanShui R. SD 3 - - - 60 131/220 D: -2.38447 P < 0.01** Jiu Long R. 11 38/81 D: -0.27544 P > 0.10 CP 4 25/49 D:0.69020 P > 0.10 HA 7 46/54 D: -1.28667 P > 0.10 Total 71 119/269 D: -1.63532 0.10 > P > 0.05
表五、a)大眼華鳊族群以 Nested clade analysis 法分析之結果;b) 依據 Nested clade analysis 法檢索大眼華鳊族群之歷史事件
Table5. a) Nested clade distance analysis of mtDNA haplotypes observed in Sinibrama macrops. Dc and Dn are clade and nested
clade distances, respectively. Superscript S and superscript L indicate that distance measures are significantly smaller and larger, respectively, than expected under random distribution of haplotypes. b) Demographic inferences from the nested clade distance analysis in Sinibrama macrop.
a) 1-step DC DN 2-step DC DN 1-1 T 117.5 S 158.91 2-1I 191.91S 216.77 1-2 I 221.42 199.65L I/ T 103.92L 40.73 L 1-3 I 116.00 251.41L 2-2 T 197.60 S 223.29 1-4 T 88.00 S 155.32S 1-5 T 198.92 201.82L I/ T -30.72 71.46 L 2-3T 228.74 221.65 I/ T -16.96 3.51 b)
Clade Permutational X2 P Clade key Inferences
1-step clades nested in 2-1 8.40 0.03 1-2-3-4-NO restricted gene flow with isolation by distance 1-step clades nested in 2-2 36.68 0.000 1-2-3-5-6-13-14-NO Long-distance colonization and/or Past
fragmentation
Whole cladogram 183.00 0.000 1-2-3-5-15-NO Past fragmentation and/or Long-distance colonization
分系群(clade)或單型(haplotype)與地理間
的關係(表五),並以 Templeton 等人(2004)所
提供之檢索,瞭解各分系群(clade)所經歷之 歷史事件,結果顯示分系群(clade)2-1 顯現出 restricted gene flow with isolation by distance,分 系群(clade)2-2 為 Long-distance colonization and/or Past fragmentation ,但若以全部分系群 (clade)(Whole cladogram)為分析本體,則
顯示大眼華鳊族群受到Past fragmentation and/or
Long-distance colonization 因子影響 。
討 論
以聚類分析法(neighbor-joining (NJ) tree) 所建構的親緣樹中發現,大眼華鳊與海南華鳊 分屬不同的單系群(monophyletic group),而 台灣淡水河大眼華鳊族群的三個個體(SD01-03),在親緣樹中併入中國大陸族群個體中, 並與其他族群形成一個單系群(monophyletic group),顯示台灣的大眼華鳊與中國大陸過去 所指稱的伍氏華鳊應同屬大眼華鳊,但是親緣 關係樹的分群與地理河系上的分群並不相關, 顯示大眼華鳊各族群正處於譜系排序(lineage sorting)的狀態。 在族群遺傳結構分析上,大眼華鳊族群在 平均單型多樣性(h)為0.999,顯示大眼華鳊族 群具有極高的遺傳多樣性,此特徵與中國的平 頷鱲(Zacco platypus, h =1.0 – 0.74, Perdices et al., 2004)類似,但在核苷酸歧異值(θ與π值)上,其平均值分別為0.028與0.009此值,此與其 他 鯉 科 魚 類相 比 是 較 低的 , 例 如 :蘇 菲 亞 鰷
Leuciscus souffia (θ = 0.056) (Salzburger et al.,
2003),但是若與台灣其他魚類相比,則此值是
相近的,如台灣石魚賓Acrossocheilus paradoxus (θ
= 0.0103) (Wang et al., 2000) 與 台 灣 鏟 頷 魚
Varicorhinus barbatulus (θ = 0.01033) (Wang et al.,
2004),在π值方面大眼華鳊平均值為0.018 ( π = 0.004–0.018 ),此值則接近於中國大陸的另一種 鯉科魚類平頷鱲Zacco platypus ( π = 0.0–0.008, Perdices et al., 2004),在各族群的核苷酸歧異值 上,我們發現以台灣淡水河族群為最高(π = 0.018),此結果可能是因為台灣淡水河族群, 因具有較穩定族群量,所以可以累積較多的變 異,此結果同樣發現於台灣鏟頷魚族群中(Wang SBUT11 SBUT19 SBUT15 SBUT16 SBKG08 SBUT20 SBUT02 SBKG02 SBKG01 SBFA14 SBFA19 SBFA18 SBKG10 SBFA17 SBFA15 SBUT14 SBUT01 SBFA03 SBUT12 SBUT03 SBFA01 SBCZ11 SBCZ17 SBCZ13 SBCZ12 SBCZ14 SBCZ16 SBFA20 SBFA12 SBFA02 SBFA11 SBUT17 SBKG05 SBKG07 SBSW11 SBKG03 SBKG04 SBKG06 SBLH26 SBSD01 SBSW03 SBSW17 SBSW12 SBLH30 SBLH01 SBLH03 SBLH24 SBLH21 SBLH25 SBSW02 SBSW01 SBTS14 SBTS17 SBTS19 SBTS16 SBTS12 SBTS13 SBSD03 SBCZ20 SBSD02 SBHA01 SBCP04 SBCP05 SBCP03 SBCP02 SBHA03 SBHA11 SBHA13 SBHA15 SBHA12 SBHA16 100 92 84 56 100 61 99 83 97 100 100 97 99 67 30 54 18 42 64 19 30 60 68 46 49 15 15 19 6 10 12 24 93 51 63 21 51 40 82 49 52 47 0 4 17 2 18 45 51 0 64 0 3 0 0 0 10 47 25 15 13 11 0 .0 0 5 圖一、 以 MEGA 重建大眼華鳊與海南華鳊之
Neighbor-Joining 親緣關係。Nodes 上的數值為 bootstrap 的測試值
Figure 1. Neighbor-Joining tree based on mtDNA D-loop gene
in Sinibrama macrops and S. affinis. Numbers at the nodes indicate bootstrap values (expressed as percentage) with 1,000 replicates.
圖二、Minimum spanning network ,連線上數值為兩DNA序列之有效變異數,粗體為所屬 clade 階層
Figure 2. Minimum spanning network based on mutations between haplotypes observed in 8 populations of Sinibrama macrops..
et al., 2004) ,而中國其他族群核苷酸歧異值較 低 , 可 能 是 過 去 曾 經 受 到 瓶 頸 效 應 (bottleneck)的影響(Frank et al.,1998),或 是棲地破碎化(habitat fragment)的影響, 單型 多樣性(h) 和核苷酸歧異值(π)的變異模式,可以 用來推斷族群過去所經歷之歷史事件,若根據 Grant and Bowen (1998)所提出之意見,當族群 具有高的h和低的π (i.e., h > 0.5, π < 0.5%),可以 推測此族群過去可能經歷過瓶頸效應,之後伴 隨著快速族群增長的歷史事件。 Tajima’s D測驗可以幫助我們瞭解族群間是 否 經 歷 過 族 群 擴 張 事 件 ( population expansion),Tajima’s D值在非轉譯序列上,若 呈現負值且顯著時,顯示此族群曾經經歷過族 群擴張,大眼華鳊在各族群內的Tajima’s D雖呈 現負值,但並不顯著,但是若將所有個體混合 計算,則發現Tajima’s D呈現負值且顯著(表 四),顯示大眼華鳊過去呈現族群擴張的,小 族群的Tajima’s D呈現不顯著情況,我們推測與 取樣較小有關。 利用DNAsp估算族群間分化指數(FST)可 推論大眼華鳊的遺傳分化程度,我們發現族群 間分化指數平均值為0.583,顯示族群間具高度 分化,一般而言,初級性淡水魚類因為河系的 阻隔,通常會具有較高的遺傳分化(Ward et al., 1994),大眼華鳊的分化指數(FST)高於其他 淡 水 魚 類 平 均 值 (FST = 0.22; Ward et al., 1994),由分子變異分析(AMOVA)的分析中 顯 示 , 絕 大 部 分 的 變 異 分 佈 於 族 群 內 , 約 佔 98.84%,存在於族群間與地理區間的變異,只 佔1.16%,推測大眼華鳊各族群間因為正處於溯 祖階段(coalescent stage),故變異多存在於族 群內。 利用套裝軟體MINSPNET所建構的網狀親
緣關係圖(minimum spanning network),推測 大眼華鳊的遷徙路徑,在網狀親緣關係圖中,
我們發現位在內部(interior)的個體以福建地
區族群的個體為主,顯示福建地區的大眼華鳊 可能是起源中心,由此區域向台灣及浙江地區 擴散,由Nested clade analysis的分析所得結果來 看,分系群(clade)2-1得到restricted gene flow with isolation by distance 的 結 果 , 此 分 系 群
(clade)之個體以福建地區三族群為主,在族
群間分化指數(FST)上,此區河系之分化值
(0.02-0.25)相對於浙江地區(0.28-0.42)為
距離較近,過去可能因河川襲奪或是氾濫,造 成 基 因 交 流 導 致 分 化 指 數 降 低 , 分 系 群
( clade ) 2-2 得 到 Long-distance colonization
and/or Past fragmentation 的 結 果 , 在 分 系 群 (clade)2-2中,分系群(clade)1-4主要屬於錢 塘江的衢州族群與分系群(clade)1-5為同一水 系之屯溪群,此二分系群(clade)在網狀親緣 關係(network)中均位於端位,顯示其屬於較 為 晚 期 出 現 的 分 系 群 (clade ) , 而 分 系 群 (clade)1-3位於內部(interior)且組成個體以 福建群的大彰河與交溪兩族群為主,因此我們 推斷福建群為起源中心,因過去長距離的拓殖 (Long-distance colonization)而分布至浙江。在 全部系群(Whole cladogram)分析上,我們得
到 Past fragmentation and/or Long-distance
colonization的結果,則顯示大眼華鳊族群受到 淡水水系影響隔離,但亦可能受到過去地質歷 史或冰河時期的影響 ,以福建地區為起源中 心,向台灣及浙江地區擴散。 大眼華鳊在台灣侷限分布於淡水河水系, 在網狀親緣關係(network)的分析中發現,此 河系的三個個體均與閩江水系個體連結,顯示 淡水河與閩江的關係最為密切,在地質上,我 們推測最後一次冰河時期來臨時,因海平面下 降 , 閩 江 與 淡 水 河 應 在 此 時 在 台 灣 海 峽 連 結 (Lin, 1966),導致大眼華鳊的擴散。
參考文獻
黃鎮國、張偉強、鐘新基、陳俊鴻、陳偉光, 1995。台灣板塊構造與環境演變。海洋出 版社,共228頁。Avise JC. 2000. Phylogeography: The History and Formation of Species. Harvard University Press, Cambridge, MA.
Avise JC, Arnold J, Ball JR, Bermingham E, Lamb T, Neigel JE, Reeb CA and Saunders NC. 1987. Intraspeci.c phylogeography: the m i t o c h o n d r i a l D N A b r i d g e b e t w e e n population genetics and systematics. Annu. Rev. Ecol. Syst. 18:489–522.
Bermingham E and Martin AP. 1998. Comparative mtDNA phylogeography of neotropical freshwater fish: testing shared history of infer the evolutionary landscape of lower Central America. Mol. Ecol. 7, 499-517.
Bernachez L and Wilson CC. 1998. Comparative phylogeography of Nearctic and Palearctic fishes. Mol. Ecol. 7, 431-452.
Blin N and Stafford DW. 1976. A general method for isolation of high molecular weight DNA from eukaryotes. Nucl. Acids Res. 3:2303-2308.
Durand JD, Persat H and Bouvet Y. 1999. Phylogeography and postglacial dispersion of the chub (Leuciscus cephalus) in Europe. Mol. Eco. 8:989-998.
Faber J E and Stepien CA. 1998. Tandemly repeated sequences in the mitochondrial DNA control region and phylogeography of the Pike-Perches Stizostedion. Mol. Phylogenet. Evol. 10:310-22.
Emerson BC. 2002. Evolution on oceanic islands: molecular phylogenetic approaches to understanding pattern and process. Mol. Ecol. 11:951–966.
Emerson BC. 2002. Evolution on oceanic islands: molecular phylogenetic approaches to understanding pattern and process. Mol. Ecol. 11:951–966.
Excoffier L. and Smouse PE. 1994. Using allele frequencies and geographic subdivision to reconstruct gene trees within a species: molecular variance parsimony. Genetics 136: 343-359.
Excoffier L, Smouse PE and Quattro JM. 2000. Analysis if molecular variance inferred from metric distances among DNA haplotypes: application to human mitochondrial DNA restriction data. Genetics 136:343–359.
Felsenstein J. 1985. Confidence limits on phylogenies: an approach using the bootstrap. Evolution 39:783-791.
Franck P, Garnery L, Solignac M and Cornuet JM. 1998. The origin of West European subspecies of honeybees (Apis mellifera): new insights from microsatellite and mitochondrial data. Evolution 52:1119–1134.
Futuyma DJ. 1998. Evolutionary Biology, 3rd edn. Sinauer, Sunderland, MA.
Gifford ME, Powell R, Larson A and Ronald LG. 2004. Population structure and history of a phenotypically variable teiid lizard (Ameiva
chrysolaema) from Hispaniola: the influence
of a geologically complex island Mol. Phylogenet. Evol. 32:735-748.
Grant W and Bowen BW. 1998. Shallow population histories in deep evolutionary lineages of marine fishes: insights from sardines and anchovies and lessons for conservation. J. Hered. 89:415 - 426.
Jukes TH and Cantor CR. 1969. Evolution of protein molecules. In: Mammalian Protein Metabolism (ed. Munroled HN). Academic Press, New York, Pp. 31–132.
Kimura M. 1980. A simple method for estimating evolutionary rates of base substitutions through comparative studies of nucleotide sequences. Mol. Ecol. 16:111-120
Kumar SK, Tamura IB, Jakobsen and Nei M. 2001. MEGA2: Molecular Evolutionary Genetics Analysis software, Bioinformatics. 17:1244-1245.
Li SZ. 1981. Studies on zoogeographical divisions for fresh water fishes of China. Science Press. Beijing. China (in chinese).
Lin CC. 1966. An outline of Taiwan’s Quaternary geohistory with a special discussion of the relation between natural history and cultural history in Taiwan. Bulletin of the Department of Archaeology and Anthropology 23:7–44. Luo YL. 1998. Sinibrama [A]. In: Chen Y.Y. Fauna
Sinica (Osteichthyes: Cypriniformes) [M]. Beijing: Science Press. 142-148 (in chinese). Meffe GK and Vrijenhoek RC. 1988. Conservation
genetics in the management of desert fishes. Conserv. Biol. 2:157–169.
Nei M. 1987. Molecular Evolutionary Genetics. Columbia University Press, New York.
Nei M and Tajima F. 1983. Maximum likelihood estimation of the number of nucleotide substitutions from restriction sites data. Genetics 105:207-217.
Oshima M. 1923. Studies on the distribution of freshwater fishes of Taiwan and discuss the geographical relationship of the Taiwan island and the adjacent area. Zool. Mag. 35:1-49. Perdices A, Cunha C and Coelho MM. 2004.
Phylogenetic structure of Zacco platypus (Teleostei, Cyprinidae) populations on the upper and middle Chang Jiang (= Yangtze) drainage inferred from cytochrome b sequences. Mol. Phylogenet. Evol. 31:192–203. Posada D, Crandall KA and Templeton AR. 2000. GeoDis: a program for the cladistic nested analysis of the geographical distribution of genetic haplotypes. Mol. Ecol. 9:487–488.
Rozas J and Rozas R. 1999. DnaSP versin 3.0: an integrated program for molecular population genetics and molecular evolution analysis. Bioinformatics 15:174-175.
Salzburger W, Brandstatter A, Gilles A, Parson W, Hempel M, Sturmbauer C and Meyer A. 2003. Phylogeography of the vairone (Leuciscus
souffia, Risso 1826) in Central Europe. Mol.
Eco. 12:2371–2386
Schneider CJ, Cunningham M and Moritz C. 1998. Comparative phylogeography and the history of endemic vertebrates in the wet tropical rainforests of Australia. Mol. Ecol. 7:487–498. Templeton AR, Boerwinkle E and Sing CF. 1987.
A cladistic analysis of phenotypic associations with haplotypes inferred from restriction endonuclease mapping. I. Basic theory and an analysis of alcohol dehydrogenase activity in
Drosophila. Genetics 117:343–351.
Templeton AR and Sing CF. 1993. A cladistic analysis of phenotypic associations with haplotypes inferred from restriction endonuclease mapping. IV. Nested analyses with cladogram uncertainty and recombination. Genetics 134:659–669.
Templeton AR. 2004. Statistical phylogeography: methods of evaluating and minimizing inference errors. Mol. Eco. 13:789-809.
Thompson JD, Gibson TJ, Plewniak F, Jeanmougin F and Higgins DG. 1997. The Clustal X windows interface: flexible strategies for multiple sequence alignment aided by quality analysis tools. Nucl. Acid Res. 24:4876-4882. Tzeng CS. 1986. Distribution of the freshwater
fishes of Taiwan. J. Taiwan Mus. 39:127–146. Wang JP, Hsu KC and Chiang TY. 2000.
Mitochondrial DNA phylogeography of
Acrossocheilus paradoxus (Cyprinidae) in
Taiwan. Mol. Ecol. 9:1483–1494
Wang JP, Lin HD, Huang S, Pan CH, Chen XL and Chiang TY. 2004. Phylogeography of
Varicorhinus barbatulus (Cyprinidae) in
Taiwan based on nucleotide variation of mtDNA and allozymes. Mol. Phylogenet. Evol. 31:1143–1156.
Xie ZG, Xie CX and Zhang E. 2003. Morphological variations among the Chinese species of
Sinibrama (Pisces: Teleostei: Cyprinidae),
with comments on their species validities. Zoological Research 24:321-330 (in chinese).
Phylogeography and Population Genetic Structure of Sinibrama
macrops Based on mtDNA
Kui-Ching Hsu
12, Kun-Chan Tsai
3, Kwang-Tsao Shao
2, Jiang-Ping Wang
1and Hung-Du Lin
1*1 Institute of Life Sciences, National Cheng Kung University
Tainan, Taiwan
2Research Center for Biodiversity, Academia Sinica
Taipei, Taiwan
3Institute of Biodiversity, National Cheng Kung University
Tainan, Taiwan
(Received: 7 June 2005, accepted: 17 October 2005)
ABSTRACT
The phylogeographical and population genetic structures of Sinibrama macrops were investigated based on genetic diversity of mtDNA. Significantly negative Tajima’s D statistics based on mtDNA suggest that most populations originated from a small number of founders followed by demographic expansion. High haplotype diversity (h = 0.999) and low nucleotide diversity (π= 0.009) may be attributed to expansion after a period of low effective population size. MtDNA analyses revealing evident geographical structuring suggest limited gene flow between populations (FST = 0.583).
Neighbor-joining tree of mtDNA identified one lineage suggest all population revealing lineage sorting. Nested clade analyses revealing significant associations between genetic structure and geographical division identify past fragmentation and/or Long-distance colonization as major phylogeographical events that shaped the geographical distribution of this species. According the nested clade analyses, the populations of the DanShui River and the Min River had the closed relationship. This result suggested the populations of the DanShui River would be originated from the Min River.