USING BALANCED SCORECARD AND SYSTEM DYNAMICS IN EXPLORING THE PERFORMANCE OF TAIWAN'S PHARMACEUTICAL INDUSTRY
TING-LIN LEE SHU-CHUAN YANG
Department of Asia-Pacific Industrial and Business Management, National University of Kaohsiung, 700, Kaohsiung University Rd., Nanzih District, Kaohsiung, 811, Taiwan,
[email protected]; [email protected] ABSTRACT
“Balanced Scorecard (BSC)” is one of the most popular ways of measuring performance and is usually used on enterprise level; only few studies have ever tried to use it on industry level. This study tries to combine BSC with SD in order to explore Taiwan’s pharmaceutical industry that had set up the relevant strategies of its development since 1982, but its contribution is still limited at present. Based on four dimensions of BSC, the related indicators will be conducted. The main purpose of this study is to investigate and build the complex system of Taiwan’s pharmaceutical industry; then, amend the policy direction to enhance its performance.
According to the outcomes of the simulation and analysis, some findings have been revealed as follows: (1) the policy of drug-cutting prices rate will result in the obvious slow-down of the domestic pharmaceutical market; (2) the most important fund sources of R&D mainly comes from the enterprise and venture capital; (3) in the long term, reducing 10% marketing funding and using this 10% to invest in R&D area will bring better performances in new drug development and sales value; (4) R&D funding is the best effective driving force for the increasing “R&D Capability” and “New Drugs Appear in the Market”; while training is the most important factor in the dimension of learning and growth for improving “Sales Value”.
Keywords: Balanced Scorecard (BSC), System Dynamics (SD), Pharmaceutical Industry, Performance
INTRODUCTION
Taiwan had formulated many relevant strategies and put a lot of resources to develop the pharmaceutical industry since 1982. However, there is still little contribution and the growth rate is worse than the other countries in Asian. Over the past few years, a considerable number of studies have been made on the performance of the pharmaceutical industry in Taiwan.
Since Kaplan and Norton proposed the concept “Balanced Scorecard” (BSC), it has been one of the most popular performance measure methods and also a strategic management approach. BSC is usually used on business unit level, and only few of the studies have ever tried to use it to analyze the performance of an industry’s development. Nevertheless, Science & Technology Policy Research and Information Center (STPI) points out that if the concept of enterprise is used to promote to the industry, or the national level tool is applied to the enterprise level, it will help the business and government to be more clearly carrying out the strategic planning and policy planning (David, 2008). Thus, the author attempts to use BSC on the industry level.
On the other hand, some literatures showed that the BSC theory and practice had some limitations. The root of limitations is “cause and effect are not closely related in time and space” (Tu, 2004). However, System Dynamics can make up its deficiency (Tu, 2004; Wu, 2005). Surprisingly, only few studies have so far been made at this point in Taiwan’s pharmaceutical industry. As a result, the author tries to take BSC and SD as the research methods to investigate and model the complex structure, behavior and performance in the pharmaceutical industry in Taiwan. The purpose of this study is attempted to combine BSC with SD to achieve
five objectives, including:
(i) Based on four dimensions of BSC, we try to find out the related indicators of the development to build the dynamic structure in this industry.
(ii) Mapping out the stocks and flows diagram to simulate and analyze the development of Taiwanese pharmaceutical industry in the future.
(iii) Finding out the key decision points which actually affect the performance of this industry in Taiwan. (iv) According to the result, the suggestions are given to amend the policy direction of this industry and
then to enhance the performance in Taiwan.
OVERVIEW OF PHARMACEUTICAL INDUSTRY
The characteristics of this industry are summarized by this study as following:
(i) Drug development requires an enormous amount of resources, including large R&D expensive, highly-skilled equipments, and so on.
(ii) The R&D process takes a long time: 10~12 years on average (Chang et al., 2005), and the successful rate of R&D is lower than other industries.
(iii) Its industrial structure is very complex, and the value chain is longer.
(iv) Specialization is deep and knowledge comes from different scientific domains. (v) Emphasize the intangible assets protection, such as intellectual property rights. (vi) Approval process comprises many rigorous phases and also takes a long time.
(vii) It is strictly management and control by government, and its mode of operation and pricing strategies are also influenced by government policies.
According to the above characterizations, we could realize that although the R&D expensive of pharmaceutical industry accounts for about 15-25% of the operating income. The profit and value-added is higher than other industries (Berardi, 2003; Hsia, 2008; Wang, 2004) (Table 1).
Table 1: Cost Effective Ratio of the Pharmaceutical Industry
Item Range (%) Average (%)
Income 100 100 Sales Cost 20~30 25 R&D Cost 15~25 20 Overhead 25~35 30 Operating Profit 40~10 25 Source: Berardi, 2003
According to “Diamond Action Plan for Biotech Takeoff”, “National Science and Technology Program for Biotechnology and Pharmaceuticals” and “2010 White Paper on the biotech industry in Taiwan”, we integrate the visions, strategies and objects about the development of Taiwan’s pharmaceutical industry as below:
• Vision: Establish Taiwan as an important part of international biotechnology community development and commercialization and assist Taiwan in becoming a R&D, manufacturing and operations center of biotechnology in Asia-Pacific region.
• Strategy:
(i) Strengthen the role of R&D in this industry’s value chain; focus on the industrial application development of R&D results, and help the research result smoothly transfer to industry.
government, academic and institute, and form a virtual R&D team of efficiency to contribute to the output of domestic drugs.
(iii) Shorten the time to market, build a good investment measures and environmental, and establish an alliance about drug export to expand domestic and foreign markets.
(iv) Expand the training and recruiting of biotechnology talent.
(v) Improve Taiwan’s pharmaceutical legal and regulatory environment. • Objective
(i) Increase R&D contribution in the field of biotechnology to some 3% of GDP by 2014. (ii) Increase the annual output value of biotech industry to more than US$30.86bn (2010~2014).
BALANCED SCORECARD (BSC)
Four Perspectives of BSC
Different from the traditional methods, the balanced scorecard supplemented traditional financial measures with criteria that measured performance from three additional perspectives – those of customers, internal business processes, and learning and growth (Kaplan & Norton, 1996a).
(i) Learning and Growth: Organizational learning and growth come from three principal sources: people, systems, and organizational procedures (Kaplan & Norton, 1996b). In this dimension, the staffs’ competence, technological structure, and culture must be clarified, then the organization will be able to adjust the human resources and information technology to act in concert with the mission and strategy (Kaplan & Norton, 2000).
(ii) Internal Business Processes: According to Kaplan and Norton’s report (Kaplan & Norton, 1996b), the internal business processes include three parts: innovation cycle – the long-wave of value creation, operations cycle –short-wave, and post-sale service cycle – middle-wave. Therefore, a comprehensive strategy should be pursued at these parts, and then to generate the revenue (Kaplan & Norton, 2000). (iii) Customer: It is to measure the organization’s ability to achieve overall customer satisfaction. Kaplan and
Norton (Kaplan & Norton, 1996b) consider that core outcome measures include customer satisfaction, customer retention, new customer acquisition, customer profitability, and market and account share in targeted segments.
(iv) Financial: This perspective focuses on the ability to make profit; it includes measures such as operating income, revenue growth, cost reduction, asset utilization and economic value added (Bader, 2007; Kuo, 2004). At the different stage of the life cycle, an organization should development different financial indicators to link with its different strategical goals.
Cause and Effect Relationships
A strategy is a set of hypotheses about cause and effect (Kaplan & Norton, 1996b). The balanced scorecard links a series of strategies, objectives and measures that are both consistent and mutually reinforcing (Kaplan & Norton, 1996b). Thus, Kaplan and Norton (1996b) assume the balance scorecard is like a flight simulator, it should incorporate the complex set of cause-and-effect relationships among the critical variables and feedback loops that describe the trajectory, the plan, and the strategy.
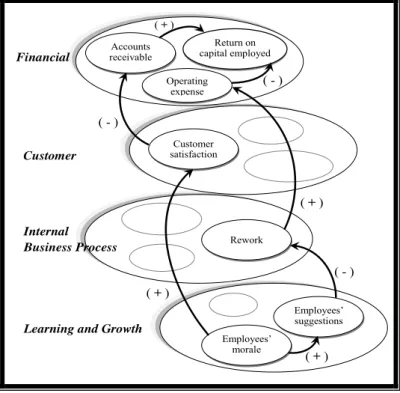
The chain of cause and effect should pervade all four perspectives of BSC (Kaplan & Norton, 1996b), and the relationship between these perspectives is: measures of organizational learning and growth → measures of
internal business processes → measures of the customer perspective → financial measures (Nørreklit, 2000),
see Figure 1. Therefore, learning and growth perspective is the root of the scorecard, and it is also the drivers of the internal business processes. Similarly, internal business process is the driver of customer perspective, and the drivers of financial measures come from customer perspective (Kaplan & Norton, 1996b; Nørreklit, 2000). The emphasis on cause and effect in constructing a scorecard introduces dynamic systems thinking.
Figure 1: How to linked measures from the four perspectives Source: Kaplan & Norton, 1996a
The Limitations of BSC
A number of inherent weaknesses have also been reported in the BSC literature (Akkermans & Oorschot, 2002). These disadvantages are described below.
(i) Cause and effect are not closely related in time and space: BSC measures cause and effect at the same time without considering any time lag, so it has no time dimension (Nørreklit, 2000). This limitation which is fail to judge and certify the influence of events’ time-delay causes the user focus on the short-term object and ignore the long-term influence (Tu, 2004).
(ii) Unidirectional causality too simplistic: The use of causal-loops alone is seen as problematic because these loops do not capture the notion of strategic factors accumulating and depleting (Akkermans & Oorschot, 2002). Nørreklit (2000) even questions the existence of one-way causality which only links from bottom to top between the areas of measurement in the BSC. This author believes that the relationship is more one of interdependence, or bi-directional causality.
Promoting the BSC should focus on the strategy alignment between four dimensions. However, because of these limitations, the decision makers will make the wrong decisions and actions. Thus, the related scholars have addressed various studies about using “System Dynamics” to support and improve the BSC.
SYSTEM DYNAMICS (SD)
SD is an approach which combines the theory, methods, and philosophy needed to analyze the behavior of systems. It can provide a common foundation that can be applied wherever we want to understand and influence how things change through time in not only management, but also in environmental change, politics,
Employees’ suggestions Employees’ morale Rework Customer satisfaction Return on capital employed Operating expense Accounts receivable ( - ) ( - ) ( - ) ( + ) ( + ) ( + ) ( + ) Financial Customer Internal Business Process
economic behavior, medicine, engineering, and other fields (Forrester, 1991).
Sterman (2000) considers that learning about complex dynamic systems requires more than technical tools to create mathematical models. In addition to be grounded in the theory of nonlinear dynamics and feedback control developed in mathematics, physics, and engineering, SD also draws on cognitive and social psychology, economic, and other social sciences. Thus, SD is fundamentally interdisciplinary and very suitable to support managers to learn and understand complex systems.
Su (1988) describes SD as a quantitative method that is based on the theory of feedback control and takes the computer simulation as a mean to study the complex social and economic systems. Han (2002) also emphasizes that the application of SD must be based on system thinking to build the system model, and takes the computer simulation as a mean to verify the system behavior. By this application, we can truly grasp the essence of SD, and then understand the superiority and uniqueness of SD.
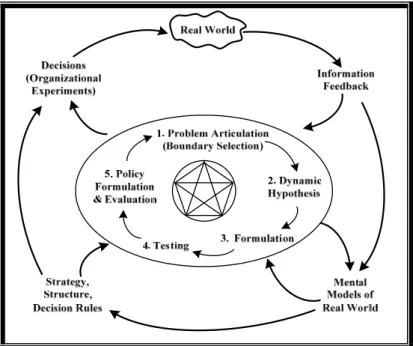
From these descriptions, we can know that SD is a method to understand how things change and influence over time. By applying computer simulation, SD can show how structure, policies, decisions and time delays within organizations and business systems are interrelated and influence growth and stability (Lee, 2006), and further help us to learn about dynamic complexity and sources of policy resistance, and provide more effective policy suggestions (Sterman, 2000). The author uses the modeling process proposed by Sterman (2000) to provide a whole picture of the implementation of modeling real world problems.
(i) Articulating the problem to be addressed (Boundary Selection). (ii) Formulating a dynamic hypothesis about the causes of the problem. (iii) Formulating a simulation model to test the dynamic hypothesis. (iv) Testing the model until satisfied that it is suitable for the purpose. (v) Designing and evaluating policies for improvement.
This process which embedded in single- and double-feedback learning loops is as Figure 2. It shows an effective modeling involves constant iteration between experiments and learning in virtual world and real world (Lee, 2006; Sterman, 2000).
Figure 2: Modeling is embedded in the dynamics of the system Source: (Sterman, 2000)
RESEARCH METHODOLOGY
Research Framework
Based on four dimensions of BSC, the first section is translating strategies into KPI which is sorted out from literature review and expert interviews. Second, according to the concepts of BSC and SD we build the model of this research. Sequentially, the author applies the computer simulation to find the key decision points which actually affect the performance. Finally, propose the improvement strategies (see Figure 3).
Figure 3: The conceptual structure of this research
Boundary Selection, Main Variables and Data Collection
In this study, the main stress falls on that whether increased the R&D input will truly influence the pharmaceutical performance in the future. The research subject is focused on domestic pharmaceutical industry. And only discusses four BSC dimensions of the R&D strategy, out of these parts, like foreign direct investment (FDI), ethics, or political elections are not the scopes of this paper.
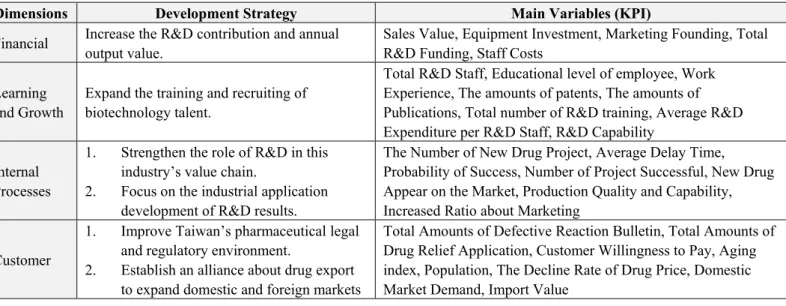
According to the development strategy, literature review and expert interview, the measured variables are selected as Table 2. Expert interview is designed to confirm the relationship between each variable and to estimate the value of some parameters. The interviewees include 2 experts in pharmaceutical firm, 2 experts in government, 3 experts in the research institution and 1 expert in academic institution. The period of interview is from the 14th of April, 2011 to the 18th of April, 2011.
Table 2: The Main Strategies and Variables of Four Dimensions
Dimensions Development Strategy Main Variables (KPI)
Financial Increase the R&D contribution and annual output value. Sales Value, Equipment Investment, Marketing Founding, Total R&D Funding, Staff Costs Learning
and Growth
Expand the training and recruiting of biotechnology talent.
Total R&D Staff, Educational level of employee, Work Experience, The amounts of patents, The amounts of Publications, Total number of R&D training, Average R&D Expenditure per R&D Staff, R&D Capability
Internal Processes
1. Strengthen the role of R&D in this industry’s value chain.
2. Focus on the industrial application development of R&D results.
The Number of New Drug Project, Average Delay Time, Probability of Success, Number of Project Successful, New Drug Appear on the Market, Production Quality and Capability, Increased Ratio about Marketing
Customer
1. Improve Taiwan’s pharmaceutical legal and regulatory environment.
2. Establish an alliance about drug export to expand domestic and foreign markets
Total Amounts of Defective Reaction Bulletin, Total Amounts of Drug Relief Application, Customer Willingness to Pay, Aging index, Population, The Decline Rate of Drug Price, Domestic Market Demand, Import Value
SD depends heavily upon quantitative data to generate feed models (Luna-Reyes & Andersen, 2003). Therefore, secondary data is collected from many databases, including “Science and Technology Statistics”, “National Statistics”, “Taiwan Food and Drug Administration”, and so on. The data collection covers the period from 2001 to 2009. Simulation time is expected to 2020. The simulation tool is Vensim DSS for Windows Version 5.6a which was developed by Ventana Systems, Inc.
MODEL CONSTRUCTION AND TESTING
Dynamic Hypothesis in Causal Loop Diagrams
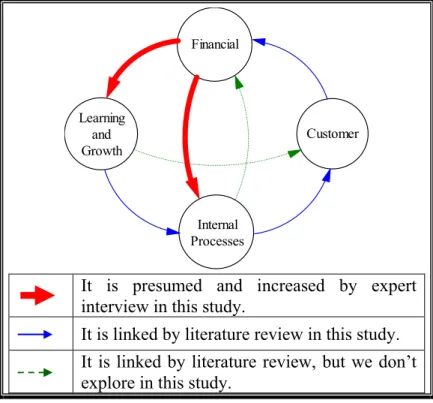
According to the literature review, BSC is a one-way causality link from “Learning and Growth” to “Financial” (see Figure 1 and the blue lines of Figure 4) and is unable to form a feedback loop to simulate the complicated environment. The pharmaceutical industry is a R&D-intensive industry and the R&D expenditure accounts for about 15-25% of the operating income. If there is no R&D investment, R&D would be difficult to improve. Thus, we can know that the dimension of “Financial” should also be linked to “Learning and Growth”. On the other hand, by the expert interview, we can know that not only the dimension of “Learning and Growth”, “Financial” is also an important dimension to provide the needed funding in the improving of “Internal Processes” (refers to Figure 4).
It is presumed and increased by expert interview in this study.
It is linked by literature review in this study. It is linked by literature review, but we don’t explore in this study.
Figure 4: Four dimensions of BSC
For these reasons, the author uses the key variables (Table 2) and the concept of SD to link four dimensions of BSC and to plot a causal loop diagram (Appendix A).
(i) Financial: Financial dimension includes three parts: total R&D founding, marketing founding and equipment investment. Unlike Japan and Korea, about 98% of Taiwan’s enterprises are small-and-medium size. They are unable to afford enormous long-term R&D expenditures for high technology, although their strong flexibility and adaptability enable these businesses to survive (Lee, 2006). Thus, total R&D founding has three resources: corporate, government and venture capital in Taiwan. Corporate R&D funding comes from sales value, and it will be distributed to different purposes, such as R&D staff cost and so on. Due to corporate R&D funding, marketing founding and equipment investment all come from
Financial Learning and Growth Internal Processes Customer
sales value. Thus, when sales value increases, corporate R&D funding, marketing founding and equipment will increase. In addition, when the ratio of import increased, it represented the market force of domestic is relatively weakened. When enterprises in order to enhance their market force, they may increase marketing expenditure to face the charge and improve market demand (Chinese Encyclopedia Online, 1983; MBA-Library, 2010). On the other hand, the R&D founding which is invested by the government comes from National Science and Technology Program for Biotechnology and Pharmaceuticals (NSTPBP) or other developmental plans. When the government encourages this industry and takes the lead to invest, the venture capital is attracted to invest in this industry. Under the other constant variables constant, when one of the R&D funding resources is increased, total R&D founding will increase.
(ii) Learning and Growth: R&D staff cost comes from corporate R&D funding. When increased the R&D founding, R&D staff cost can be increased and the companies can also hire more R&D staff. However, if “Average Annual Salary per Researcher” is raised, “Total R&D Staff” will be negatively affected. In the knowledge economy era, the first emphases are on the knowledge and innovation. The knowledge (intangible assets) has gradually exceeded the general tangible assets, and it can create the greatest value for enterprises. R&D capability is the major factor to affect enterprises' revenue and value, and the quantity and quality of patents are enough to reflect the company's R&D capabilities (Kasch & Dowling
2008; Lii, 2006). The Nobel Prize economist, Gary Becker, thought that education, training and so on is
the investment in human capital (Lii, 2006). In addition to the quantity of patents, education and training, work experience, publications and average R&D Expenditure per R&D Staff are also positively related with human capital. Human capital is an important factor to enhance R&D capability in this era. Thus, when these human capital factors are increased, R&D capability will increase.
(iii) Internal Processes: According to Kaplan and Norton (1996b), the internal business processes include three parts: innovation cycle, operation cycle and post-sale service cycle. The pharmaceutical industry is a R&D-oriented industry, thus, R&D capability can affect the development of this industry. Through the expert interview, most experts believe that the enhancement of R&D capability can reduce developing time and improve the chances of success in drug development stage. Thus, the stage which is from “R&D Capability” to “New Drug Appear on the Market” is represented the innovation stage. Theory of total quality management points out that human is the basis for quality improvement. When staffs receive the relevant training to improve the manufacturing and service process, it cannot only reduce costs, but also reduces product defect rate and then enhances customer satisfaction (Wen, 2006). By expert interview, we check that “increases the founding of equipment” can enhance the quality and capability of production. Thus, amounts of staffs training and the increased ratio about equipment investment represent the quality and capability of production in operation stage. According to expert interview, the reputation of drugs and manufacturers is one of factors affecting customers’ willingness to pay. Marketing founding is the mainly resource to establish the reputation of drugs and manufacturers. Thus, the author uses the increased ratio about marketing founding to represent the post-sale service cycle.
(iv) Customer: Because Taiwan’s pharmaceutical market is the sixth largest in Asia Pacific (Business Monitor International, 2010), the proportion of imports are increased year by year. Thus, the author emphasizes customer willingness to pay in this regard. There are many factors to influence consumer purchase behavior. this study focuses on six factors, including aging index, quality and capability of production, marketing funding, number of new drug, defective reaction bulletin and drug relief application. This industry is closely related to aging index. With the increase of aging index, the ratio of customers’
willingness to pay will increase. The quality and capability of production, marketing founding and number of new drug are also the positive factors to influence customer willingness. However, the increasing ratio of defective reaction bulletin and the increasing ratio of drug relief application are the negative factors to affect customer willingness to buy pharmaceutical products. If the customers’ willingness is expanded, the domestic demand of drugs market will increase, and sales value can also be raised in this industry. Domestic market demand is also affected by population and the decline rate of drug price. Owing to the continually growing population, the demand of drugs will increase substantially. Also, because of the financial difficulties, Bureau of National Health Insurance gradually lowered the drug prices in recent year (Chiu, 2008). Thus, if the drug price is changed, the actual payment of drug amount will also change. With the expansion of domestic market demand, foreign manufacturers will be attracted, thus the value of imports will increase. If the value of imports increases, sales value will decrease. On the other hand, supposed the export increases, sales value will increase. Thus, sales value will be affected by three forces, including domestic market demand, import and export.
Flow Diagrams
Causal loop diagram acts as a “mapping language” but lacks discipline (Lee, 2006). Thus, it is only a tool to help the system thinking. If it wants to be used to simulate, it should be changed into the stock and flow map. The stock and flow model corresponds exactly to a system of integral or differential equations (Sterman, 2000). By this model, we can show an important phenomenon, “the accumulation of things”, in the dynamic system. In this section, Step 3: formulating a simulation model to test the dynamic hypothesis is done as Appendix B.
Model Testing
All models are limited, simplified representations of the real world, but we can build confidence that a model is appropriate for the purpose by model testing. Thus, Step 4: Testing the model until satisfied that it is
suitable for the purpose will be done. In this section, we discuss the validity of our research model by three
methods, including dimensional-consistency test, extreme-condition test and pattern of oscillation. The first two are advanced by Forrester & Senge (1979) and the last one is purposed by Hsieh (1980).
(i) Dimensional-consistency Test:
The first and basic task among testing the model structure is checking that an equation is dimensionally consistent. By using the “Unit Check” function of Vensim DSS to test, the units of equations including stocks, flows, auxiliaries and constants are consistent during the process of modeling and simulation. This result also represents that this model structure is considered robust and no problem in dimensional consistency test.
(ii) Extreme-condition Test:
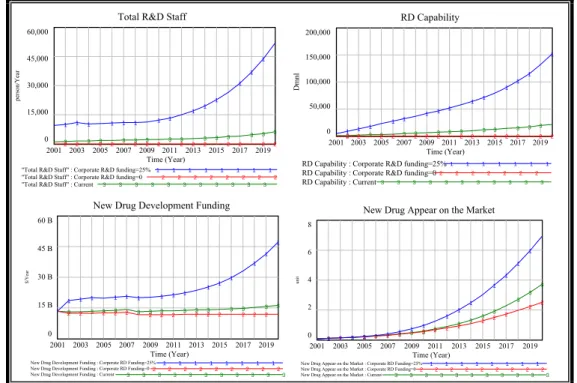
Extreme condition test asks whether the model behave appropriately when the inputs take on extreme values such as zero or infinity (Lee, 2006). On the other word, we can check the model is robust or not in extreme conditions by this test. In this research, we assume two situations to test: (1) the ratio of corporate R&D funding is equal to 25% which is the max in global pharmaceutical industry based on Berardi (2003) (see Table 1); (2) the ratio of corporate R&D funding is equal to zero.
In the proposed model, the learning and growth dimension absolutely depend on the corporate R&D funding. Once the ratio of this funding equals to 25%, there are more funding to hire more R&D staffs and R&D capability will quickly increase. However, if in the condition about minimum ratio of this funding, there is no funding to pay the salary that no R&D staffs can be hire. If there are no R&D staffs in this industry, the
R&D area cannot be developed to accumulate R&D capability. Figure 5 correctly reports the results.
One of the resources about new drug development funding is corporate R&D funding. In max condition about corporate R&D funding, there will be a substantial increase in new drug development funding. And there will be more new drugs appeared on the market (Figure 5). As the above result of test, the extreme-condition test is reasonable and can be built confidence.
Figure 5: Extreme-condition Test Result
(iii) Pattern of Oscillation:
According to Hsieh (1980), SD is often under attack and happened fluctuations and oscillations by external forces. To make sure that the proposed model is adequate, we can examine whether the oscillation pattern of our model fits the real system’s pattern. In Figure 6, the oscillation pattern of the real system (red line) and the model (blue line) are very close. It indicates that this model is close to the real situation. As the results, the proposed model has been validated by this comparison.
Figure 6: The Comparison Chart
SIMULATION AND ANALYSIS
One of main purposes is to find key decision points to amend the policy direction in Taiwanese. For this reason, we presume four scenarios to simulate that when some variables are changed, how they affect the performance. In these scenarios, the changed variables are divided to two types including “controlled variables” which is mean we can change them by policy and “uncontrollable variables” which is mean the trend of natural
Total R&D Staff 60,000 45,000 30,000 15,000 0 3 3 3 3 3 3 3 3 3 3 3 3 3 3 2 2 2 2 2 2 2 2 2 2 2 2 2 2 1 1 1 1 1 1 1 1 1 1 1 1 1 1 2001 2003 2005 2007 2009 2011 2013 2015 2017 2019 Time (Year) person/ Y ear
"Total R&D Staff" : Corporate R&D funding=25% 1 1 1 1 1 1 1 1 "Total R&D Staff" : Corporate R&D funding=0 2 2 2 2 2 2 2 2
"Total R&D Staff" : Current 3 3 3 3 3 3 3 3 3 3 3
RD Capability 200,000 150,000 100,000 50,000 0 3 3 3 3 3 3 3 3 3 3 3 3 3 2 2 2 2 2 2 2 2 2 2 2 2 2 2 1 1 1 1 1 1 1 1 1 1 1 1 1 1 2001 2003 2005 2007 2009 2011 2013 2015 2017 2019 Time (Year) Dmnl
RD Capability : Corporate R&D funding=25%1 1 1 1 1 1 1
RD Capability : Corporate R&D funding=02 2 2 2 2 2 2
RD Capability : Current3 3 3 3 3 3 3 3 3 3 3
New Drug Development Funding 60 B 45 B 30 B 15 B 0 3 3 3 3 3 3 3 3 3 3 3 3 3 3 2 2 2 2 2 2 2 2 2 2 2 2 2 2 1 1 1 1 1 1 1 1 1 1 1 1 1 1 1 2001 2003 2005 2007 2009 2011 2013 2015 2017 2019 Time (Year) $/Year
New Drug Development Funding : Corporate RD Funding=25% 1 1 1 1 1 1 1 1
New Drug Development Funding : Corporate RD Funding=02 2 2 2 2 2 2 2 2
New Drug Development Funding : Current 3 3 3 3 3 3 3 3 3 3 3
New Drug Appear on the Market
8 6 4 2 0 3 3 3 3 3 3 3 3 3 3 3 3 3 3 3 2 2 2 2 2 2 2 2 2 2 2 2 2 2 2 1 1 1 1 1 1 1 1 1 1 1 1 1 1 1 2001 2003 2005 2007 2009 2011 2013 2015 2017 2019 Time (Year) uni t
New Drug Appear on the Market : Corporate RD Funding=25% 1 1 1 1 1 1 1 1
New Drug Appear on the Market : Corporate RD Funding=02 2 2 2 2 2 2 2 2
New Drug Appear on the Market : Current 3 3 3 3 3 3 3 3 3 3 3
Sales Value 80 B 70 B 60 B 50 B 40 B 2 2 2 2 2 2 2 2 1 1 1 1 1 1 1 1 2001 2002 2003 2004 2005 2006 2007 2008 2009 Time (Year) $/ Y ear
Sales Value : Current1 1 1 1 1 1 1 1 1 1 1 1
Sales Value : ReferenceMode 2 2 2 2 2 2 2 2 2
Actual Domestic Market Demand
200 B 165 B 130 B 95 B 60 B 2 2 2 2 2 2 2 2 1 1 1 1 1 1 1 1 2001 2002 2003 2004 2005 2006 2007 2008 2009 Time (Year) $/ Y ear
Actual Domestic Market Demand : Current 1 1 1 1 1 1 1 1 1 Actual Domestic Market Demand : ReferenceMode 2 2 2 2 2 2 2 2
development such as “population” (refer to Table 3).
Table 3: The Comparison of the Variables Changed by Policy or Natural
Controlled Uncontrollable
Scenario 1:
The Policy about Drug Prices
1. NSTPBP Funding
2. The Ratio of Corporate R&D Funding 3. Average Annual Salary per Researcher 4. Average Level of Education
5. The Ratio of R&D Training Opportunities 6. Total Amounts of Training Opportunities
from Corporate
7. Total Amounts of Training Opportunities from Government
8. The Decline Rate of Drug Price
1. Total Amounts of Drug Relief Application 2. Total Amounts of Defective Reaction Bulletin 3. Aging Index 4. Population Scenario 2: Resources of R&D Funding 1. NSTPBP Funding 2. Corporate RD Funding 3. Venture Capital
No variables have been changed in this part.
Scenario 3:
Corporate Should Choice R&D or Marketing?
1. Basic Ratio of Marketing Investment 2. The Ratio of Corporate R&D Funding
No variables have been changed in this part
Scenario 4:
Improve R&D Performance
1. The Ratio of Corporate R&D Funding 2. Publications
3. Patent
4. Work Experience 5. Training
6. Education Level
No variables have been changed in this part
Scenario 1: The Policy about Drug Prices
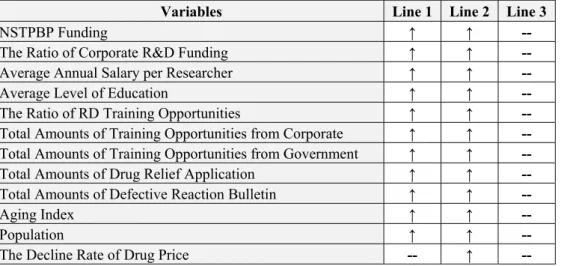
The collected date is taken from 2001 to 2009 in this study, and the data from 2010 to 2020 is assumed. We will compare two conditions: the data after 2009 (1) is increased or decreased as the trend from 2001 to 2009; (2) is same as 2009. First one is an inferences based on the historical trajectory and second is a conservative estimate. In order to compare the utility of “The Decline Rate of Drug Price (TDRDP)”, we assume the first condition of this variable is same as second condition, and the first line represents this assumption (Table 4). The second line represents “the data after 2009 is increased or decreased as the trend from 2001 to 2009” and the third line represents “the data after 2009 is same as 2009”.
Table 4: The Comparison of Three Lines in Scenario 1
Variables Line 1 Line 2 Line 3
NSTPBP Funding ↑ ↑ --
The Ratio of Corporate R&D Funding ↑ ↑ --
Average Annual Salary per Researcher ↑ ↑ --
Average Level of Education ↑ ↑ --
The Ratio of RD Training Opportunities ↑ ↑ --
Total Amounts of Training Opportunities from Corporate ↑ ↑ --
Total Amounts of Training Opportunities from Government ↑ ↑ --
Total Amounts of Drug Relief Application ↑ ↑ --
Total Amounts of Defective Reaction Bulletin ↑ ↑ --
Aging Index ↑ ↑ --
Population ↑ ↑ --
The Decline Rate of Drug Price -- ↑ --
In Figure 7, first line and second line are in the same side in first two charts, but they are in different sides in “Actual Domestic Market Demand (ADMD)” and “Sales Value (SV)”. The diagrams about “ADMD” and “SV” tell us that when the trend from 2010 to 2020 of those variables except “TDRDP” is same as 2008 to
2009, the performance will be greater than the other two conditions. However, when the trend from 2010 to 2020 of “TDRDP” is also same as 2008 to 2009, the performance is poorer than other two conditions. In common sense, the output should be proportional to the input. The second line is input more resource than the third line, but the performance is poorest. Thus, this result is contrary to common sense. By this simulation, “TDRDP” can be recognized as an important key decision point. The change of this variable will change the result of “SV” in this industry. Therefore, this key point must be taken seriously and discussed.
Figure 7: The Comparison in The Decline Ratio of Drug
Scenario 2: Resources of R&D Funding
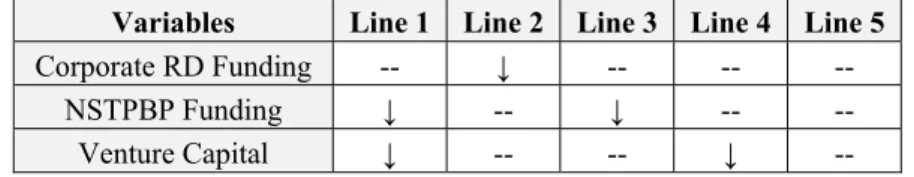
This situation is assumed to explore when the resources of R&D funding changed (Table 5), how it affects the performance of this industry. Here we assume each resource of R&D funding will decrease to 0 from 2010 to 2020. In general, the investment of government will affect the venture capital, thus the first line is assumed to that the “NSTPBP Funding” decrease to 0 from 2010 to 2020 and “Venture Capital” reduces to half from 2010 to 2020. The second, third and fourth lines are assumed to that “Corporate R&D Funding”, “NSTPBP Funding” and “Venture Capital” decrease to 0 from 2010 to 2020.
Table 5: The Comparison of Five Lines in Scenario 2(1)
The simulation results can be found that “The Number of New Drug Project” will be the worst when the venture capital decreased to 0 from 2010 to 2020 (see Figure 8, line 4), but this is not the most influential to affect the performance of “New Drug Appear on the Market”. We also can know that when the corporate R&D
funding decreases to 0 (line 2), it is the most important factor which affects the performance of “Number of Project Successful”. However, these changes almost make no impact on “SV”. The author speculates that the
RD Capability 40,000 30,000 20,000 10,000 0 3 3 3 3 3 3 3 3 3 3 3 3 3 3 2 2 2 2 2 2 2 2 2 2 2 2 2 2 1 1 1 1 1 1 1 1 1 1 1 1 1 1 2001 2003 2005 2007 2009 2011 2013 2015 2017 2019 Time (Year) Dmn l
RD Capability : After 2009, the trend is same as 2008 to 2009 (maintain drug price) 1 1 1 1 1 1
RD Capability : After 2009, the trend is same as 2008 to 2009 2 2 2 2 2 2 2 2
RD Capability : Current 3 3 3 3 3 3 3 3 3 3 3 3 3
The Number of New Drug Project 400 325 250 175 100 3 3 3 3 3 3 3 3 3 3 3 3 3 3 2 2 2 2 2 2 2 2 2 2 2 2 2 2 2 1 1 1 1 1 1 1 1 1 1 1 1 1 1 1 2001 2003 2005 2007 2009 2011 2013 2015 2017 2019 Time (Year) un it/Y ea r
The Number of New Drug Project : After 2009, the trend is same as 2008 to 2009 (maintain drug price) 1 1 1
The Number of New Drug Project : After 2009, the trend is same as 2008 to 2009 2 2 2 2 2 2
The Number of New Drug Project : Current 3 3 3 3 3 3 3 3 3 3 3
Actual Domestic Market Demand 600 B 450 B 300 B 150 B 0 3 3 3 3 3 3 3 3 3 3 3 3 3 3 2 2 2 2 2 2 2 2 2 2 2 2 2 2 1 1 1 1 1 1 1 1 1 1 1 1 1 1 2001 2003 2005 2007 2009 2011 2013 2015 2017 2019 Time (Year) $/ Y ear
Actual Domestic Market Demand : After 2009, the trend is same as 2008 to 2009 (maintain drug price) 1 1 1
Actual Domestic Market Demand : After 2009, the trend is same as 2008 to 2009 2 2 2 2 2 2
Actual Domestic Market Demand : Current 3 3 3 3 3 3 3 3 3 3 3
Sales Value 400 B 300 B 200 B 100 B 0 3 3 3 3 3 3 3 3 3 3 3 3 3 3 2 2 2 2 2 2 2 2 2 2 2 2 2 2 1 1 1 1 1 1 1 1 1 1 1 1 1 1 2001 2003 2005 2007 2009 2011 2013 2015 2017 2019 Time (Year) $/ Y ear
Sales Value : After 2009, the trend is same as 2008 to 2009 (maintain drug price) 1 1 1 1 1 1
Sales Value : After 2009, the trend is same as 2008 to 2009 2 2 2 2 2 2 2 2 2
Sales Value : Current 3 3 3 3 3 3 3 3 3 3 3 3 3 3
Variables Line 1 Line 2 Line 3 Line 4 Line 5
Corporate RD Funding -- ↓ -- -- --
NSTPBP Funding ↓ -- ↓ -- --
performance of this industry may take longer time to be affected. Thus, the next testing is done as follow.
Figure 8: Resources of R&D Funding- Decreased from 2010 to 2020
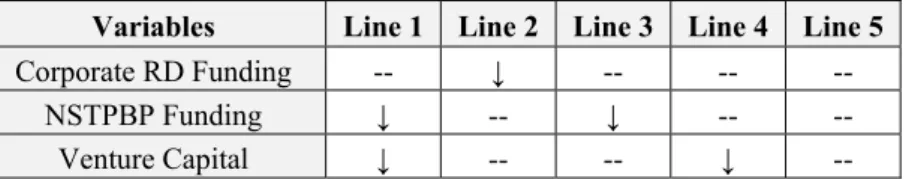
In order to observe the impact of funding resources and make sure the reason of development time, we assume the resources are gradually reduced to 0 from 2001 to 2020 (Table 6).
Table 6: The Comparison of Five Lines in Scenario 2(2)
Variables Line 1 Line 2 Line 3 Line 4 Line 5
Corporate RD Funding -- ↓ -- -- --
NSTPBP Funding ↓ -- ↓ -- --
Venture Capital ↓ -- -- ↓ --
These charts (Figure 9) indicate that the most ineffective factor is reducing “NSTPBP Funding” to 0 (line 3). And reducing corporate RD funding is the most effective factor (line 2). These results are same as first testing in Situation 2. The only difference is that there still has an impact on “SV” in here. The result of these two tests is that although the R&D investment was reduced to zero within a short time had no effect on Taiwanese pharmaceutical industry, but it had an obvious effect on the long-term. This finding agrees with our conjecture in the first testing of Situation 2.
Figure 9: Resources of R&D Funding- Decreased from 2001 to 2020 The Number of New Drug Project
200 150 100 50 0 5 5 5 5 5 5 5 5 4 4 4 4 4 4 4 4 4 3 3 3 3 3 3 3 3 3 2 2 2 2 2 2 2 2 2 1 1 1 1 1 1 1 1 1 2001 2003 2005 2007 2009 2011 2013 2015 2017 2019 Time (Year) un it/Year
The Number of New Drug Project : No NSTPBP Funding→Venture Capital decrease doubl 1 1 1
The Number of New Drug Project : No Corporate R&D Funding 2 2 2 2 2
The Number of New Drug Project : No NSTPBP Funding 3 3 3 3 3
The Number of New Drug Project : No Venture Capital 4 4 4 4 4 4
The Number of New Drug Project : Current 5 5 5 5 5 5 5
New Drug Appear on the Market
4 3 2 1 0 5 5 5 5 5 5 5 5 5 4 4 4 4 4 4 4 4 4 3 3 3 3 3 3 3 3 3 2 2 2 2 2 2 2 2 2 1 1 1 1 1 1 1 1 1 2001 2003 2005 2007 2009 2011 2013 2015 2017 2019 Time (Year) unit
New Drug Appear on the Market : No NSTPBP Funding→Venture Capital decrease doubl 1 1 1
New Drug Appear on the Market : No Corporate R&D Funding 2 2 2 2 2
New Drug Appear on the Market : No NSTPBP Funding 3 3 3 3 3
New Drug Appear on the Market : No Venture Capital 4 4 4 4 4 4
New Drug Appear on the Market : Current 5 5 5 5 5 5 5
Number of Project Successful
0.8 0.6 0.4 0.2 0 5 5 5 5 5 5 5 5 4 4 4 4 4 4 4 4 4 3 3 3 3 3 3 3 3 3 2 2 2 2 2 2 2 2 2 1 1 1 1 1 1 1 1 1 2001 2003 2005 2007 2009 2011 2013 2015 2017 2019 Time (Year) un it/Ye ar
Number of Project Successful : No NSTPBP Funding→Venture Capital decrease doubl 1 1 1 1
Number of Project Successful : No Corporate R&D Funding 2 2 2 2 2
Number of Project Successful : No NSTPBP Funding 3 3 3 3 3 3
Number of Project Successful : No Venture Capital 4 4 4 4 4 4
Number of Project Successful : Current 5 5 5 5 5 5 5
Sales Value 400 B 300 B 200 B 100 B 0 5 5 5 5 5 5 5 5 4 4 4 4 4 4 4 4 3 3 3 3 3 3 3 3 2 2 2 2 2 2 2 2 2 1 1 1 1 1 1 1 1 1 2001 2003 2005 2007 2009 2011 2013 2015 2017 2019 Time (Year) $/ Year
Sales Value : No NSTPBP Funding→Venture Capital decrease doubl 1 1 1 1 1
Sales Value : No Corporate R&D Funding 2 2 2 2 2 2
Sales Value : No NSTPBP Funding 3 3 3 3 3 3 3
Sales Value : No Venture Capital 4 4 4 4 4 4 4
Sales Value : Current 5 5 5 5 5 5 5 5
New Drug Appear on the Market
4 3 2 1 0 5 5 5 5 5 5 5 5 5 4 4 4 4 4 4 4 4 4 3 3 3 3 3 3 3 3 3 2 2 2 2 2 2 2 2 2 1 1 1 1 1 1 1 1 1 2001 2003 2005 2007 2009 2011 2013 2015 2017 2019 Time (Year) unit
New Drug Appear on the Market : No NSTPBP Funding→Venture Capital decrease doubl 1 1 1
New Drug Appear on the Market : No Corporate R&D Funding 2 2 2 2 2
New Drug Appear on the Market : No NSTPBP Funding 3 3 3 3 3
New Drug Appear on the Market : No Venture Capital 4 4 4 4 4 4
New Drug Appear on the Market : Current 5 5 5 5 5 5 5
Sales Value 400 B 300 B 200 B 100 B 0 5 5 5 5 5 5 5 5 4 4 4 4 4 4 4 4 3 3 3 3 3 3 3 3 2 2 2 2 2 2 2 2 2 1 1 1 1 1 1 1 1 1 2001 2003 2005 2007 2009 2011 2013 2015 2017 2019 Time (Year) $/ Y ear
Sales Value : No NSTPBP Funding→Venture Capital decrease doubl 1 1 1 1 1
Sales Value : No Corporate R&D Funding 2 2 2 2 2 2
Sales Value : No NSTPBP Funding 3 3 3 3 3 3 3
Sales Value : No Venture Capital 4 4 4 4 4 4 4
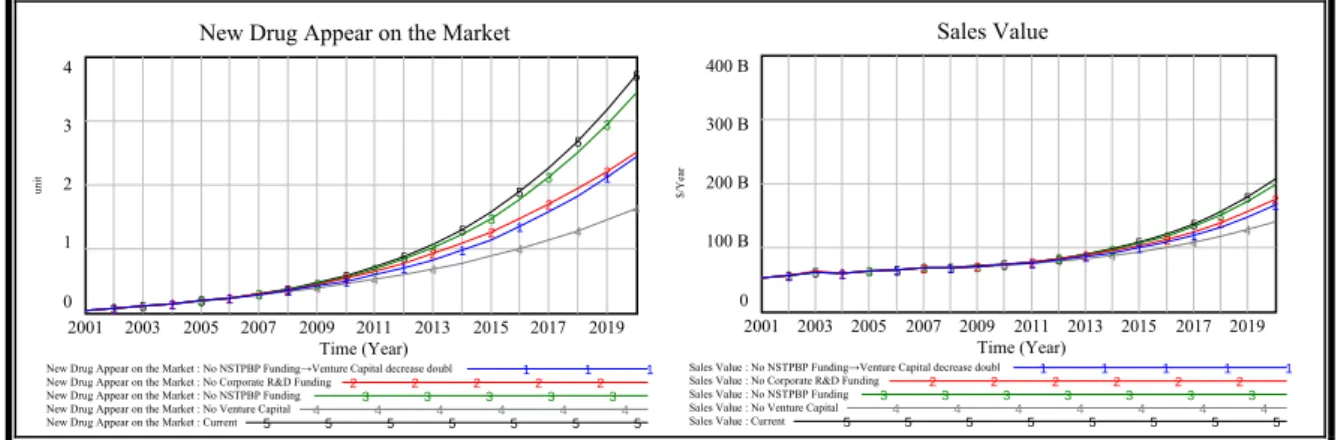
On the other hand, we do another testing to find the most important resource of developing Taiwanese pharmaceutical industry. In this test, we assume each of these resources is equal to 0 from 2001 to 2020. By the way, the first line is assumed to that “NSTPBP Funding” is equal to 0 and “Venture Capital” is affected by “NSTPBP Funding” to reduce a half of investment. The assumed of five lines are showed as Table 7 and the simulation results are presented in Figure 10.
Table 7: The Comparison of Five Lines in Scenario 2(3)
Variables Line 1 Line 2 Line 3 Line 4 Line 5
Corporate RD Funding -- 0 -- -- --
NSTPBP Funding 0 -- 0 -- --
Venture Capital Half -- -- 0 --
As the diagram indicates, new drug development and the performance of the whole industry will be the worst without “Venture Capital” (line 4). On the other hand, the first line represents that if there has a highly correlation between government investment and venture capital, when the government does not invest any funds to affect the venture capital decreasing to a half, it will also have a significant impact on the performance of the whole industry (line 1).
Compared with the previous two tests in situation 2, the corporate R&D funding is not the most influential factor in this test (line 2). That is due to the most important resource of new drug project is “Venture Capital”. If there has no funding to execute a development project, even if there is a strong R&D capability, we still have no projects to develop and complete successfully.
Figure 10: Resources of R&D Funding- No Input from 2001 to 2020
Scenario 3: Corporate Should Choice R&D or Marketing?
One of development strategies is strengthening the R&D role in Taiwanese pharmaceutical industry, but the ratio of corporate R&D funding in Taiwan is under 10% which is less than other countries: 20~25%. And the dilemma about “corporate funding should invest in or reduce from the department of R&D or marketing” always exists. Therefore, this situation tries to assume two conditions (as Table 8): educe “Basic Ratio of Marketing Investment” from 20% to 10%, and (1) the other variables are not changed; (2) this 10% funding is increased in “The Ratio of RD Funding”.
Table 8: The Comparison of Three Lines in Scenario 3
Variables Line 1 Line 2 Line 3
Basic Ratio of Marketing Investment 20% → 10% 20% → 10% --
The Ratio of RD Funding -- +10% --
New Drug Appear on the Market
4 3 2 1 0 5 5 5 5 5 5 5 5 5 4 4 4 4 4 4 4 4 4 3 3 3 3 3 3 3 3 3 2 2 2 2 2 2 2 2 2 1 1 1 1 1 1 1 1 1 2001 2003 2005 2007 2009 2011 2013 2015 2017 2019 Time (Year) unit
New Drug Appear on the Market : No NSTPBP Funding→Venture Capital decrease doubl 1 1 1
New Drug Appear on the Market : No Corporate R&D Funding 2 2 2 2 2
New Drug Appear on the Market : No NSTPBP Funding 3 3 3 3 3
New Drug Appear on the Market : No Venture Capital 4 4 4 4 4 4
New Drug Appear on the Market : Current 5 5 5 5 5 5 5
Sales Value 400 B 300 B 200 B 100 B 0 5 5 5 5 5 5 5 5 4 4 4 4 4 4 4 4 3 3 3 3 3 3 3 3 2 2 2 2 2 2 2 2 2 1 1 1 1 1 1 1 1 1 2001 2003 2005 2007 2009 2011 2013 2015 2017 2019 Time (Year) $/ Year
Sales Value : No NSTPBP Funding→Venture Capital decrease doubl 1 1 1 1 1
Sales Value : No Corporate R&D Funding 2 2 2 2 2 2
Sales Value : No NSTPBP Funding 3 3 3 3 3 3 3
Sales Value : No Venture Capital 4 4 4 4 4 4 4
We can find that when only reduce 10% marketing funding (Figure 11 line 1), there are only fall a little and just have little effect on the overall. However, if use this 10% funding to invest in R&D, the contribution (line 2) will exceed the original investment in marketing (line 3) and line 1. In addition to, although “reducing 10% marketing funding and investing this funding in RD” makes the marketing funding decrease, but the R&D contribution will lead to the growth of marketing funding.
Figure 11: Policy Analysis about Marketing and R&D Funding
Scenario 4: Improve R&D Performance
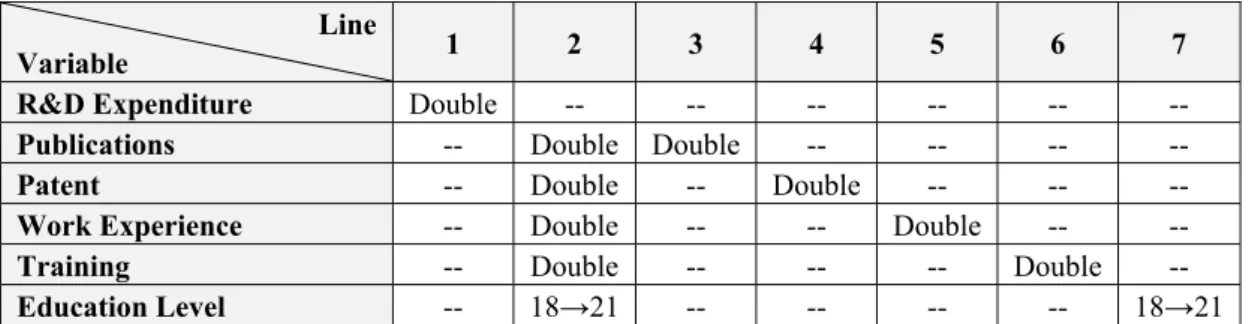
In this research, the author used six variables to measure “R&D Capability”. As the literature review, one of objectives about developing this industry is to increase R&D contribution. Therefore, we will find the most important variable affected the R&D area from these six variables in the learning and growth dimension. We assume each of these factors is increased to double value to observe their influence. There are seven conditions in this simulation (Table 9).
Table 9: The Adjustment Data of Six Variables Line
Variable 1 2 3 4 5 6 7
R&D Expenditure Double -- -- -- -- -- --
Publications -- Double Double -- -- -- --
Patent -- Double -- Double -- -- --
Work Experience -- Double -- -- Double -- --
Training -- Double -- -- -- Double --
Education Level -- 18→21 -- -- -- -- 18→21
First line is assumed to that the “Average R&D Expenditure per R&D Staff” increases double from 2009 to 2020. Because the second line is related to other lines that it is described finally. The third to sixth lines are also assumed to increase double from 2009 to 2020. Owing to the more and more masters in Taiwan, the “Average Level of Education” (line 7) is assumed to increase to 21 from 2009 to 2020.
Because each company has a certain distribution of funds, sometimes R&D funding is difficult to increase. On the other hand, most people think that the more funding is invested, there may have better performance. For these reasons, line 2 is assumed to increase five factors without “Average R&D Expenditure per R&D Staff” to compare with line 1. The simulation results are showed as Figure 12 to Figure 14.
From Figure 12, we can find that line 1 is the most important factor to affect R&D Capability and line 2 is second important. However, line 2 is the most important factor in Figure 13 and line 1 down to second. On the other hand, line 1 even only has little effect in “Sales Value” (see Figure 14). Between these charts, only “the amounts of patents and publications are no influence in this simulation” is the same.
Sales Value 400 B 300 B 200 B 100 B 0 3 3 3 3 3 3 3 3 3 3 3 3 3 3 2 2 2 2 2 2 2 2 2 2 2 2 2 2 1 1 1 1 1 1 1 1 1 1 1 1 1 1 2001 2003 2005 2007 2009 2011 2013 2015 2017 2019 Time (Year) $/ Y ear
Sales Value : Marketing Funding decrease 10% 1 1 1 1 1 1 1 1 1 1
Sales Value : Marketing decrease 10% and RD increase 10% 2 2 2 2 2 2 2 2 2
Sales Value : Current 3 3 3 3 3 3 3 3 3 3 3 3 3 3
Marketing Funding 60 B 45 B 30 B 15 B 0 3 3 3 3 3 3 3 3 3 3 3 3 3 3 2 2 2 2 2 2 2 2 2 2 2 2 2 2 1 1 1 1 1 1 1 1 1 1 1 1 1 1 1 2001 2003 2005 2007 2009 2011 2013 2015 2017 2019 Time (Year) $/ Y ear
Marketing Funding : Marketing Funding decrease 10% 1 1 1 1 1 1 1 1 1
Marketing Funding : Marketing decrease 10% and RD increase 10% 2 2 2 2 2 2 2 2
“* *”→ It indicates that the ranking of the variable has changed significantly over time.
Year
Line 2001 2011 Rank 2020 Rank
1 432.01 7,881 4 30,983 *1* 2 432.01 8,743 1 24,900 2 3 432.01 7,782 6 21,685 6 4 432.01 7,782 6 21,685 6 5 432.01 8,312 2 23,276 3 6 432.01 8,212 3 23,163 4 7 432.01 7,784 5 21,816 5 8 432.01 7,782 6 21,685 6
Figure 12: Policy Analysis about Learning and Growth (1)
“* *”→ It indicates that the ranking of the variable has changed significantly over time.
Year
Line 2001 2011 Rank 2020 Rank
1 0.0331 0.7040 4 3.815 *2* 2 0.0331 0.7119 1 3.840 1 3 0.0331 0.7040 4 3.702 6 4 0.0331 0.7040 4 3.702 6 5 0.0331 0.7082 2 3.778 3 6 0.0331 0.7074 3 3.766 4 7 0.0331 0.7040 4 3.704 5 8 0.0331 0.7040 4 3.702 6
Figure 13: Policy Analysis about Learning and Growth (2)
“* *”→ It indicates that the ranking of the variable has changed significantly over time.
Year
Line 2001 2011 Rank 2020 Rank
1 50.9 B 76.98 B 4 208.06 B *4* 2 50.9 B 77.09 B 1 211.55 B 1 3 50.9 B 76.98 B 4 206.17 B 6 4 50.9 B 76.98 B 4 206.17 B 6 5 50.9 B 77.03 B 3 208.55 B 3 6 50.9 B 77.04 B 2 209.21 B 2 7 50.9 B 76.98 B 4 206.20 B *5* 8 50.9 B 76.98 B 4 206.17 B 6
Figure 14: Policy Analysis about Learning and Growth (3)
Table 10 is integrated from Figure 12 to Figure 14. We can know R&D expenditure is the best effective for increasing “R&D Capability (RDC)” and “New Drugs Appear in the Market (NDAM)” in six factors. Training is the most importance for improving “SV”. And work experience is an important and comprehensive factor to enhance “RDC”, “NDAM” and “SV” in this industry. On the other hand, if R&D funding is limited but still want to enhance to same level, we can also upgrade the other five factors at the same time to achieve the goal.
Table 10: The Ranks of Importance between Six Variables Result
Variable R&D Capability
New Drug Appear
on the Market Sales Value
R&D Expenditure 1 2 4 RD Capability 40,000 30,000 20,000 10,000 0 8 8 8 8 8 7 7 7 7 7 6 6 6 6 6 5 5 5 5 5 4 4 4 4 4 3 3 3 3 3 2 2 2 2 2 2 1 1 1 1 1 1 2001 2003 2005 2007 2009 2011 2013 2015 2017 2019 Time (Year) Dmnl
RD Capability : Increase RD expenditure 1 1 1 1
RD Capability : Five variables without RD expenditure 2 2 2 2
RD Capability : Increase publication 3 3 3 3 3
RD Capability : Increase patent 4 4 4 4
RD Capability : Increase woek exp 5 5 5 5
RD Capability : Increase Total RD Corporate Training 6 6 6
RD Capability : Increase edu 7 7 7 7 7
RD Capability : Current 8 8 8 8 8
New Drug Appear on the Market
4 3 2 1 0 8 8 8 8 8 7 7 7 7 7 6 6 6 6 6 5 5 5 5 5 5 4 4 4 4 4 4 3 3 3 3 3 3 2 2 2 2 2 2 1 1 1 1 1 1 2001 2003 2005 2007 2009 2011 2013 2015 2017 2019 Time (Year) unit
New Drug Appear on the Market : Increase RD expenditure1 1 1 1
New Drug Appear on the Market : Five variables without RD expenditure 2 2 2
New Drug Appear on the Market : Increase publication 3 3 3 3
New Drug Appear on the Market : Increase patent 4 4 4
New Drug Appear on the Market : Increase woek exp 5 5 5
New Drug Appear on the Market : Increase Total RD Corporate Training 6 6 6
New Drug Appear on the Market : Increase edu 7 7 7 7
New Drug Appear on the Market : Current 8 8 8 8
Sales Value 400 B 300 B 200 B 100 B 0 8 8 8 8 8 7 7 7 7 7 6 6 6 6 6 5 5 5 5 5 4 4 4 4 4 3 3 3 3 3 2 2 2 2 2 2 1 1 1 1 1 1 2001 2003 2005 2007 2009 2011 2013 2015 2017 2019 Time (Year) $/ Y ear
Sales Value : Increase RD expenditure 1 1 1 1
Sales Value : Five variables without RD expenditure 2 2 2 2
Sales Value : Increase publication 3 3 3 3 3
Sales Value : Increase patent 4 4 4 4
Sales Value : Increase woek exp 5 5 5 5
Sales Value : Increase Total RD Corporate Training 6 6 6
Sales Value : Increase edu 7 7 7 7 7
Publications 6 6 6
Patent 6 6 6
Work Experience 3 3 3
Training 4 4 2
Education Level 5 5 5
Total Effect (except R&D Funding) 2 1 1
Comment: “1” is the most importance; “6” is the most unimportance.
CONCLUSION AND RECOMMENDATION
According to the computer simulation and analysis, we provide the recommendations to amend the policy direction for enterprises, government and overall Taiwanese pharmaceutical industry in the following section.
Conclusion and Recommendation
(i) Government: (a) Drug Prices:
“The Decline Rate of Drug Price” has a great impact and is bound to have a chain effect on this industry, such as (1) Some hospitals and pharmacies may be due to the spread of drugs to replace the cheaper and poor quality drugs and then format a new wave of “dressing tide”; (2) Compress the profit margin of certain drugs, and forced these drugs out of the market; (3) Affect the performance to be difficult to achieve the national development object for this industry, such as “Increase the annual output value to over US$30.86bn”.
Although cutting drug price can be gently lowered the short-term deficit problem and reduce the pressure and burden of drugs price for general public. However, government policy is closely interlinked with industrial and national development. This policy will decrease the contribution of this industry and may even reduce the level of national income and affect the investment of corporate and venture capital. When it affects the level of national income, we can imagine that the burden of drug price for general public will increase once again, and the deficit problem also will deepen. Finally, it will form a vicious circle to affect this industry.
(b) Attract R&D Investment:
Due to the decreasing profit of drugs and the competition of foreign pharmaceutical companies in recent years, the pharmaceutical businesses have no willingness to invest funding in R&D area. From the simulation, we can know that the R&D investment of corporate and venture capital is very important for the new drug development and the performance of this industry; thus, the government should avoid any factors to affect the R&D investment of corporate and venture capital and should formulate relevant preferential measures to encourage the businesses and venture capital to invest in this industry.
(ii) Enterprise
From scenario 2, it indicated that reducing 10% marketing funding and then invest it in R&D will bring better performance in new drug development and sales value. On the other hand, corporate R&D funding is an important factor in the development of this industry in scenario 3. Therefore, if the domestic pharmaceutical companies can focus on the R&D area, it can not only assist in the national industrial development strategies and objectives, but also improve the performance of this industry and increase the marketing funding.
(iii) Overall Taiwanese pharmaceutical industry
1. Financial: Increase the R&D contribution and annual output value.
The simulation result indicated that reduction in corporate R&D funding for this industry will have a significant impact on the performance. However, compared with other countries, the ratio of corporate R&D funding is lower in Taiwanese pharmaceutical industry. In addition to this, although government has built a
biotechnology science park, the entry ratio of pharmaceutical firms is not high. Thus, it is difficult to enhance the clustering effect (critical mass) in R&D area. How to guide and stimulate businesses to invest in R&D is the major project. Contract Research Organizations (CROs) catch much attention in recent years. If government can assist local CROs industry, it cannot only improve the efficiency of R&D and accumulated R&D energy, but also provide a good environment of drug development to attract pharm companies.
2. Learning and Growth: Expand the training and talent recruiting.
Because “R&D funding” is limited, thus, except this factor, the simulation result indicated that work experience is an important factor to improve “R&D Capability” and “New Drug Appear on the Market”; the amounts of training is an key factor to improve “Sales Value”. In recent years, Taiwanese talents are cheaper but better than other Asian countries, so many foreign firms use the higher salaries to recruit talents from Taiwan. This situation causes the brain drain of many talents who have many work experience. Facing this problem, how can we do to increase the work experience and retain highly skilled talents is the very important thing.
3. Internal Processes: Strengthen the role of R&D in the value chain.
The results of this research indicated that the R&D funding from enterprises and venture capital are the important resources for the new drug development. In order to strengthen the role of R&D and increase R&D results, we must stabilize the investment of enterprises and venture capital. Therefore, how do the pharmaceutical companies and venture capital investment companies have confidence in this industry, and are willing to continue and even increase investment is worth thinking for Taiwan government. For example, maybe “develop CROs industry to retain and even enhance the R&D capabilities” is a way can be tried.
4. Customer: Establish an alliance about drug export to expand markets.
98 percent of Taiwan’s enterprises are small-and-medium size businesses. In addition to this, the range about the Decline Rate of Drug Price is different from the domestic and foreign companies. Thus, the domestic companies are difficult to compete with foreign large pharmaceutical companies. As a Taiwanese glass industry, by establishing an alliance with drug export can help domestic pharmaceutical businesses to grow and cooperate to expand domestic and foreign markets.
Limitations
BSC is focused on the enterprise level and not all the dimensions of BSC are suitable and closely linked for industry level. On the other hand, the model developed in this study is not a perfect model from the industry aspect. For example, we didn’t explore the foreign drug markets, the effect of severe and pandemic diseases and so on. All of the reasons are as follows: (1) the purpose of this study is focused on the developed performance of overall Taiwanese pharmaceutical industry, thus the scope is too large to have make a choice; (2) the relationship between two variables is not obviously related, it is necessary to find out other related variables to link with; (3) the secondary data is difficult to collected.
Future Research
Based on the limitations of this study, future researchers can amend the model of this study, the design and application in detailed, and even cooperate with more experts in medical profession, legal profession and marketing profession to build a more robust model in this industry. On the other hand, many researches which combine SD with BSC are rarely concentrated on business level; few of them are focused on industry level. This thesis is to combine SD with BSC in pharmaceutical industry first. Therefore, future researchers can try to use in other industries, such as CROs industry.
Sales Value Equipment investment Marketing Founding Total R&D Funding RD Staff Costs + + + Corparate RD Funding + NSTPBP Funding + + Total R&D Staff + Educational level of employee Work Experience The amounts of patents The amounts of
Publications The amounts
of training Average RD Expenditure per RD Staff RD Capability + + + ++ ++ Number of New Project Average Delay Time Probability of Success Number of Project Successful
New Drug Appear on the Market Increased Ratio about
Product Quality Increased Ratio about Marketing -+ + + + -+ + + + Customer Willingness to Pay Domestic Market Demand Aging index Total Number of Defective Reaction Bulletin + + + -+ + + -Total Amounts of Drug Relief Application -Average Annual Salary per Researcher -+ Venture Capital + Export Import -+ + +
The Decline Rate of Drug Price
-Population
+
+
Increased R&D Successful Percentage
Average R&D Time
Drug
Projects Number of Project Successful Average Expenditure of
Developing New Project
The Number of New Drug Project
R&D Successful Percentage
Increased Ratio about the Quality and Capability of
Production Basic Amount of
Training Total Amounts of Training
Opportunities from Government Basic Amount of Base Station New Drug Appear on the Market Increased Ratio about Equipment investment Increased Ratio about
Training Opportunities <Time> Reduced R&D Time Increased Ratio about Marketing Basic Amount of Marketing Number of Production Training The ratio of Production Training <Time> Total RD Funding RD Funding Increase Sales Value NSTPBP Funding The Ratio of RD Funding The Ratio of RD Staff Costs Total R&D Staff <Time> The Amounts of RD Training Opportunities from Government RD Capability RD Capability Generation Average RD Level per RD Staff Average Training per RD Staff Average Publications per RD Staff Corporate RD Funding <Time> Total Amounts of Defective Reaction Bulletin <Time> Increased Ratio about Five Purchase Factors Positive factors
about Purchase Negative factorsabout Purchase Annual Per-capita Spending on Medication Population Estimated Domestic Market Demand <Time> Export <Time> RD Capability Loss Average Level of Education Average Work Experience
Basic Annual Per-capita Spending on Medication
<Time>
Increased Ratio about New Products
Basic Amount of Products The Ratio of Defective Reaction Exit Rate The ratio of RD Training Opportunities per year Average RD Expenditure per RD Staff <Time> Average Annual Salary per Researcher
Average Patent per R&D staff
<Time>
Increase in the Fixed Assets The Ratio of RD
capital expenditure
The Ratio of Fixed Assets Investment Basic Amount of Defective Reaction Bulletin Effect of Education Effect of Expenditure Effect of Experience Effect of Patent Effect of Publication Effect of Training Education Weight Experience Weight Patent Weight Publication Weight Training Weight Expenditure Weight Education Utility Experience Utility Patent Utility Publication Utility Training Utility Expenditure Utility Marketing Funding The Ratio of Customer Willingness to Pay Aging Index <Time> Increased Ratio about Aging Basic Aging Index Equipment Investment Increase Equipment Investment Depreciation Depreciation Rate <Time> Total Amounts of Drug Relief Application Basic Amount of Drug Relief Application The Ratio of Drug Relief RD capital expenditure Corporate Training Government Training Import The Ratio of Import <Time> Average Venture Capital Basic Ratio of Marketing Investment The Ratio of Marketing Effect of Import Basic Ratio of Import
The Decline Rate of Drug Price Actual Domestic Market Demand <Time> The Chang of Import Ratio Total Amounts of Training Opportunities from Corporate
Total Amounts of Training Opportunities from Corporate without R&D
Purchase
Weight WeightAging
Utility of Purchase Utility of Aging New Drug Development Funding RD Staff Costs
Reference
Akkermans, H & Oorschot, K (2002). Developing a balanced scorecard with system dynamics. Journal of the Operational
Research Society.
Bader, G (2007). Developing a measurement system for the pharmaceutical compliance process using the Balanced Scorecard. Unpublished Master dissertation, California State University, Dominguez Hills.
Berardi, LP (2003). Pharmaceutical industry: market dynamics. Stern Pharmaceutical and Healthcare Association: New York University.
Business Monitor International (2010). Taiwan Pharmaceuticals & Healthcare Report - Q4 2010. pp. 1-100. London: BMI. Chang, W, Hawkins, E & Zussa, F (2005). Personalized Medicine and the Future of the Pharmaceutical Industry.
Technology Strategy. 1-22.
Chinese Encyclopedia Online (1983). Non-Price Competition Retrieved 5/12, 2011, from
http://ap6.pccu.edu.tw/Encyclopedia/data.asp?id=1643&forepage=1
Chiu, SF (2008). The Current Statu and Future Prospect of Western Pharmaceutical and Biotechnology Industry. Taiwan Institute of Economic Research Database [20August 2008].
David (2008). National Innovation System, Intelligence Resources Planning and Balanced Scorecard. Retrieved 10/23, 2010, from http://cdnet.stpi.org.tw/techroom/analysis/2008/pat_08_A012.htm
Forrester, JW (1991). System dynamics and the lessons of 35 years. In K. B. D. Greene (Ed.), The systemic basis of policy
making in the 1990s. Boston: MIT.
Forrester, JW & Senge, PM (1979). Tests for building confidence in system dynamics models. Cambridge: System Dynamics Group, Sloan School of Management, Massachusetts Institute of Technology.
Han, Z (2002). System Dynamics - The Key to Explore the Dynamic Complexity. Taipei: Hwa Tai Publishing.
Hsia, YC (2008). The Measurement and Comparison of the Intellectual Capital in Pharmaceutical Industry and Information Service Industry. Unpublished Master dissertation, National Chung Cheng University, Department of Accounting and Informational Technology.
Hsieh, CH (1980). System Dynamics- Theory, Methods and Applications. Taipei: Chung Hsing Management Consultant. Industrial-Development-Bureau. (2010). 2010 White Paper on the biotechnology industry in Taiwan. Industrial Development Bureau, MOEA.
Kaplan, RS & Norton, DP (1996a). Using the balanced scorecard as a strategic management system. Harvard business
review, 74(1), 75- 85.
Kaplan, RS & Norton, DP (1996b). Linking the balanced scorecard to strategy. California management review, 39(1), 53-79.
Kaplan, RS & Norton, DP (2000). Having trouble with your strategy? Then map it. Harvard business review, 78(5), 167-176.
Kasch, S & Dowling, M (2008). Commercialization strategies of young biotechnology firms: An empirical analysis of the US industry. Research Policy, 37(10), 1765-1777.
Kuo, WY (2004). The Evaluation Model for the Efficiency of the Achievement of Organization Objectives- Study on Software Industry. Unpublished Master dissertation, Tatung University, Department of Information Management.
Lee, TL (2006), An Alternative Approach to Technology Policy Assessment: Dynamic Simulation Analysis of Taiwan’s IC Industry, International Journal of Technology, Policy and Management, 6(2), 121-153.
Lii, SY (2006). An Analysis of Human Capital and Its International Competitiveness in Taiwan. Journal of Humanities and
Lu, SY (2003). Relationship of Marketing and R&D Investments to Operating Performance and Corporate Value within Biopharmaceutical Industry in Taiwan. Unpublished Master dissertation, National Taiwan University, Department of Accounting.
Luna-Reyes, LF, & Andersen, DL (2003). Collecting and analyzing qualitative data for system dynamics: methods and models. System Dynamics Review, 19(4), 271-296.
MBA Library. (2010, 2010/5/17). Market Force Retrieved 5/12, 2011, from
http://wiki.mbalib.com/zh-tw/%E5%B8%82%E5%9C%BA%E5%8A%9B%E9%87%8F
Nørreklit, H (2000). The balance on the balanced scorecard a critical analysis of some of its assumptions. Management
Accounting Research, 11(1), 65-88.
Sterman, JD (2000). Business dynamics: Systems thinking and modeling for a complex world. Boston: Irwin/McGraw-Hill. Su, MK (1988). The Principle and Application of System Dynamics. Shanghai: Shanghai Jiao Tong University.
Tu, KC (2004). A Study on Some Dynamically Aligned Principles of the Balanced Scorecard Strategy in System Dynamics. Unpublished Doctoral dissertation, National Sun Yat-sen University, Department of Business Management.
Wang, HH (2004). Evolution, current status, and trend of pharmaceutical industry. Unpublished Master dissertation, National Taiwan University, Department of Business Administration.
Wen, HY (2006). The influence of strategies on the relationship of the degree of top managers support training and organizational performance. Unpublished Master dissertation, National Taiwan University of Science and Technology, Department of Business Management.
Wu, LH (2005). The research of the strategy goal and the dynamic decision-making mechanism- W Electronics Corporation for example. Unpublished Master dissertation, National Sun Yat-sen University, Department of Information Management.