739
Velocity Structure in Marine Sediments with Gas Hydrate Reflectors
in Offshore SW Taiwan, from OBS Data Tomography
Win-Bin Cheng1,
*
, Chao-Shing Lee 2, Char-Shine Liu 3, Philippe Schnürle 3, Shiao-Shan Lin 2, and Hong-Ruai Tsai 2(Manuscript received 16 January 2006, in final form 6 November 2006)
ABSTRACT
1
Department of Environment and Property Management, Jin-Wen Institute of Technology, Taipei, Taiwan, ROC
2
Institute of Applied Earth Science, National Taiwan Ocean University, Keelung, Taiwan, ROC
3
Institute of Oceanography, National Taiwan University, Taipei, Taiwan, ROC
*
Corresponding author address: Prof. Win-Bin Cheng, Department of Environment and Property Management, Jin-Wen Institute of Technology, Taipei, Taiwan, ROC; E-mail: [email protected]In the fall of 2004, four profiles of a total length of about 80 km and 24 recovered Ocean Bottom Seismometers (OBSs) were acquired along off-shore southwestern Taiwan. These profiles were oriented in E-W and N-S directions to map the velocity structure of sediments by modeling the verti-cal component of OBS data. The thickness of sedimentary layers ranges from a few hundred meters to about 2 km, with the largest thickness being found beneath ridges. The most striking feature in the velocity models along E-W profiles is the relatively high velocity wedges, extending from the sea-floor to about 2 km in depth; these could be interpreted as a series of west-ward upthrust faults. The feature of relatively high P-wave velocity could be considered a result of local shallowing of the base of the gas hydrate stability zone, caused by ascending flows of deep fluids passing through the fault zone. In the N-S profiles, a dome-like high velocity structure was ob-served and could be associated with the phenomenon of hydrate/gas phase boundary fluctuation. After erosion, the sub-seafloor temperature gradi-ent redistributes and results in the hydrate/gas phase boundary moving downward. The results obtained in this study show that tectonic control is an important factor in determining bottom-simulating reflector (BSR) dis-tributions offshore of southwestern Taiwan.
(Key words: Gas hydrates, OBS seismic data, Seismic tomography, Methane migration)
1. INTRODUCTION
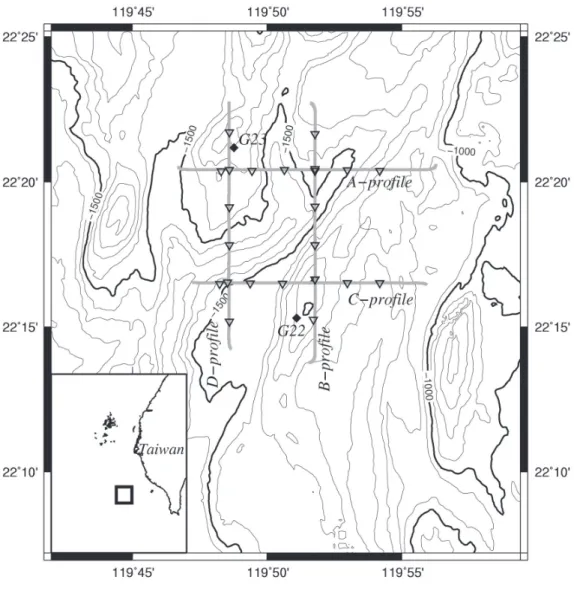
The multidisciplinary research project “Geological Exploration of Gas Hydrate Prospects Offshore of Southwestern Taiwan - Geophysical Investigation” was aimed at studying gas hydrate in the southwestern offshore region of Taiwan. Gas hydrate is a naturally occurring ice-like crystal that forms a hydrogen-bonded cage of water molecules composed of methane molecules (Brooks et al. 1986; Sloan 1990; Kastner et al. 1998). Accumulations of natural gas hydrate are commonly inferred on Multi-Channel Seismic (MCS) reflection profiles from the presence of bottom-simulating reflectors (BSRs) at the base of gas hydrate stability zones (Shipley et al. 1979). BSRs are frequently observed in marine sediments at continental margins, and originate from the strong impedance contrast between sediments containing gas hydrate above and the trapped free-gas in sediments below the gas hydrate. Gas hydrate is formed under appropriate conditions of low-temperature and high-pressure (Kvenvolden and McDonald 1985). The survey area of this paper is in offshore southwestern Taiwan (Fig. 1). The goal was to understand regional structures, the deposition environment, characteristics of gas-hydrate bearing sediment, and to estimate the amount of gas hydrate. For this purpose, MCS and two-dimensional ocean bottom seismometer (OBS) refraction surveys were conducted in offshore southwestern Taiwan during a cruise with the R/V Research I in 2004 (Figs. 1, 2).
The study includes P-wave modeling along four OBS transects located at around 119.83°E and 22.33°N (Fig. 1). These profiles show the sedimentary layers at the active margin of northern South China Sea. The OBS data have been used in gas hydrate research by analyzing P-wave traveltimes (Korenaga et al. 1997; Tinivella and Accaino 2000; Bünz et al. 2005; Netzeband et al. 2005). In the last decade, different approaches were presented to determine the velocity of gas-hydrate bearing layers and the free-gas layers beneath them (e.g., Katzman et al. 1994; Korenaga et al. 1997; Pecher et al. 1998; Holbrook 2001). Some literature reports that pure gas hydrate has a P-wave velocity between 3.3 km s-1 (Sloan 1998) and 3.65 - 3.75 km s-1
(Helgerud et al. 1999). Hydrate bearing layers, however, have relatively lower velocities of about 1.8 to 2.5 km s-1 (Pecher et al. 1996; Korenaga et al. 1997; Mienert and Posewang 1999). Below the
BSR, a low velocity layer (1.2 - 1.5 km s-1) was commonly observed (e.g., Korenaga et al. 1997;
Tinivella and Accaino 2000; Bünz et al. 2005), which indicates the presence of free gas in the sedimentary sequence.
This paper is to obtain the P-wave velocity model along the four OBS transects, and to investigate a possible mechanism of gas migration in the study area. We used the vertical component of OBS data to obtain the seismic velocities of the sediments by travel-time inversion. Horizontal components of OBS data are not analyzed in this study. We can use the resultant seismic velocities to elucidate the accumulation process of gas hydrates in the survey area. This study improves our knowledge of the velocity structure of gas hydrate in shallow marine sediments, and provides a basis for an improved assessment of the concentration of gas hy-drate in the offshore area of southwestern Taiwan.
2. LOCATION AND DATA
are shown in Fig. 1. The oblique converging margin tectonics from north to south between the Philippine Sea plate and the Chinese continental margin have shallowed the Manila Trench and flexured the Chinese continental margin in this area. The sedimentary facies shows that sediments of the wedge-top basin have been actively deformed into mud diapiric intrusions
Fig. 1. Location of four OBS transect positions. Solid gray lines indicate the
parts of multi-channel seismic profiles studied in this paper. The inverted triangle indicates the location of OBSs. Solid diamonds represent geochemical coring sites.
and a series of thrusts and folds, resulting in the irregular topography of the seafloor with alternating ridges and canyons (Yu and Chow 2001). Chi et al. (1998) identified a gas hydrate-related BSR in the broad offshore area of southwestern Taiwan. Geochemical studies reported that the BSR is highly concentrated at the tops of ridges, where especially high methane con-centrations exist in the bottom water (Chuang et al. 2006). In particularly, total sulfate deple-tion was observed as shallow as one meter beneath the seafloor at the G22 and G23 coring sites (Fig. 1). Based on BSR arrival times, sub-bottom depth, and associated heat flow, Schnürle and Liu (2005) suggested that the local structure plays an important role in gas hydrate em-placements in the study area. Four types of BSR occurrence, ridge type, basin type, submarine canyon type, and continental slope type, are also classified by Lin et al. (2005) for the region off southwestern Taiwan.
The seismic data along four transects of the SW Taiwan experiment were acquired in 2004 aboard R/V Research I. Seismic refraction data were recorded by 6 French IFEMER’s
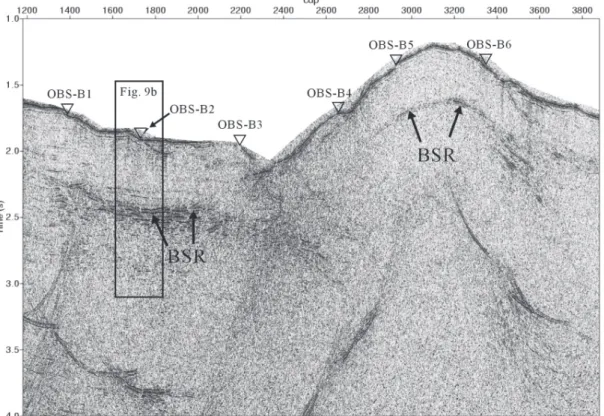
Fig. 2. Part of a multi-channel reflection profile along B-profile (see Fig. 1 for
location), with locations of the OBS, noted by inverted triangles. Arrows mark the BSR.
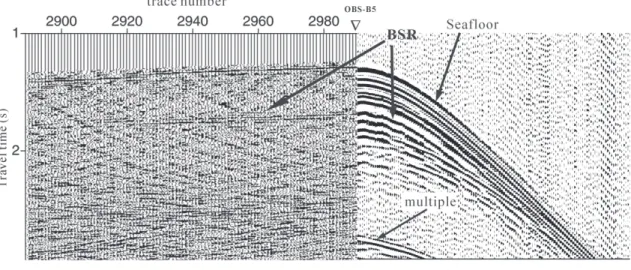
ocean bottom seismometers, which were deployed along each transect (Fig. 2). Figure 3 shows the OBS and MCS data acquired by the National Taiwan Ocean University and National Tai-wan University, respectively. The sampling interval of the OBS’ data was 4 ms, and a 4 - 33 Hz band-pass filtering was applied to the data. An air-gun was fired at a 30-s interval at about 4 knots yielding spaced seismic traces of 50 m. The main horizons such as direct water arrivals and reflections between seafloor and BSR seen in the MCS section were prominent and were correlated well to the OBS-recordings (Fig. 3). Only the first arrivals picked from offsets up to 3 km were used in the seismic inversion. The resultant high phase correlation among traces is essential for reliable phase picking, especially for later arrivals.
3. MODELING PROCEDURES
We have performed 2-D tomographic modeling using a packaged Tomo2D (Korenaga et al. 2000) to obtain an initial image of the velocity structure along the profiles. The forward solution of this software used a hybrid method based on the graph and ray-bending methods (Moser et al. 1992; Papazachos and Nolet 1997; Van Avendonk et al. 1998). The inversion is based on the regularized LSQR solution (Paige and Saunders 1982). Both the forward modeling and the travel-time inversions used an identical velocity model of a sheared mesh hanging beneath the seafloor and land surface (Toomey et al. 1994; Van Avendonk et al. 1998). Bilinear
interpola-Fig. 3. A near-offset section of OBS-B5 at the right combined with part of the
MCS section of B-profile on the left. The inverted triangle indicates the location of OBS-B5.
tion is used in each parallelgram-shaped grid cell in this software to make the velocity field continuous everywhere (Korenaga et al. 2000).
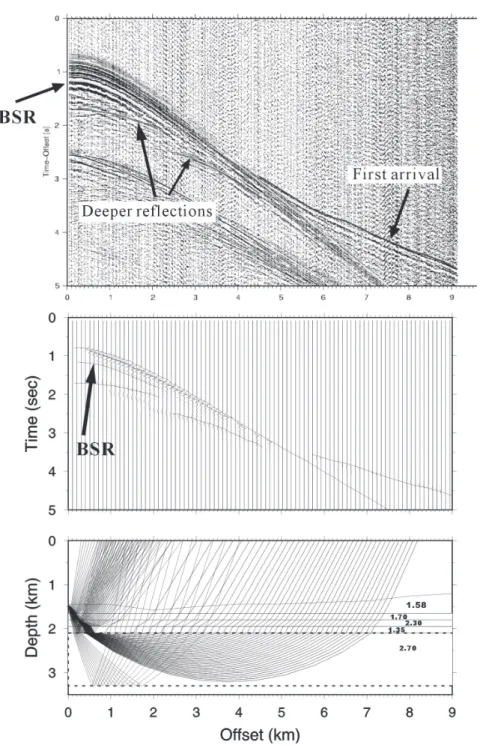
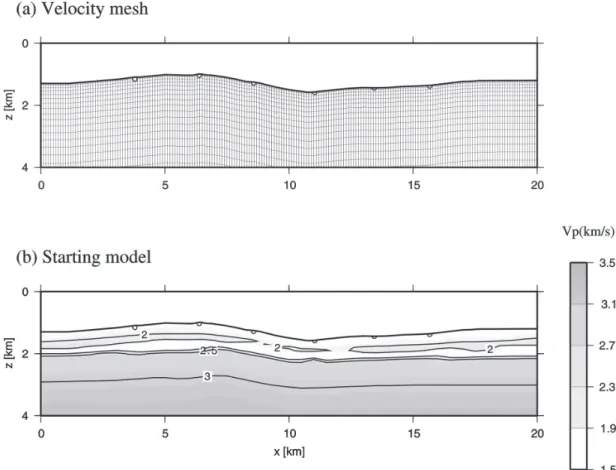
In order to derive a reliable initial velocity model for 2-D inversion, an initial 1-D velocity model was constructed first, and was modified from previous studies (e.g., Korenaga et al. 1997; Tinivella and Accaino 2000). The model consists of 6 layers with vertical velocity gra-dients inside: one for the seawater, three for the marine sediments above the BSR (Vp = 1.58, 1.7, 2.3 km s-1, respectively), one for the free gas layer (~1.35 km s-1) and the last one for the
layer below the free gas of 2.7 km s-1 (Fig. 4). We used the RAYAMP-PC program (developed
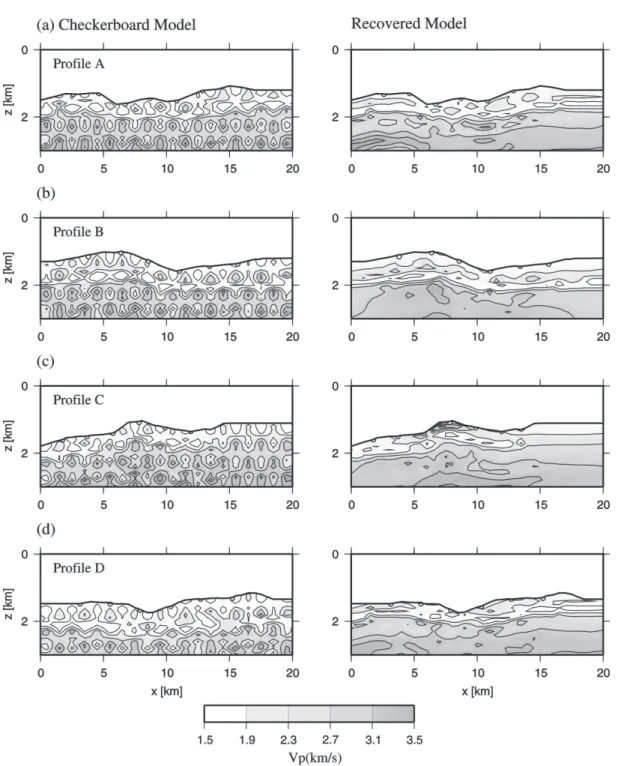
by McGill University in 1986) to generate primary refractions, reflections, and the corresponding seismograms. The adjustments of interfaces and velocity contrasts were carefully taken until we arrived at satisfactory matches between the observed and synthetic record sections. Figure 4 shows synthetic record sections well matched with the observed ones. This model was then modified and converted to a grid model for Tomo2D (Fig. 5). The model domain is 20 km wide and extends 5 km below the seafloor. The horizontal grid spacing is about 100 m on average, and the vertical grid spacing is about 50 m. The data for the inversion consisted of first arrivals from 4 profiles, with an assumed uncertainty of about 50 to 100 ms. Uncertainties for each pick are assigned based on the signal to noise ratio (S/N) within a time window before and after each pick. Improvements to the velocity model were evaluated at each modeling step using the root-mean-square and the normalized chi squared statistical tests of the travel-time residuals. To achieve an optimal fit to the data, the maximum number of rays should be traced to their observation points and the residuals should be minimized to as close to one as possible. We investigated the solution quality by using a checkerboard test procedure (e.g., Zhao et al. 1992). The synthetic velocity model was described by varying the velocity as a sinusoidal function in the x- and z-directions with alternating increase gradients that were ±20% over a background velocity between two adjacent nodes (Fig. 6). Synthetic travel-times are calcu-lated from the air-gun shots to receivers across the checkerboard velocity models. The syn-thetic travel-times were then used with a 1-D initial velocity model to recover the checker-board pattern.
4. RESULTS AND DISCUSSION
Figure 6 shows the results obtained from resolution tests for P-waves in four profiles. There are 20 × 6 grids in a checkerboard section, corresponding to 1 and 0.5 km in horizontal and vertical dimensions, respectively. The recovery of the checkerboard pattern indicates that most of the original velocity pattern has been successfully recovered at least to a depth of about 0.5 km beneath the seafloor. The results of velocity imaging above the BSR obtained in this study are reliable.
Because the BSR is a strongly reflective horizon, the deeper layers beneath the BSR are difficult to defect by using conventional seismic reflection data. Therefore, refracted phases of the OBS data are important to determine the velocity model of the layers deeper than the BSR. The procedure of inverting refracted travel-times allowed us to obtain information about the velocity field below the free gas zone. Because the MCS data provides imaging of structural
Fig. 4. Top: Vertical component of OBS data. The arrows indicate the modeled
refracted and reflected events. Middle: comparison of synthetic seismo-grams and observed (solid lines) travel times. Bottom: 1-D velocity model and ray diagram modeled on OBS data.
layers and velocities while the OBS data add relatively detailed vertical and lateral velocity structure, it is important to combine the two datasets, and if possible include information from boreholes.
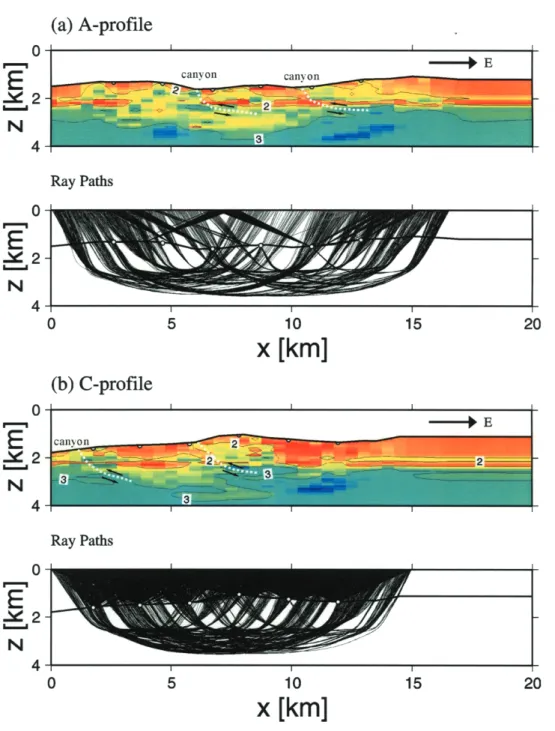
Velocity models for the four transects are shown in Fig. 7. The thickness of the sediments beneath the ridges ranged from a few hundred meters to about 2 km. The P-wave velocity ranges from ~1.6 km s-1 in the uppermost layers, increasing to ~3 km s-1 in the lower layers. The
most striking feature in the 2-D velocity model is the westward thrusting high velocity wedges along the E-W profiles A and C (Figs. 7a, b). Those upward P-wave velocity highs, possibly suggest a series of thrust faults in offshore southwestern Taiwan (Lin and Watts 2002). Some dome-like high velocity structures are modeled beneath the canyon along the N-S profiles B and C (Figs. 7c, d). The locations of these velocity structures correspond to lateral velocity
Fig. 5. (a) A velocity mesh is composed of variable size cells hanging from the
seafloor; (b) Initial velocity model constructed by modified 1-D model from Fig. 4 (bottom). Locations of the OBS are noted by open circles.
Fig. 6. Results of the checkerboard resolution test. Original checkerboard
veloc-ity pattern (left) and the recovered checkerboard velocveloc-ity patterns (right) were shown for the four profiles.
Fig. 7. Results of tomography inversion and ray diagrams for (a) A-profile; (b)
C-profile; (c) B-profile; and (d) D-profile. Solid circles indicate position of OBSs. White dashed lines in (a) and (b) indicate preferred thrust faults. White dashed lines in (c) and (d) indicate high P-wave velocity struc-tures associated with BSR uplift according to sediment erosion.
Fig. 7. (Continued)
variations at the same depth in profiles A and C (Figs. 7a, b). It is commonly believed that BSRs result from a decrease in the P-wave velocity from the high-velocity layer containing gas hydrate to the lower-velocity layer containing a small amount of free gas (e.g., Andreassen et al. 1997; Ecker et al. 1998; Dovorkin et al. 2000; Tinivella and Accaino 2000). Above the BSR,
the solidus phase that fills the clastic matrix creates a high P-wave velocity. Free gas is present in the pore space beneath the BSR and generates a drop in P-wave velocity (e.g., Singh et al. 1993; Pecher et al. 1996; Korenaga et al. 1997).
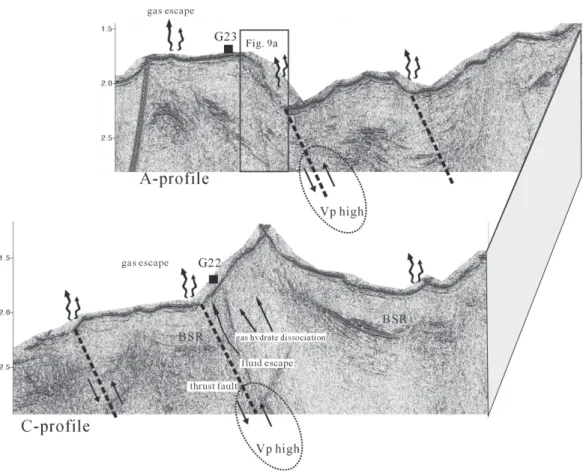
Fluid migration plays an important role in the formation and dissociation of gas hydrates in both active and passive margin settings (Inamori and Hato 2004). Gas hydrate-related anoma-lies observed in seismic data are usually related to fluid migration (e.g., Holbrook 2001). Fluid migration influences hydrate accumulation and may therefore control the spatial distribution of BSRs (Chand and Minshull 2003; Borowski 2004). Figure 8 reveals good correspondence between the MCS and OBS data as we map the thrust faults i.e., from Fig. 7 onto the E-W MCS sections. The thrust faults are identified by seismic wipe-out, i.e., reflector terminations in MCS data. They can be traced to the seafloor at the location of canyons. Bouriak et al. (2000) suggested that vertical zones of seismic wipe-outs are the result of fluid expulsion. Along with gas, fluid migration can bring heat and cause local dissociation of gas hydrate at the BSR level (Fig. 8). This means that faults also act as conduits for the flow of fluids and heat, which often disturb BSRs (Pecher et al. 1998; Trehu et al. 1999; Ruppel and Kinoshita 2000). This process can result in migrating BSRs or double BSRs (Mienert and Posewang 1999).
Relatively high Vp features observed in Figs. 7a and b can be considered a result of local shallowing of the base of the gas hydrate stability zone (GHSZ) caused by ascending flows of deep fluids passing through the fault zone. Surrounding those faults, the BSRs are often absent or anomalously weak, suggesting that free gas has escaped from beneath the BSR and mi-grated upward along faults. As mentioned above, geochemical studies reported that high methane concentrations were observed in the bottom water at sites G23 and G23 at the top of ridges (Fig. 8). This can be attributed to methane migration in a fault zone where methane, presum-ably derived from gas hydrates below, is leaking out onto the seafloor.
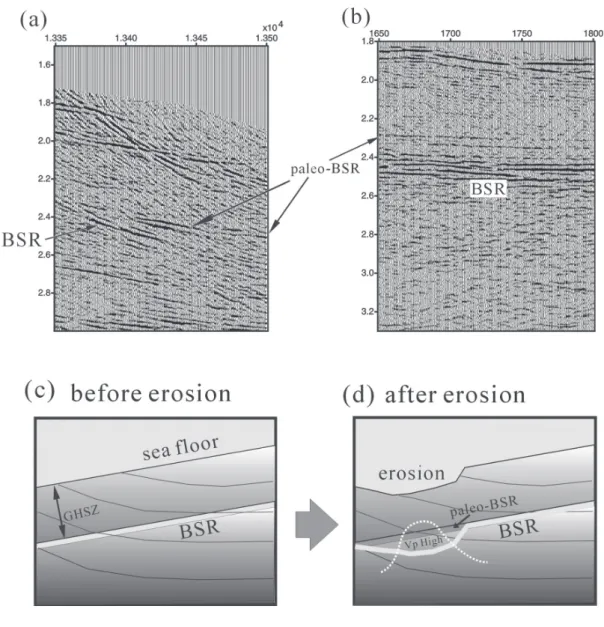
Figures 7c and d show that there is a dome-like high velocity structure beneath the NE-SW canyon along B- and D-profiles (see also Fig. 1). A clear reflection cross-cuts dipping strata (Fig. 9a) or lies well within the hydrate above the present BSR (Fig. 9b) beneath the canyon. Those reflections can be interpreted as the top of a zone of concentrated hydrate that formed after one or more episodes of seafloor erosion (Hornbach et al. 2003). After erosion, the sub-seafloor temperature gradient will re-distribute and result in the hydrate/gas phase boundary moving downward. The upper reflection thus represents a “paleo-BSR”, marking the position of the phase boundary prior to erosion (Taylor et al. 2000; Holbrook 2001; Foucher et al. 2002). As discussed earlier, sediments with high concentrations of hydrate can create rela-tively high velocity zones. Therefore, if sediment is eroded above a BSR, the temperature at the BSR will drop, causing the gas at the BSR to form methane hydrate, producing a relatively high velocity structure (Figs. 7c, d). Figures 9c and d suggest a possible erosion mechanism to form “paleo-BSR”.
Located on the active continental margin, Taiwan is a structurally complex area. Tecton-ics is an important variable in the recognition of the regional distribution of gas hydrates and free gas (e.g., Minshull and White 1989; Bangs et al. 1993; Baba and Yamada 2004). Tectonic stresses can cause over-pressing of pore fluids, creating variations in heat flow and uneven distributions in fluids and sedimentary properties (Lodolo et al. 2002). Tectonic thrusting as a result of convergence can cause thrust faults resulting in extensional fractures developing along ridges as shown in Fig. 8. Although the characteristics and development of the ridge and
Fig. 8. A schematic model of BSR development in the area and the link to fluid
escape features observed in the seafloor. Wavy arrow in the seafloor in-dicates locations of suspected fluid escape. Solid dashed lines indicate thrust faults inferred from seismic tomographic inversion. A dome-like elevation on the seafloor as observed on the seismic record along A- and C-profiles. G22 and G23 indicate two sites with high methane concen-trations in the bottom water.
canyon associated with uplift and erosion in southwestern offshore of Taiwan are not fully understood, active expulsion of fluids with methane gas is expected in this area due to perva-sive conduits and horizontal compression (e.g., Tamano et al. 1983; Hyndman and Spence 1992). As a result, the hydrates have been able to store up a great amount of underground methane. Many faults formed by tectonic events can sometimes become good methane migra-tion paths for generating and storing of gas hydrates. It is suggested that tectonic control mecha-nisms should be an important factor in considering BSR distribution in offshore southwestern Taiwan.
Fig. 9. Example of paleo-BSRs and diagrams showing how it might form. (a)
Part of the time-section along A-profile with clear paleo-BSR and BSRs (detailed location of this is A-profile in Fig. 8); (b) Part of the time-section along B-profile with clear paleo-BSR and BSRs (detailed loca-tion of this is B-profile in Fig. 2); (c) Before erosion: the gray reflector cross-cutting strata represents the BSR; and (d) After erosion: the region where the BSR previously existed and has cooled, resulting in the forma-tion of methane hydrate. The localized high concentraforma-tion of methane hydrate at the former BSR creates a high P-wave velocity hydrate zone (modified from Hornbach et al. 2003). GHSZ: gas hydrate stability zone.
5. CONCLUSIONS
Using multi-channel and seismic data obtained in 2004 for offshore southwestern Taiwan, we were able to resolve the sedimentary velocity structure along four transects through mod-eling of OBS data. The lateral variations in the velocity along E-W profiles are interpreted as a series of westward upthrust faults. Relatively high P-wave velocity features observed in E-W profiles are considered to result from local shallowing of the base of the gas hydrate stabil-ity zone. The dome-like high velocstabil-ity structure observed in N-S profiles can be interpreted as a result of the hydrate/gas phase boundary moving downward after seafloor erosion.
Acknowledgements We thank C. H. Tsai and H. R. Yang for assistance in the processing of OBS data. We would like to thank T. K. Wang, A. T. Lin, and T. F. Yang for useful discus-sions about travel-times inversion and structural interpretation. We are also grateful to the scientists and the technologists participating in the cruise during MCS and OBS date acquisition. In particular, we thank J. Y. Lin, J. C. Sibuet, Y. Auffret, P. Pelleau, J. Crozon, C. H. Tsai, and C. T. Wang. The authors would like to thank T. K. Wang and one anonymous reviewer for insightful reviews and comments. This research was supported by the Central Geological Survey, Ministry of Economic Affairs Under grant 5226902000-05-94-01 and partly by the national Science Council, Taiwan under Grant NSC 93-2119-M-228-001 and 94-2119-M-228-001.
REFERENCES
Andreassen, K., P. E. Hart, and M. MacKay, 1997: Amplitude versus offset modeling of the bottom simulating reflection associated with submarine gas hydrate. Mar. Geol., 137, 25-40.
Baba, K., and Y. Yamada, 2004: BSRs and associated reflections as an indicator of gas hy-drate and free gas accumulation: an example of accretionary prism and forearc basin system along the Nankai Trough, off central Japan. Resour. Geol., 54, 11-24.
Bangs, N. L. B., D. S. Sawyer, X. Golovchenko, 1993: Free gas at the base of the gas hydrate zone in the vicinity of the Chile triple junction. Geology, 21, 905-908.
Borowski, W. S., 2004: A review of methane and gas hydrates in the dynamic, stratified system of the Black Ridge region, offshore southeastern North America. Chem. Geol., 205, 311-346.
Bouriak, S., M. Vanneste, and A. Sauutkine, 2000: Inferred gas hydrates and clay diapers near the Storegga slide on the southern edge of the Vøring Plateau, offshore Norway.
Mar. Geol., 163, 125-148.
Brooks, J., H. Cox, W. Bryant, M. II Kennicutt, R. Mann, and T. McDonald, 1986: Associa-tion of gas hydrates and oil seepage in the Gulf of Mecico. Org. Geochem., 10, 221-234. Bünz, S., J. Mienert, M. Vanneste, and K. Andreassen, 2005: Gas hydrates at the Storegga
Slide: constraints from an analysis of multicomponent, wide-angle seismic data.
Geophysics, 70, 19-34.
Chand, S., and T. A. Minshull, 2003: Seismic constraints on the effects of gas hydrate on sediment physical properties and fluid flow: a review. Geofluids, 3, 275-289.
Chi, W. C., D. L. Reed, C. S. Liu, and N. Lundberg, 1998: Distribution of the bottom-simulat-ing reflector in the offshore Taiwan collision zone. Terr. Atmos. Ocean. Sci., 9, 779-794. Chuang, P. C., T. F. Yang, S. Lin, H. F. Lee, T. F. Lan, W. L. Hong, C. S. Liu, J. C. Chen, and
Y. Wang, 2006: Extremely high methane concentration in bottom water and cored sediments from offshore southwestern Taiwan. Terr. Atmos. Ocean. Sci., 17, 903-920. Dovorkin, J., M. B. Helgerud, W. F. Waite, S. H. Kirby, and A. Nur, 2000: Introduction to physi-cal properties and elasticity models. In: Max, M. D. (Ed.), Natural Gas Hydrate in Oceanic and Permafrost Environments, Kluwer Academic Publishers, Dordrecht, 245-260. Ecker, C., J. Dvorkin, and A. Nur, 1998: Sediments with gas hydrates: internal structure from
seismic AVO. Geophysics, 63, 1659-1669.
Foucher, J., H. Nouze, and P. Henry, 2002: Observation and tentative interpretation of a double BSR on the Nankai slope. Mar. Geol., 187, 161-175.
Helgerud, M. B., J. Dvorkin, A. Nur, A. Sakai, and T. Collett, 1999: Elastic wave velocity in marine sediments with gas hydrates: effective medium modeling. Geophys. Res. Lett., 26, 2021-2024.
Holbrook, W. S., 2001: Seismic studies of the Blake Ridge: implications for hydrate distribution, methane expulsion, and free gas dynamics. Am. Geophys. Un. Monogr., 124, 235-256. Hornbach, M. J., W. S. Holbrook, A. R. Gorman, K. L. Hackwith, D. Lizarralde, and I. Pecher, 2003: Direct seismic detection of methane hydrate on the Blake Ridge. Geophysics, 68, 92-100.
Hyndman, R. D., and G. D. Spence, 1992: A seismic study of methane hydrate marine bottom simulating reflectors. J. Geophys. Res., 97, 6683-6698.
Inamori, T., and M. Hato, 2004: Detection of methane hydrate-bearing zone from seismic data. Resour. Geol., 54, 99-104.
Kastner, M., K. A. Kvenvolden, and T. D. Lorenson, 1998: Chemistry, isotopic composition and origin of a methane-hydrogen sulfide hydrate at the Cascadis subduction zone.
Earth Planet. Sci. Lett., 156, 173-183.
Katzman, R., W. Holbrook, and C. Paull, 1994: Combined vertical incidence and wide-angle seismic study of a gas hydrate zone, Blake Ridge. J. Geophys. Res., 99, 17975-17995. Korenaga, J., W. S. Holbrook, S. C. Singh, and T. A. Minshull, 1997: Natural gas hydrate on the southeast U. S. margin: constraints from full waveform and traveltime inversions of wide-angle seismic data. J. Geophys. Res., 102, 15345-15365.
Korenaga, J., W. S. Holbrook, G. M. Kent, P. B. Kelemen, R. S. Detrick, H. C. Larsen, J. R. Hopper, and T. Dahl-Jensen, 2000: Crustal structure of the southeast Greenland margin from joint refraction and reflection seismic tomography. J. Geophys. Res., 105, 21591-21614.
Kvenvolden, K. A., and T. J. McDonald, 1985: Gas hydrates of the Middle American trench - DSDP Leg 84, Init. Rep., DSDP 84, 667-682.
Lin, A. T., and A. B. Watts, 2002: Origin of the West Taiwan basin by orogenic loading and flexure of a rifted continental margin. J. Geophys. Res., 107, 3505-3518.
Lin, C. C., A. T. Lin, G. Chen, C. S. Liu, and P. Schnürle, 2005: Classification and distribu-tion of bottom simulating reflectors off southwest Taiwan. Geodynamics and Environ-ment in East Asia International Conference & 5th Taiwan-France Earth Science Symposium, Taitung, Program and Abstracts, 54.
Lodolo, A., A. Camerlenghi, G. Madrussani, U. Tinivella, and G. Rossi, 2002: Assessments of gas hydrate and free gas distribution ofn the south Shetlanf margin (Antarctica) based on multi-channel seismic reflection data. Geophys. J. Int., 148, 103-119. Mienert, J., and J. Posewang, 1999: Evidence of shallow- and deep-water gas hydrate
destablilizations in North Atlantic polar continental margin sediments. Geol. Mar. Lett., 19, 143-149.
Minshull, T., and R. S. White, 1989: Sediment compaction and fluid migration in the Makran accretionary prism. J. Geophys. Res., 94, 7387-7402.
Moser, T. J., G. Nolet, and R. Snieder, 1992: Ray bending revisited. Bull. Seismol. Soc. Am., 82, 259-288.
Netzeband, G. L., C. P. Hubscher, D. Gajewski, J. W. G. Grobys, and J. Bialas, 2005: Seismic velocities from the Yaquina forearc basin off Peru: evidence for free gas within the gas hydrate stability zone. Int. J. Earth-Sci., 94, 420-432.
Paige, C. C., and M. A. Saunders, 1982: LSQR: An algorithm for sparse linear equations and sparse least squares. Trans. Math. Softw., 8, 43-71.
Papazachos, C., and G. Nolet, 1997: P and S deep velocity structure of the Hellenic area obtained by robust nonlinear inversion of travel times. J. Geophys. Res., 102, 8349-8367.
Pecher, I. A., T. A. Minshull, S. C. Singh, and R. von Huene, 1996: Velocity structure of a bottom simulating reflector offshore Peru: results from full waveform inversion. Earth
Planet. Sci. Lett., 139, 459-2469.
Pecher, I. A., C. R. Rnerco, R. von Huene, T. A. Minshull, and S. C. Singh, 1998: The nature and distribution of bottom simulating reflectors at the Costa Rican convergent margin.
Geophys. J. Int., 133, 219-229.
Ruppel, C., and M. Kinoshita, 2000: Fluid, methane and energy flux in an active margin gas hydrate province, offshore Costa Rica. Earth Planet. Sci. Lett., 179, 153-165.
Schnürle, P., and C. S. Liu, 2005: Structural controls of the BSR distribution offshore south-western Taiwan from a 2.5 D seismic reflection survey. Geodynamics and Environ-ment in East Asia International Conference & 5th Taiwan-France Earth Science Symposium, Taitung, Program and Abstracts, 55-56.
Shipley, T. H., M. H. Houston, R. T. Bufer, F. J. Shaub, K. J. McMillen, J. W. Ladd, and J. L. Worzel, 1979: Seismic evidence for widespread possible gas hydrate horizons on con-tinental slopes and rises. AAPG Bull., 63, 2204-2213.
Singh, S. C., T. Minshull, and G. Spence, 1993: Velocity structure of a gas hydrate reflector.
Science, 260, 204-207.
Sloan, E. D., 1990: Clathrate Hydrates of Natural Gases, Marcel Dekker, New York, 641 pp. Sloan, E. D., 1998: Physical/chemical properties of gas hydrates and applications to world margin stability and climate change. In: Henriet, J. P., J. Mienert (Eds.), Gas Hydrates: Relevance to World Margin Stability and Climate Change, Geol. Soc. Spec. Publ., 137, London, 31-50.
Tamano, T., T. Toba, and Y. Aoki, 1983: Development of forearc continental margins and their potential for hydrocarbon accumulation. Proceedings of the World Petroleum Congress, PD 3, 1-11.
Taylor, M. H., W. P. Dillon, and I. A. Pecher, 2000: Trapping and migration of methane associated with the gas hydrate stability zone at the Blake Ridge Diapir: new insights from seismic data. Mar. Geol., 164, 79-89.
Tinivella, U., and F. Accaino, 2000: Compressional velocity structure and Poisson’s ratio in marine sediments with gas hydrate and free gas by inversion of reflected and refracted seismic data (South Shetland Islands, Antarctica). Mar. Geol., 164, 13-27.
Toomey, D. R., S. C. Solomon, and G. M. Purdy, 1994: Tomographic imaging of the shallow crustal structure of the East Pacific Rise at 9°30’N. J. Geophys. Res., 99, 24135-24157. Trehu, A., M. E. Torres, G. F. Moore, and E. Suess, 1999: Temporal and spatial evolution of a gas hydrate-bearing accretionary ridge on the Oregon continental margin. Geology, 27, 939-942.
Van Avendonk, H. J. A., A. J. Harding, and J. A. Orcutt, 1998: A two-dimensional tomo-graphic study of the Clipperton transform fault. J. Geophys. Res., 103, 17885-17899. Yu, H. S., and Y. W. Chow, 2001: Characteristics and development of the flextural forebulde and
basal unconformity of Western Taiwan Foreland Basin. Tectonophysics, 333, 277-291. Zhao, D., A. Hasegawa, and S. Horiuchi, 1992: Tomographic imaging of P and S wave
veloc-ity structure beneath northeastern Japan. J. Geophys. Res., 97, 19909-19928.
Cheng, W. B., C. S. Lee, C. S. Liu, P. Schnürle, S. S. Lin, and H. R. Tsai, 2006: Velocity structure in marine sediments with gas hydrate reflectors in offshore SW Taiwan, from OBS data tomography. Terr. Atmos. Ocean. Sci., 17, 739-756.