國
立
交
通
大
學
生化工程所
碩
士
論
文
幽門螺旋桿菌之熱迫性蛋白 60 藉由引發調控性
T 細胞的產生而抑制週邊血液單核球之增生
Heat Shock Protein 60 of Helicobacter pylori Suppresses The
Proliferation of Peripheral Blood Mononuclear Cells by The Induction of
Regulatory T cells
研 究 生:謝源庭
指導教授:廖光文 教授
幽門螺旋桿菌之熱迫性蛋白 60 藉由引發調控性 T 細胞的產
生而抑制週邊血液單核球之增生
Heat Shock Protein 60 of Helicobacter pylori Suppresses The Proliferation of Peripheral Blood Mononuclear Cells by The Induction of Regulatory T cells
研 究 生:謝源庭 Student:Yuan-Ting Hsieh
指導教授:廖光文 Advisor:Kuang-Wen Liao
國 立 交 通 大 學
生化工程所
碩 士 論 文
A ThesisSubmitted to Institute of Biochemical Engineering College of Biological Science and Technology
National Chiao Tung University in partial Fulfillment of the Requirements
for the Degree of Master
In Biochemical Engineering
July 2008
Hsinchu, Taiwan, Republic of China
中華民國九十七年七月
幽門螺旋桿菌之熱迫性蛋白 60 藉由引發調控性 T 細胞的產生
而抑制週邊血液單核球之增生
學生:謝源庭 指導教授:廖光文
國立交通大學生物科技學系生化工程所碩士班
摘要: 幽門螺旋桿菌是一種常見的腸胃道細菌,其特徵為可在腸道引發長期 的慢性感染。目前有許多對於其毒力因子與免疫抑制上的相關研究,然而 這些毒力因子並無法幫助每個亞種在體內生存。根據文獻探討,有一些物 種的熱迫性蛋白在免疫上扮演著兩種截然不同的角色。例如來自 Mycobacterium tuberculosis 的熱迫性蛋白 60 便可引發調控性 T 細胞的增生 來達到抑制免疫反應的目的。因此我們假設也許幽門螺旋桿菌的熱迫性蛋 白60 也許也有類似的功能。在我們的實驗中,我們利用週邊血液單核球 以及CD3+ T 細胞做為實驗對象來研究幽門螺旋桿菌熱迫性蛋白 60 是否對 於調控性T 細胞在 CD4+ T 細胞中的比例有所提昇。首先,我們先觀察該 蛋白是否對細胞的增生有所影響。發現該蛋白對於週邊血液單核球的增生 有嚴重的抑制。而對於週邊血液單核球的抑制乃是跟細胞生長的停滯有關。 稍後我們想找出的這種抑制的現象是否跟調控性T 細胞相關。在經過細胞 表面抗原染色以及 foxp3 訊息 RNA 的表現程度顯示在經過幽門螺旋桿菌熱 迫性蛋白60 的刺激後,調控性 T 細胞在 CD4+ T 細胞中所佔的比例會有所 上升。綜合上述所得到的結論,我們發現幽門螺旋桿菌之熱迫性蛋白60 能夠促使調控性T 細胞的比例上升,而這樣子的上升或許可以幫助幽門螺 旋桿菌逃脫於免疫系統的攻擊。Heat Shock Protein 60 of Helicobacter pylori Suppresses The
Proliferation of Peripheral Blood Mononuclear Cells by The Induction of
Regulatory T Cells
Student: Yuan-Ting Hsieh Advisor: Dr. Kuan-Wen Liao
Institute of Biochemical Technology
National Chiao Tung University
Abstract
H. pylori is a common gastrointestinal bacterium that causes chronic
inflammation for lifelong. Many factors were investigated to see their
functions on immune suppression. However, these factors may not be
strong enough to help every stain escape from immune responses.
According to the literature research, some members of heat shock
proteins play a dual role in immune responses. For example,
Mycobacterium tuberculosis hsp60 (Mt hsp60) protects the rat from
arthritis by inducing Treg. Thus, we hypothesized that H. pylori heat
shock protein 60 (Hp hsp60) might also induce Treg generation to
suppress almost every population of immune cells. In our study, we used
PBMC and CD3
+T cells as targets to investigate whether Hp hsp60
increases the percentage of Treg in CD4
+T cells. At first, we
demonstrated the effect of Hp hsp60 on cell proliferation which is a
character for immune cell activation. We found that Hp hsp60 has a
strong suppressive ability for PBMC proliferation and a slight effect on
Jurkat cells, which is a T lymphoma cell line. In addition, the
proliferation inhibition was caused by cell arrest. The proliferation
inhibition caused by Hp hsp60 might be due to the cell arrest.
Furthermore, we intended to see whether this inhibition was associated
with Treg. The CD4/CD25 double staining and foxp3 mRNA expression
level showed that the Treg were increased after treated with Hp hsp60.
Taken together, we found that Hp hsp60 could increase Treg cell
generation and may help H. pylori escape from the immune system.
Acknowledgements 時光一點一滴的流逝,轉眼間,我已經在這個實驗室待了四年。這裡充滿了 我許許多多待在交大的回憶,現在回想起來,仍不禁莞爾一笑。在這些日子裡, 我和許多人一起共事,一起歡樂,一起分享屬於我們自己的秘密。如今當我坐在 電腦前完成我的碩士論文時,我由衷的感謝這些曾經幫助過,鼓勵過我的人。 首先,當然最要感謝的當然是我的指導教授,廖光文博士。老師是我在生命 科學這條路上的第一位引路人,他常以自身做為例子來鼓勵我們努力的向上發展。 除此之外,他也在實驗的技術、設計以及邏輯思考上不吝的給予我極大的啟發以 及幫助。我想以後如果我僥倖有所成就的話,老師絕對是對我幫助最大的人之一。 另外也感謝林志生老師、袁俊傑老師、吳彰哲老師以及蔡女滿老師在百忙之中, 幫我修改論文以及在實驗上對我的指導以及意見。 當然除了老師的幫助之外,我也要感謝實驗室的每一位同仁,認識你們應該 是我這四年中最大的收穫。首先最要感謝的當然是靜宜學姐,你應該算是我半個 老師了吧(笑)。謝謝妳在這四年中對我無論是實驗上或者是其他方面上的幫助, 在我最近這半年的低潮其中,學姊、其翰以及依穎無疑的是我精神上最大的支柱。 感謝上知大好人,謝謝你這三年來對我們生活上無微不至的照顧,祝你在未來的 路上一帆風順(什麼路請自己加,XD)。其翰、彥谷以及昱丞,與你們相處了 六年,這樣的緣分很難得。大一的十二點宵夜團是我 78 公斤的元兇,大一暑假 的生科營和大二的迎新宿營與你們一起共同完成了許多艱難的任務。大三進入實 驗室後與你們一起整理實驗室,還記得當初我們得把牆壁上的油漆刮下來再重新 粉刷的情境嗎。大四的推甄考試也多虧了你們的幫助,我才能順利的考上研究所, 碩士班的生活也多虧了你們才多出了許多的歡笑,希望其翰在當完兵後能夠順利 的考上國外前十大,彥谷能夠順利如期的完成學業,昱丞在當完兵後也希望能夠 找到你未來的方向。(這一段請戴墨鏡)至於依穎,雖然我在碩士班才認識你, 不過畢竟不算慢,很快的我們也在一起一年半了,在這一年半中謝謝你對我脾氣 的包容以及願意分享以及分擔我的快樂與失意,希望我們在接下來的路上可以繼 續互相扶持下去。何姵、筑婷以及維瞳,認識你們雖然才一年多,不過也多虧了 你們提供了源源不絕蛋白質使我們在實驗上無後顧之憂。另外,于鈴學姊、家弘 (還是叫阿伯比較順口)、立筠以及莉沂,雖然我們不在同一組,但仍然感謝你 們平常所給予的幫忙,祝你們在實驗以及生活上都一切順利。至於新進的學弟妹 也祝你們在近來實驗室後都能夠獲得一些收穫。 轉眼間,我在交大的生涯即將告一段落,感謝大家為我所做的一切,最後也 都祝大家能夠都順順利利的畢業,愛情事業兩得意。 源庭 2008.08.16 00:00 筆
CONTENTS 中文摘要 i Abstract ii Contents iv List of Figure ix List of Table xi
List of Appendix xii
List of Abbreviations xiii
Chapter 1 Introduction………...1
1.1 Helicobacter pylori ………1
1.1.1 Background………...1
1.1.2 H. pylori induced immune responses………1
1.1.2.1 Innate immunity………..2
1.1.2.2 Adaptive immunity……….4
1.1.2.2.1 Cellular response………...5
1.1.2.2.2 Humoral response………...6
1.1.3 Factors modulating the immune response to H. pylori in humans………7
1.1.3.2 Vac A………...8
1.1.3.3 Arginase………..9
1.1.3.4 Other factors………...9
1.1.3.5 The limitation of factors mentioned above………...10
1.2 Heat shock protein………...11
1.2.1 Background……….11
1.2.2 The relationship between hsps and immune responses………...12
1.2.3 Hsps play a role in immune modulation………...13
1.2.4 H. pylori heat shock protein 60 (Hp hsp60)………13
1.2.4.1 Background………..13
1.2.4.2 Hp hsp60 induced immune responses………...14
1.2.4.3 The immune modulation role of Hp Hsp60………..14
1.3 CD4+CD25+ regulatory T cells……….15
1.3.1 Background……….15
1.3.2 Adaptive Treg (aTreg).………...16
1.3.2.1 Differentiation of aTreg//………..16
1.3.2.2 foxp3……….17
Chapter 2 Streategy………..19
Chapter 3 Material and Method………...………21
3.1 Material………..21 3.1.1 Reagent………21 3.1.2 Antibody………..22 3.1.3 Kit………22 3.1.4 Instrument………23 3.15 Others………...23 3.2 Method………...24
3.2.1 pET-Hp Hsp60 plasmid construct………...24
3.2.2 RE digestion………25
3.2.3 Transformation………25
3.2.4 Midi-preparation………..26
3.2.5 rHp hsp60 protein expression….……….27
3.2.6 SDS-PAGE and Western blotting………...29
3.2.7 PBMC isolation………...30
3.2.8 CD3+ T cell isolation………...30
3.2.10 MTS assay……….32
3.2.11 Annexin V-FITC/PI apoptosis assay……….32
3.2.12 TGF-β cytokine secretion detection………..33
3.2.13 Cell surface marker staining………..34
3.2.14 RNA isolation………34
3.2.15 Reverse transcription……….35
3.2.16 Real-time PCR………..36
3.2.17 Statistical analysis……….37
Chapter 4 Results……….38
4.1 The effect of Hp hsp60 on immune cells………...………38
4.1.1 Hp hsp60 inhibits the proliferation of PBMC and jurkat cells, whereas has no effect on CD3+ T cells………..………...38
4.1.2 Hp hsp60 inhibit the cell proliferation neither by apoptosis nor by necrosis.39 4.2 The effect of Hp hsp60 on Treg differentiation………....40
4.2.1 Hp hsp60 increase the percentage of Treg in CD4+ T cells………40
4.2.2 Hp hsp60 induces the foxp3 mRNA expression under the TCR stimulation..41
List of Figures
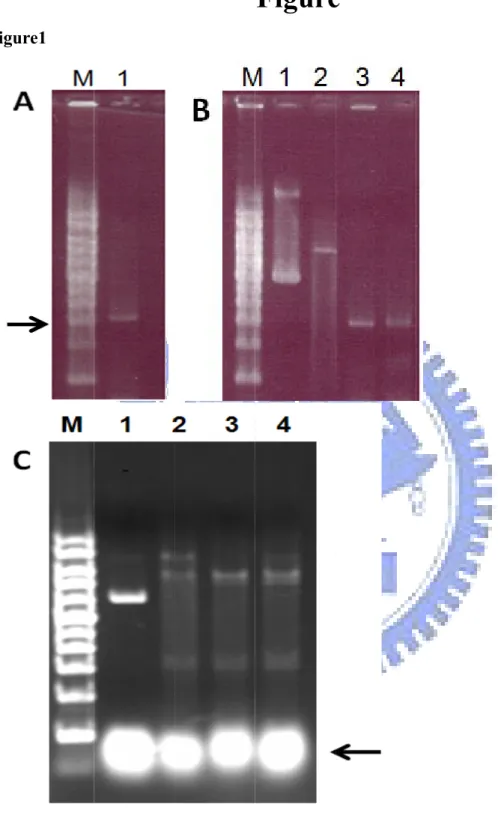
Figure 1. The PCR product and the cloning RE check gel electrophoresis……….…47
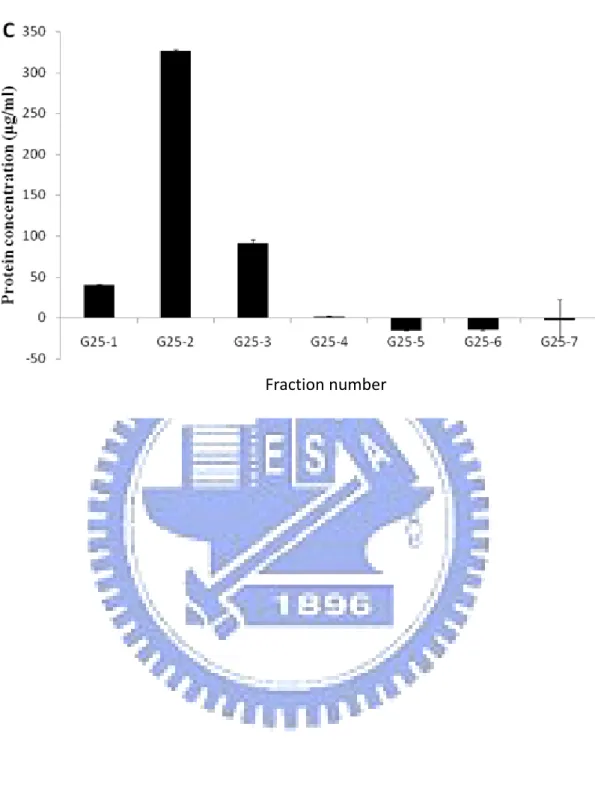
Figure 2. The protein concentration of each fraction in the protein purify procession……….49
Figure 3. SDS-PAGE and Western blotting of Hp hsp60……….………...…51
Figure 4. The PBMC and CD3+ T cell purity………..52
Figure 5. The effect of Hp hsp60 on proliferation of PBMC………..53
Figure 6. The effect of Hp hsp60 on proliferation of CD3+ T cells………….………54
Figure 7. The effect of Hp hsp60 on proliferation of Jurkat cells………...…………55
Figure 8. Different physiological stage of cells in Annex V-FITC / PI double staining assay……….56
Figure 9. The effect of Hp hsp60 on PBMC cell proliferation inhibition………57
Figure 10. The effect of Hp hsp60 on CD3+ T cell physiology………...58
Figure 11. The CD4+CD25+ T cell percentage in CD4+ T cells………..59
Figure 12. The effect of Hp hsp60 on CD4+CD25+ T cell population of CD4+ T cells in PBMC……….60
Figure 13. The effect of Hp hsp60 on CD4+CD25+ T cell population of CD4+ T cells in CD3+ T cells………61
Figure 15. The TGF-β1 concentration in Hp hsp60-treated PBMC and CD3+ T cell supernatant………..64
List of Table
Table 1. The reference about the effects of H. pylori virulence factors on immune suppression………66 Table 2. The homology of H. pylori virulence factors among different strains……..67 Table 3. The immune suppression of different species Hsps protect the host from
List of Appendix
Appendix 1. The amino acid homology of different virulence factors in different stains……….69 Appendix 2. The map of pET-Hp hsp60……….………...………..88
List of Abbreviation
cDNA Complementary DNA
CagA Cytotoxin-associated gene A
CTLA-4 Cytotoxic T lymphocyte-associated antigen 4
DC Dendritic cell
Foxp3 Forkhead box p3
GroEL The same as hsp60
GITR Glucocorticoid-induced tumor-necrosis factor (TNF) receptor-related protein
Hsp Heat shock protein
IFN-γ Interferon -γ
Ig Immunoglobulin
IL-1β Interleukin - 1β
LPS Lipopolysaccharide
MALT Mucosa-associated lymphoid tissue
MAPK Microtubule-associated protein kinase
MHC Major histocompatibility complex
NF-κB Nuclear factor κB
NK Natural killer cell
PAI Pathogenicity island
PBMC Peripheral blood lymphocyte
PML Polymorphonuclear leucocytes
aTreg Adaptive regulatory T cells
TCR T cell receptor
TGF-β Transforming growth factor beta
Th T helper cells
TLR Toll-like receptor
nTreg Natural T cells
TNF-α Tumor necrosis factor-α
Tr1 Type 1 regulatory T cells
Treg regulatory T cells
Chapter 1 Introduction
1.1 Helicobacter pylori 1.1.1 Background
H. pylori is a very common gastrointestinal bacterium which infects various areas of stomach and duodenum. More than half population in the world were infected with this gram negative bacterium. It is a spiral-shaped bacterium
discovered by Marshall and Warren in 1984 [1]. It is thought to be a microaerophile and neutralophile bacterium although stomach is an acidic environment.
H. pylori causes the chronic infection and the majority is asymptomatic. However, it is highly associated with many gastric diseases such as peptic ulcer, gastritis, duodenitis, gastric adenocarcinoma, and Mucosa-associated lymphoid tissue (MALT) lymphoma [1-4]. In Correa cancer cascade model [5], he thought that the lifelong infection causes the accumulation of DNA mutation which leads to the outcome of cancer. H. pylori has been categorized as a group I carcinogen by IARC (the International Agency for Research on Cancer) in 1994.
1.1.2 H. pylori induced immune responses
generate the non-specific and specific immune responses to eliminate the pathogen from the human body. When H. pylori infects the host, it induces both innate and adaptive immunities [6].
1.1.2.1 Innate immunity
Innate immunity is the first line to defend against the bacteria invasion. The members of innate immunity include granulocytes, macrophages, monocytes, dendritic cells, mast cells, and NK (nature killer) cells. The innate immunity is a quick and non-specific procession. Most two important functions of innate immunity are to clear the pathogen infection and participate in the initiation and subsequent direction of adaptive immune responses. Because there is a delay about one week before adaptive immunity ready, it has to control the infection in this period.
When H. pylori infects and colonizes at the stomach, it recruits many innate immune cells to infiltrate the area [7]. These cells include neutrophils, mast cells, macrophages, and dendritic cells. Many virulence factors of H. pylori involve in this recruitment. For example, HP-NAP, a 150-kD oligomeric protein, recruits
neutrophils and mast cells and activates them to produce reactive oxygen
uptake H. pylori and form phagosome inside these cells. However, in previous studies, H. pylori seems to resistant the intracellular killing and survive in the phagosome [9].
To detect the H. pylori invasion, macrophages and monocytes recognize the bacterial molecules by TLRs (Toll-like receptors). After the ligand-receptor docking, TLRs would deliver a signal that induces the secretion of proinflammatory cytokines such as TNF-α (tumor necrosis factor-α), IL (interleukin) - 1β and IL-8 [10, 11]. Thus, when H. pylori infects host, it induces the inflammation at the infection area. H. pylori contains many antigenic substances including Hsp (heat shock protein), urease, and LPS. These molecules stimulate the production of inflammatory cytokines.
At first, scientists thought that since H. pylori is a member of Gram negative bacteria, the LPS of H. pylori may bind to TLR4, which is the receptor of LPS, and activate the immune responses. However, gastric epithelial cells were not sensitive to the LPS of H. pylori [12]. On the other hand, the neutralize antibody for TLR4 could not block the cytokine release [13]. This indicates that H. pylori LPS does not have the similar capability of other Gram negative bacteria LPS and the host
immunity recognizes H. pylori infection by other receptor (s).
In 2003, Smith MF Jr. found that TLR2 and TLR5, but not TLR4, were required for H. pylori-induced NF-κ B activation and chemokine expression by epithelial cells [14]. When macrophages and monocytes detect the H. pylori by TLR2 and TLR5, these two receptors would deliver signals to activate NK-κ B that induce the expression of proinflammatory cytokines such as IL-8. In addition to NK-κB,
MAPK has also been considered to involve in the H. pylori-induced IL-8 expression. The proinflammatory cytokines accumulation at the infection area results in a local chemotaxis that attracts the granulocytes infiltration. These cytokines would form a positive feedback to enhance the inflammation level. However, besides the large amounts of proinflammatory cytokines, H. pylori also induces the secretion of TGF-β (transforming growth factor beta) which is a strong, pleiotropic regulatory cytokines [11].
1.1.2.2 Adaptive immunity
After innate immunity contacts with H. pylori, it helps adaptive immune system to develop responses specific for H. pylori. The adaptive immunity specific for H. pylori could be divided into two parts, cellular responses and humoral responses.
1.1.2.2.1 Cellular immunity
When innate immune cells such as dendritic cells uptake the bacterial molecule, they digest the molecule and migrate to lymph node where they present epitope to naïve T cells. After presentation, CD4+ T cells would be differentiated into different phenotype of effector T cells: Th1 (T helper 1), Th2, Th17 and regulatory T cells (Treg).
The molecule presented to T cell influences the T cell differentiation outcome. The H. pylori antigens have the ability to result in a Th1-predominant host immune response in gastric mucosa [15]. The Th1-predominant responses were characterized by induction of IFN (interferon) -γ and IFN-γ-related genes expressions. It also induces the proinflammatory cytokines level such as IL-12, IL-18 and TNF-α. In Houghton’s research, the robust mucosal Th1 response is associated with the
progression to gastritis and gastric cancer [16]. This is because that inflammation cells and Th1 cells are typically responsible for clearing the intracellular pathogens.
However, H. pylori is not one of them. These immune responses would result in gastric epithelial cell damage rather than clear the H. pylori. The more damage result from immune cells, the higher possibility of tumorgenesis.
1.1.2.2.2 Humoral immunity
Patients infected with H. pylori were confirmed to elicit a strong local and systemic antibody responses thatwere specific for H. pylori. The serum of patients were response to many components of H. pylori including membrane proteins,
flagelin, urease, LPS, and HSPs. The isotype of these antibodies contain both IgG and IgA [17, 18]. In addition, there also contains the anti-H. pylori sIgA (secretory IgA) was also found in the gastric secretion, saliva and breast milk.
Although there are vigorous antibody responses, these antibodies seemed to have little effect to clear the bacterium from the host unless the patients were treated with combination of antibiotics. Very few researches show that the antibodies had the clearance effect on H. pylori. Tosi and Czinn reported that the binding of the IgG promoted the phagocytosis via PMN (polymorphonuclear leucocytes) [17]. Some reports also show that breast milk which contains high titers sIgA had the ability to protect the infects from H. pylori infection during infectious period [19]. However, Clyne’s report did not agree with this finding because sIgA did not inhibit the H. pylori adhesion on the gastric cells [20]. Moreover, antibodies sometimes even worsen the patient’s condition. About 20%~30% of the H. pylori-infected patients
develop the autoantibodies to block the gastric proton pump which contributes to the gastric damage level.
1.1.3 Factors modulating the immune response to H. pylori in humans
Although H. pylori induces various immune responses mentioned before, it still evades these attacks and causes the lifelong infection. It indicates that H. pylori has established the immune modulation mechanism(s) to escape from immune responses. We collected some reports about the immune modulation ability of these virulence
factors in Table 1.
1.1.3.1 CagA
Cytotoxin-associated gene A antigen (CagA) is a 120-145kD immunodominant protein. This protein is encoded by the cagA gene which is localizd at cag PAI (cag pathogenicity island). Besides the cagA gene, the cag PAI also contains genes encode the components of type IV secretion system which injects the CagA into cells. In 2003, Umehara found that CagA plays an important role in B lymphocyte growth inhibition which may diminish the anti- H. pylori responses [21]. Furthermore, CagA also effects on CD4+ T cell differentiation. It is associated with reduced expression of IL-4 mRNA [22]. IL-4 is a pleiotropic cytokine that promotes Th2 differentiation and
suppresses the Th1 differentiation.
1.1.3.2 VacA
VacA (vacuolating cytotoxin A) is a 90kD secret form protein that is originally thought as the toxin for gastric epithelial cells. In recent year, it turns to become a potential immune suppression toxin which aims at the adaptive immunity. Molinari showed that VacA can inhibit the processing of antigenic peptides in B cells and their presentation to human CD4+ T cells by interfering with peptide loading on the newly
synthesized MHC (major histocompatibility complex) II [23].
Clinical data found that PBMC (peripheral blood lymphocyte) proliferation from patients are lower than those from health donors. In 2003, VacA was found to
efficiently block both il-2 expression and IL-2Rα surface location and thus inhibits the positive feedback [24]. When PBLC (peripheral blood lymphocytes) were treated with VacA, it resulted in a reduced phosphorylation and activation of Rb
(retinoblastoma) protein and then arrested the cell cycle at G1/S checkpoint [24]. In 2003, when VacA bound to an unknown receptor, it caused activation of Rac and p38 which results in inhibition of T cell proliferation and an anergic state of T cells [25, 26]. All these reports show that VacA is a powerful virulence factor for immune
suppression.
1.1.3.3 Arginase
Arginase is a highly conserved enzyme across kingdoms. It is encoded by the gene rocF. Arginase compares with NOS (NO synthases) for the common substrate, L-arginine. Therefore, the presence of H. pylori influences the synthesis of NO. NO is a critical antimicrobial agent of the innate immunity to cause intracellular killing. NO has been proved to have the toxic effect on H. pylori [27]. In Gobert’s study, even H. pylori induced high level iNOS mRNA expression, the level of NO induced by rocF -/-strain is significantly lower than that induced by wild type stain [28]. Not only the innate immunity but also the adaptive immunity are influenced by arginase. It has been found that Arginase decreases the expression of the CD3ζ chain of TCR (T cell receptor) and then inhibits the TCR signal [29].
1.1.3.4 Other factors
Flagellin is a potent molecule to elicited inflammation. It is usually detected by TLR5 which delivers a signal via p38 to express IL-8. However, H. pylori Flagellin which encoded by flaA has less potent (1000 fold) than those of Salmonella
detection [30].
Many bacteria adapt environment and escape from immune responses by genomic DNA rearrangement. H. pylori has the highest genetic recombination rate among any known bacterial species [31].
1.1.3.5 The limitation of factors mentioned above
As described before, H. pylori establishes many mechanisms to escape from the immune responses. However, these mechanisms and virulence factors are not present in every stain. cag PAI only present in about 60 % stains [32]. Despite almost 100 % of H. pylori carry vacA gene, only 50 % of stains can secrete functional protein [33]. Other factors such as Arginase also have their limitation on immune suppression. This is because it mainly effects on the innate immunity, not on the adaptive immunity. Nevertheless, the major function of innate immunity is to control the infection level. Only suppressing or weakening the killing ability of innate immunity can’t guarantee that they would survive from the immune responses.
According to these limitations, it seems that not every strain of H. pylori is easy to survive in host. However, this is a controversy because stains without these factors
still colonize in the host. Therefore, there must have other unidentified factor to help H. pylori survivve. This unidentified factor should have three characters. First, it must be present in every strain. Second, the homology of this factor among stains should be very high. Finally, it has the immune suppression ability. To find out the factor, we examine the common virulence factors of H. pylori with these three features. These common factors includes the heat shock protein 60 (GroEL), heat shock protein 70 (DnaK), Arginase, CagA, VacA, BabA, SabA, and UreB. However, CagA is not fit the first feature. To get the homology of each factor among strains, we align the amino acid sequence from at least four stains including ATCC domestication stains and
clinical stains. The alignment results are shown in Appendix 1 and Table 2. According to the homology level, the factors are listed in the order: hsp60, hsp70, UreB, Arginase, SabA, BabA, VacA, and CagA. Thus, we choose hsp60 as our first candidate as the unidentified factor. However, the relationship between hsp60 and immune suppression is still unknown.
1.2 Heat shock protein 1.2.1 Background
Heat shock proteins belong to the superfamily of stress protein. They often express constitutively but can be induced and secreted by stress such as increased
temperature (ex. fever), exposed to proinflammatory factors and oxidative stress [34]. They are important for the survival of prokaryotic and eukaryotic cells. Hsps are initially thought to be chaperone whose major function is to fold newly synthesized proteins or refold the incorrectly folded proteins. However, more and more reports show that hsp have another role to be an immune response mediator.
1.2.2 The relationship between Hsps and immune responses
Hsps, initially considered as intracellular protein, has been found to be released into the extracellular environment. Because of their high conservation, both
prokaryotic and eukaryotic hsps are highly antigenic. For example, when bacteria infect human body, they release their hsp at the infection area and induce
proinflammatory cytokine secretion. Similarly, when host cells would contact with LPS and GroEL (another name for prokaryotic hsp60), they release their own hsps such as hsp60 and hsp70 [35]. Both hsp60 and hsp70 has been identified as danger signals. After hsp60 and hsp70 are released, they are able to activate the innate immune cells [36], such as macrophage and DC, and induces the proinflammatory cytokine expression including TNF-α and IL-6. According to these characters, hsps have powerful ability to induce inflammation.
1.2.3 Hsps play a role in immune modulation
However, hsps, including hsp60, hsp70, and hsp10, seem to not only function as an inflammation stimulator. More and more reports show that hsps might have dual role on immunity. In recent studies, scientists reported that hsps, including hsp60 and hsp70, exhibit anti-inflammation property [37]. Both hsp60 and hsp70 from
Mycobacterium tuberculosis both have the ability to reduce the inflammation in arthiritis [38]. Besides, when rat were immunized with peptides from M. tuberculosis hsp70, M. tuberculosis-specific T cells were detected and were response to M.
tuberculosis hsp70. However, these T cells produced IL-10 which means hsp70 from M. tuberculosis has the ability to suppress the immune responses, so did hsp60. However, not only microbial hsp, but also mammalian hsp has similar function. Zanin-Zhorov showed that human hsp60 enhances the function of CD4+CD25+ regulatory T cell via TLR signal pathway [39]. The immune suppression property of
different species hsps are shown in Table 3.
1.2.4 H. pylori heat shock protein 60 (Hp Hsp60) 1.2.4.1 Background
As other members of hsp60, Hp hsp60 is responsible for the folding of certain protein: urease B. In addition to be an intracellular protein, it also expresses as
membrane form which is associated with adhesion [40]. In our previous preliminary result, we found that knock out the Hp hsp60 would cause death for H. pylori. This shows that Hp Hsp60 is an indispensable factor for H. pylori survival. According to
the Table 2 and Appendix 1, the amino acid sequence of Hp Hsp60 among different species are very conserve. Take these two finding together shows that Hp hsp60 is critical for the survival of H. pylori.
1.2.4.2 Hp hsp60 induced immune response
Besides the chaperone function, it also induces many proinflammatory cytokines just like its families do. Many reports confirm this character of Hp hsp60. For
example, Hp hsp60 induces the IL-6 production in macrophages [41] and IL-8 in monocytes [42]. These proinflammatory cytokine secretion is associated with MAPK signal pathway. So far, the literature research shows that Hsp60 might just be an inflammation stimulator.
1.2.4.3 The immune modulation role of Hp Hsp60
According to the references have been published, it seems that Hp Hsp60 is an inflammation-stimulating factor. However, Hp Hsp60 seems to play another role in immune responses. As mentioned before, M. tuberculosis hsp60 has the ability to
induce the precence of Treg. Additionally, in 2003, Anna Lundgren found that there was
H. pylori-specific Treg was present in H. pylori infection area [43]. Here, we collected some reference about Hsps immune modulation in Table 1. Thus, whether Hp Hsp60 has the similar ability like M. tuberculosis hsp60 to suppress the immune responses is an interesting issue.
1.3 CD4+CD25+ regulatory T cells (Treg) 1.3.1 Background
The main function of immune system is to protect host from the attack of
pathogens, but result in the minimal damage to normal tissue. To achieve this goal, the negative control of the immune cell activation is very important. The first line to eliminate the self-reactive T and B cells is the negative selection in the thymus and bone marrow. However, the negative selection can’t eliminate all the self-reactive lymphocyte, Thus, there had long been believed that the immune system must have peripheral mechanisms to deal with the self antigen reactive immune cells that escape from the central tolerance. In the early 1970s, Gershon found that there was a specific group of thymocytes that suppressed the immune responses. In 1995, Sakaguchi first showed that T cells express CD25, the IL-2 receptor α-chain, had the ability to tolerance the immune ability [44]. Until now, Treg can be divided into three major
populations: natural T CD4+CD25+Foxp3+ regulatory cells (nTreg), peripherally adaptive T CD4+CD25+Foxp3+ regulatory T cells (aTreg), and IL-10-secreting Type 1 regulatory T cells (Tr1). There are also some other kinds of Tregs, such as
TGF-secreting Th3 cells, and NKT cells. In this study, we focus on the aTreg.
1.3.2 adaptive Treg (aTreg) 1.3.2.1 Differentiation of aTreg
Unlike nTreg which is mature at thymus, aTreg are induced from mature
peripheral CD4+CD25- T cells. The presence of Foxp3 (forkhead box p3) on nTreg is dependent on thymic maturation, whereas the expression of Foxp3 of aTreg can be stimulated in the presence of TGF-β and results in acquisition of suppressive function [45]. However, TGF-β alone is not fully effective in mediating Treg induction and IL-2 is an important co-stimulator. Besides, the TCR activation is also required for the expression of the Foxp3 [46]. On the other hand, other cytokines also play the
regulatory role on this differentiation and maturation procession. In in vitro and in vivo study, Th1 and Th2 cytokines, such as IFN-γ and IL-4, have the antagonistic function on the peripheral induction of Foxp3+ regulatory T cells [47]. It has been realized that Treg express several unique markers including extracellular and intracellular molecules. The formers include CD25, CD62L, and CD45,
glucocorticoid-induced tumor-necrosis factor (TNF) receptor-related protein (GITR), and cytotoxic T lymphocyte-associated antigen 4 (CTLA-4). The latter includes the transcription factor, Foxp3.
1.3.2.2 Foxp3
Foxp3 is a transcription factor that belongs to the forkhead/winged-helix family. It constitutively expresses at high level in both nTreg and aTreg. It is not only to be a intracellular marker, but also to be a crucial transcription factor for the development and maturation of CD4+CD25+ Tregs. Both in mice and human, function mutations in Foxp3 result in the absence of Tregs which leads to severe autoimmune disorders [48], known as scurfy mice and IPEX (immunedysregulation, polyendocrinopathy,
enteropathy, and X-linked syndrome) in men. These studies indicate that Foxp3 expression is important for the differentiation and function of Treg.
1.3.2.3 Function of aTreg
Although the differentiation source and pathway is difference, the function of aTreg is very similar to nTreg. The major function of Treg is to suppress the immune
responses and this suppression must be triggered by TCR activation. Interestingly, once activated, the suppression seems to be antigen-nonspecific. The mechanism of
the suppression is cell- contact dependent. This contact educates the CD4+ T helper cells to become induced suppressor cells. It might mediate directly to the T effector cells by GITR and CTLA-4 [49]. On the other way, the contact suppression can also mediate indirectly. Ligation between CD80/CD86 on the DCs and CTLA-4 on Treg could modulate DC function by inducing the expression of IDO (indoleamin 2, 3-dioxygenase) which degrades tryptophan. The reduced Try concentration results in reduction of T cell activity.
Chapter 2 Strategy
Combine with the possible immune suppression function, the indispensable character, and the high conserve homology, Hp Hsp60 might be the unidentified factor which helps all the H. pylori strain survive in the host. In this study, we want to know the effect of Hp hsp60 on T cells, especially on the T cell differentiation toward Treg.
At first, we examined the effect of Hp hsp60 on the immune cell proliferation. Thus, we used PBMC and CD3+ T cells as our targets. PBMC are composed of many kinds of immune cells from both innate and adaptive immunity. We used PBMC as our model to mimic the environment of gastric infection area. CD3+ T cells involve in many areas of immunity including B cell activation, T cell differentiation, and the survive of innate immunity. Thus, we also used CD3+ T cells as our investigate target. If Hp hsp60 has an inhibitory effect on the cell proliferation, we want to demostrate whether the mechanism of this inhibition is cell arrest or death. In our experiment, we confirmed it by Annexin V/PI double staining assay to detect the death signal pathway. Next, we will see whether the percentage of CD4+CD25+ T cells would be increase in CD4+ T cells after the treatment of Hp hsp60 by CD4/CD25 double staining. Because the surface staining is not powerful to identify the differentiation of Treg, thus, the foxp3 mRNA expression level would be detected by combination of reverse
Chapter 3 Material and Method
3.1 Material 3.1.1 Reagent
The following reagents and chemicals were obtained as indicated: RPMI 1640, Fetal Bovine Serum (FBS), BSA, and Tryzol from Invitrogen (Gaithersburg, MD, USA). Penicillin/ streptomycin/ amphotericin (PSA) from Biological industries (Beithaemek, Israel). Restriction enzymes from Promega (WI,USA). Kanamycin, pfu polymerase, DNA agarose, Tryptone and Tris bas from MDBio Inc. (Rockville, MD, USA). Ethidium bromide (EtBr), Isopropyl-beta- D-thiogalactopyranoside (IPTG), NaCl, yeast extract, agar, Tris-HCl, Triton X-100, 40% 29:1 acrylamide:
Bis-acrylamide, TEMED and imidazole from Amresco (Solon, OH, USA).
Ficoll-PaqueTM Plus from GE healthcare (Uppsala, Sweeden). Recombinant human interleukin-2 (rhuman IL-2) and rhTGF-β from Peprotech (Rocky Hill, NJ). Primers from Protech (headquartered in Taipei, Taiwan). Sephadex G-25 Medium from Amersham Bioscciences (Uppsala, Sweeden). Nitrocellulose (NC) paper from
PALL(Ann Arbor, MI, USA). Developer and fixer from Kodak (Rochester, NY, USA). Isopropanol from E-ECHO (Miaoli,Taiwan). Propidium iodide (PI), RNase A,
Sodium deoxycholate, APS (ammonium persulfate), and SDS (sodium dodecyl sulfate) from SIGMA-ALDRICH (Steinheim, Germany). EDTA and chloroform from TEDIA
(Fairfield, OH, USA). NaOH, H3PO4, KH2PO4, Na2HPO4, Tween 20, KHCO3, NaN3, and KAc from SHOWA (Saitama, Japan). KCl from Scharlau (Barcelona, Spain). Na2HPO4 from J. T. Baker (Phillipsburg, NJ, USA).
3.1.2 Antibody
The following antibodies were obtained as indicated: Goat anti-mouse IgG MicroBead from Miltenyi Biotec (Bergisch Gladbach, Germany). Mouse anti-human CD3 (UCHT1), mouse anti-human CD3-FITC (HIT3a), mouse anti-human CD4- FITC (RPA-T4), and mouse anti-human CD25-PE (BC96) from Biolegend (Sandiego, CA, USA). HRP- conjugated rabbit anti 6X His antibody from Novus (Littleton, CO, USA). HRP-conjugated goat anti rabbit IgG from MP Biomedicals (Aurora, OH, USA). Mouse anti-human CD3 (OKT3) was kindly provided from Dr. Steve R. Roffler (ACADEMIA SINICA, Institute of BioMedical Sciences).
3.1.3 Kit
The following kits were obtained as indicated: superscript III RT kit from Invitrogen. Human TGFβ1 ELISA kit, and MTS ( 3-(4,5-dimethylthiazol-2-yl)-5- (3-carboxymethoxyphenyl)-2-(4-sulfophenyl)-2H-tetrazolium ) assay kit from Promega. RealQ-PCR master mix kit from Ampliqon (Copenhagen, Denmark).
Coomasie PlusTM Protein Assay Reagent kit and Enhanced chemiluminescence (ECL) system from Pierce (Rockford, IL, USA). Annexin V-FITC apoptosis detection kit from Invitrogen.
3.1.4 Instrument
HisTrapTM HP column from GE healthcare. NeucleoBond ion-exchange resin from Macherey-Nagel (Düren, Germany). MACS® separation LS column from Miltenyi Biotec (Bergisch Gladbach, Germany). UV photography system from EZlab. Sunrise remote control (TECAN). ABI prism 7000 from ABI (USA). FASCan from BD (Bedford, MA, USA).
3.1.5 Others
Escherichia coli (BL21 and DH5α) from Yeastern Biotech Co. H. pylori genome from Department of Internal Medicine, College of Medicine, National Taiwan
University. Human cDNA (complementary DNA) library were kindly provided from Dr. Chich-Sheng Lin (NCTU, Laboratory of Biomedical Engineering, Biological Science & Technology Lab). Nitrocellulose paper (NC paper) and 0.45μm syringe filter from PALL. X ray film from Midsci. Human white blood cells were obtained from Hsinchu Blood Center.
3.2 Method
3.2.1 pET-Hp Hsp60 plasmid construct
For rHp Hsp60 expression, pET-HpHsp60 was constructed (see Appendix). The vector is derived from pET-30a which carries an N-terminal His-tag and multiple cloning sites under the control of T7 promoter. The full-length of Hp Hsp60 was amplified from H. pylori genomic DNA by pfu DNA polymerase. H. pylori genome was isolated clinical strain (HC28) which obtained from gastric cancer patient. The full-length H. pylori was amplified with forward primer 5’- ATC GAA TTC ATG GCA AAA GAA ATC AAA TTT TCA - 3’ and backward primer 5’- GAT CTC GAG TTA CAT CAT GCC GCC CAT G -3’ by PCR (polymerase chain reaction). PCR consisted of a 94 denaturation step followed by 35 cycles of 45℃ s at 95 , ℃ 45 s at 50 and 2℃ min at 72 . After these cycles, incubate the PCR mixture ℃ at 72 10℃ min for complete elongation. The PCR product was checked with 0.8 %
DNA agarose gel by electrophoresis (Figure 1A) and the DNA length is about 1641 bps. The full gene and pET-30a vector were digested with EcoR I and Xho I at 37 ℃
for 3 hr and checked with gel electrophoresis (Figure 1B). The digested fragment length of vector and insert should be 5422 and 1641 bps, respectively. After ligation and transformation, we picked several single colonies from the plate and checked the
insert by screening with RE digestion (Figure 1C). After check, the plasmids were sequenced with primers. The DNA sequence inserted into vector has been submitted to NCBI nucleotide data base (DQ674277).
3.2.2 RE digestion
Restriction enzyme digestion was used for cloning and checking. We used 0.5 μl
RE (EcoRI and XhoI) (10 U/μl) to digest 1 μg DNA in 20 μl volume at 37 for 3℃ hr. The reaction mixture consists of DNA, 10 X RE buffer H, 100 X BSA, RE, and DDW. The digested DNA fragments were checked with 0.8 % DNA agarose gel by
electrophoresis. The gels were analyzed with UV after staining with EtBr for 10 min.
3.2.3 Transformation
Remove the appropriate number of competent cells tubes from the -80 freezer. ℃ DH5α was used for cloning and DNA amplification. BL21 was used for protein expression. After the cells were thawed, add 1 ng DNA into the cells, mix by gently swirling the tip. Incubate the competent cell on ice for 30 min. Heat shock the cell at 42 ℃ for 90 s. Place the cells on ice for 2 min and add 250 μl LB (10 g tryptone, 10 g NaCl, 5 g Yeast extract per liter) and incubate at 37 ℃ with shaking 225 rpm for 1 hr.
extract, 20 g agar per liter) containing kanamycin (30 mg/ml) and incubate at 37 ℃
for 12~16 hr.
3.2.4 Midi-preparation
After transforming the competent cell with plasmid, we picked single colony
from the LB agar plate and incubate with 100 ml LB containing kanamycin (30 μg/ml) at 37 Ԩ for 16 hr at 225 rpm shaking incubator. The broth was harvested by
centrifuging at 8000 rpm for 15 min. The supernatant was discarded and the pellet was resuspended in 8 ml buffer S1 (50 mM Tris-HCl, 10 mM EDTA, 100 μg/ml RNase A, pH 8.0). 8 ml buffer S2 (200 mM NaOH, 1 % SDS) was added for lysis, gently mixed by inverting 6~8 times, and incubate at room temperature for 3 min. 8 ml ice-cold buffer S3 (2.8 M KAc, pH 5.1) was added for neutralizing, gently mixed by inverting 6~8 times, and incubate on ice for 2 min. Centrifuge the cell lysates at 12000 rpm for 30 min at 4Ԩ. Wash NeucleoBond ion-exchange resin with 5 ml buffer
N2 (100 mM Tris, 15 % ethanol, 900 mM KCl, 0.15 % Triton X-100, adjusted to pH 6.3 with H3PO4) while the lysate centrifuging. After centrifugation, apply the
supernatant to the pre-rinsed resin, followed by washing with 12 ml buffer N3 (100 mM Tris, 15 % ethanol, 1.15 M KCl, adjusted to pH 6.3 with H3PO4) twice. Elute the column with 5 ml buffer N5 (100 mM Tris, 15 % ethanol, 1 M KCl, adjusted to pH
8.5 with H3PO4) and separate the eluted mixture into six fractions equally (~800μl). Precipitate DNA by adding 0.7 volume of isopropanol (about 700 μl) and kept on ice for 10 min. Centrifuge at 13000 rpm for 30 min at 4Ԩ. The DNA pellet was washed
by 1 ml ice-cold 70% ethanol. Discard the ethanol, air-dried, and dissolve with 30 μl DDW. Measure the absorbance at 260 and 280 nm to check the DNA quantity and quality.
3.2.5 rHp hsp60 Protein expression
E. coli [BL21 (DE3)] freshly transformedwith pET-Hp hsp60 were grown onLB plates containing kanamycin (30 mg/ml) at 37°C.After 16 h incubation, 5 colonies grown on the LBplates were picked and inoculated into 100 ml LB medium
containing kanamycin (30 mg/ml) at 37 °C for 16 hr. Refresh the culture broth in 900 ml LB medium with shaking at 37 until the value of OD600 reaches 0.6 (abou℃ t 40 min). Add IPTG from a 800 mM stock to a final concentration of 1 mM and continue the incubation for 4 hr. Harvest the cells by centrifugation at 5000 rpm for 15 min at 4
. Discard the supernatant and resuspend the pellet with 30
℃ ml binding buffer (20
mM Na2HPO4, 0.5 M NaCl, 40 mM imidazole, pH 7.4). Total cell lysates were sonicated with short burst of 1 sec followed by intervals 1 sec and the sonication processing was maintained for 15 min. Centrifuge the solution at 12000 rpm for 30
min at 4 . ℃ Harvest the supernatant. In this experiment, we purified our proteins with HisTrapTM HP column. All the solutions used in this experiment were needed to be filtered with 0.45 μm syringe filter. To prepare the column, wash the column with 5 column volumes of DDW and equilibrate the column with 5 column volume of binding buffer at the flow rate about 1ml/min. Apply the pretreated sample and wash with wash buffer (20 mM Na2HPO4, 0.5 M NaCl, 60 mM imidazole, pH 7.4) about 60 volume. Elute with elution buffer (20 mM Na2HPO4, 0.5 M NaCl, 200 mM imidazole, pH 7.4) for 10 volumes. Detect which fractions contain proteins with coomasie
reagent. Collect the positive fractions and use G25 column to remove the unnecessary salt from the solution and replace the buffer with PBS (Phosphate Buffered Saline, 140 mM NaCl, 2.7 mM KCl, 10 mM Na2HPO4, 1.8 mM KH2PO4, pH 7.4). To prepare the G25 column, we need to swell the 7 g Sephadex G-25 Medium with filtered PBS at room temperature for overnight. Fill the column with PBS. Resuspent the medium and pour the medium into the column. We poured the protein into the G25 column and eluted with PBS. Detect which fractions contain proteins with
coomasie reagent and collect the fractions. Poll the fractions together and filtered with 0.22 μm syringe filter. Check the protein concentration of each part with coomassie
reagent (Figure 2) and dilute the product to the final concentration to 1 mg/ml. The recombinant protein was checked by SDS-PAGE (sodium dodecyl sulfate
polyacrylamide gel electrophoresis) and Western blotting with anti-His conjugate
HRP (Figure 3).
3.2.6 SDS-PAGE and Western blotting
The purified proteins were mixed with 3X protein sample dye and denature at 95 ℃ for 10 min. In our experiment, we used the 10 % acrylamide gel to analysis the
protein size. Each lane was loaded with 10 μl mixture and the electrophoresis was processed with 130 Volt about 80min. the gel were stained with staining buffer for 1 hr and followed by destaining with destain buffer I for 30 min and destain buffer II overnight. For Western blotting, after electrophoresis, the gel was transferred with nitrocellulose paper (NC paper) with 200 mA for 2 hr at room temperature. After transfer, the NC paper was blocked by blocking buffer (5 % skim milk, 0.05 % tween 20 in PBS) at room temperature for 1 hr. Because the recombinant proteins contain histidine tag, we used HRP- conjugated rabbit anti 6X His antibody (1000X dilution) to recognize the recombinant protein. Wash the NC paper with PBST (0.05 % tween 20 in PBS) at room temperature on shake for 5min three times for all washing steps. The membrane was developed with ECL system in dark at room temperature for 5 min and exposed to X ray film for 10 s. Develop the film with developer until band was present and fixed the film with fixer for 1 min. Wash the film with water.
3.2.7 PBMC isolation
Peripheral blood mononuclear cells (PBMCs) were separated from human white blood cell solution by using Ficoll-PaqueTM Plus. Dilute human white blood cells with equal volume of PBS. Add Ficoll-Paque Plus (6 ml) into the 15ml centrifuge tube and carefully load the diluted blood sample (8 ml) on Ficoll-Paque Plus. Centrifuge the tubes at 400 g for 40min at 18 . Remove the ℃ plasma layer and collect the PBMC layer. Wash the cells with 2 volume of PBS for centrifuging at 1500 rpm for 15 min. Discard the supernatant and lyse the red blood cells by ACK buffer (0.15 M NH4Cl, 10 mM KHCO3, 0.1 mM Na2EDTA in DDW) at room temperature for 10 min and followed by centrifuging at 1500 rpm for 10 min. Discard the supernatant and wash the cell with 10 ml PBS. Centrifuge for another 10 min. Discard the supernatant and count the cell number. The purified PBMC were checked by flow cytometry as shown
in Figure 4A.
3.2.8 CD3+ T cell isolation
CD3+ T cells were purified by magnetic bead cell sorting with mouse anti-human CD3 and Goat anti-mouse IgG MicroBead. Magnetic staining buffer (0.5 % BSA, 2 mM EDTA in PBS, pH 7.2) was the only buffer used in this experiment. Count 108
PBMC and suspend in 800 μl staining buffer. Stain the cells with 200 μl mouse anti human CD3 antibody to capture the CD3+ T cells at 4 for 30℃ min. Wash the cells with 5 ml buffer twice. Resuspend the cells with 800 μl buffer and stain the cells with 200 μl Goat anti-mouse IgG MicroBead at 4 for 5℃ min. Wash the cells twice and resuspend in 1 ml buffer. Put the column on the separator and wash the LS column with 3 ml buffer. Load the sample into the column and wash the column with 3 ml buffer for three times. Remove the LS column from the separator and add another 5 ml buffer. Immediately flush out the cells with plunger. Centrifuge the cells at 1500 rpm for 15 min and count the cell number. The purified CD3+ T cells were checked by staining with anti-human CD3 conjugated FITC and analyzed by flow cytometry. Compare with the unstrain cells, the purity of our purified CD3+ T cell is over 99 %
(Figure 4B).
3.2.9 Cell culture
Jurkat is an acute T cell leukemia cell line cultured with RPMI 1640 containing 10 % heat-inactivated FBS, 1 % PSA. The PBMC and CD3+ T cells were cultured with RPMI 1640 containing 10 % heat-inactivated FBS, 1 % PSA, 100 U/ml rhuman IL-2. All the cells were incubated at 37 , 5% CO℃ 2 condition.
3.2.10 MTS assay
To evaluate the growth rate of Hp Hsp60-treated cells, MTS assay was used in this experiment. PBMC (2*105/well), CD3+ T cells (2*105/well) and Jurkat
(2*104/well) were seeded in anti-CD3 mAb-precoated (1 μg/ml, 30 μl per well at 37 for 2
℃ hr.) 96 well and incubated with various doses of Hp Hsp60 (1 μg/ml, 5 μg/ml, and 10 μg/ml). After incubated for 48 hr (Jurkat) and 4 day (PBMC), 40 μl MTS was added into wells and incubated for another 4 hr in 37 . The OD ℃ absorbance was measured at 490 nm with sunrise remote control.
3.2.11 Annexin V-FITC/PI apoptosis assay
To evaluate the survive rate of Hp Hsp60-treated cells, Annexin V-FITC/PI apoptosis detection kit was used in this experiment. PBMC (2*105/well) and CD3+ T cells (2*105/well) were seeded in anti-CD3 mAb-precoated 96 well plate and incubated with various doses of Hp Hsp60 (1 μg/ml, 5 μg/ml, and 10 μg/ml) for 4 day. After 4 day, cells were washed with 1 ml PBS. Each sample was stained with 1μl Annexin V-FITC, 25 ng PI, and suspended in 20 μl staining buffer (10 mM HEPES, 140 mM NaCl, and 2.5 mM CaCl2, pH 7.4) for 15 min at room temperature. Add 800 μl PBS into the mixture and analyze the sample on FACScan in FL1 and FL3 channels with dot plots with quadrant line.
3.2.12 TGF-β cytokine secretion detection
106/ml PBMC and CD3+ T cells were seeding in one well of 24-well plate. PBMC was treated with different doses (100 pg/ml, 1 ng/ml, 10 ng/ml, 100 ng/ml, 1 μg/ml, and 10 μg/ml) of Hp hsp60 for 24 hr. Harvest the supernatant and stock at -80 ℃ refrigerator until the assay beginning. Before assay, we acidified 100 μl sample
with 5 μl 1N HCl for 15 min at room temperature. Next, 5 μl 1N NaOH was added to neutralize the sample. The 96 well ELISA plate was coated with 1000 X coating mAb and incubate at 4℃ for overnight. Remove the coated plate from refrigerator and
allow it to room temperature. Flick out the contents of the wells and slap the plate upside down on a paper towel until the well dry. Add 270 μl 1 X block buffer to each well at 37℃ for 35 min. Wash the plate with PBST five times and flick out the
contents of the wells and slap the plate upside down on a paper towel until the well dry. Add 100 μl standard or sample to each well at room temperature for 2 hr. Repeat wash procedure. Add 100 μl 1000 X anti-TGF-β pAb at room temperature for2 hr. Repeat wash procedure. Add 100 μl 100 X TGF-β-HRP conjugate at room
temperature for 2 hr. Repeat wash procedure. Add 100 μl 1000 X anti-TGF-β pAb at room temperature for 2 hr. Add 100 μl TMB for each well at room temperature for 15 min in the dark. Next, add 100 μl 1 N HCl to stop the reaction and measure the
absorbance at OD 490nm.
3.2.13 Cell surface marker staining
PBMC (106 cells/well) and CD3+ T cells (106 cells/well) were treated with 10 μg/ml Hp Hsp60 and 2 ng/ml TGF-β for 6 days. Centrifuge the cells at 1500 rpm for 10 min. Count the cell number and take 2*105 cells for this experiment. Resuspend the cells with 500 μl staining buffer (1% BSA, 0.05 % NaN3 in PBS). Stain the cells with antibody mixture (2 μl mouse anti-human CD4-FITC and 1 μl mouse anti-human CD25-PE in 500 μl staining buffer (1 % BSA in PBS)) on ice in the dark for 30 min. For compensation, we also stained cells with 2 μl anti-human CD4-FITC and 1 μl mouse anti-human CD25-PE respectively as control. After washing the cells with 500 μl staining buffer, centrifuge the cells at 1500 rpm for 5 min. Repeat again. Analyze the cells on FACScan in FL1 and FL3 channels with dot plots with quadrant line.
3.2.14 RNA isolation
PBMC and CD3+ T cells were seeded with the same condition of the surface marker staining assay. Count the cell number. Take 106 cells and freeze the cell pellet in -80 freezer. In this experiment, we used Trizol reagent for RNA isolation. The ℃ cell pellets were homogennizated by adding 1ml Trizol. Shake violently and incubate
at room temperature for 5 min. Add 0.2 ml chloroform and shake vigorously by hand. Incubate at room temperature for 3 min and 12000 rpm for 15 min at 4 . Transfer ℃ the aqueous phase to a fresh tube, precipitate the RNA from the aqueous phase by mixing with 0.5 ml isopropanol. Incubate the sample at room temperature for 10 min. Centrifuge at 1200 rpm for 10 min and discard the supernatant. Wash the pellet with 1ml 70 % ethanol by vortex and centrifuge at 7500 rpm for 5 min. Discard the supernatant and air-dry for 15 min. Dissolve the pellet with 10 μl DEPC water and incubate at 60 for 10℃ min. Check the RNA quality and quantity by measuring the OD 260 and 280.
3.2.15 Reverse transcription
After quantitating the RNA level, 1 μg RNA from each sample was used for
reverse transcription by using the superscript III RT kit. By following the manufacturer's recommendation, we mix the RNA with 1 μl dNTP, 1 μl random haxamer and DEPC water up to 10 μl. Incubate the sample at 65 for 5℃ min. Then, each sample is added with 2 μl 10X RT buffer, 4 μl 25mM MgCl2, 2 μl 0.1M DTT, 1 μl RT (200 U/μl), and 1μl RNaseOUT (40 U/μl). Incubate the mixture at 25 for 10 ℃ min and followed by 50 , 50 min. To terminate the reaction, incubate the mixture at ℃ 85 for 5 min and chill on ice. To remove the RNA contamination, add 1℃ μl RNase
H to each tube and incubate at 37 for 20 min. The cDNA was ready to use for PCR ℃ and real-time PCR. To monitor whether the reverse transcription was successful, the cDNA were examined with β-actin primers (forward: 5’ TTG GGT ATG GAA TCC TGT GG 3’, backward: 5’ TCG TAC TCC TGC TTG CTG AT 3’). PCR consists of a 94 denaturation step followed by 35 cycles of 45℃ s at 95 , 45℃ s at 50 and 2℃ min at 72 . After these cycles, incubate the PCR mixture at 72℃ ℃for 10 min to complete elongation. The PCR results were checked by agarose gel electrophoresis.
3.2.16 Real-time PCR
After checking the cDNA quality, the foxp3 mRNA level was detected by real-time PCR performed with ABI PRISM 7000. The relative expression of foxp3 mRNA was determined by normalizing expression of each target to β-actin using the primers: human foxp3 forward primer: 5’ ACT GGG GTC TTC TCC CTC AA 3’, human foxp3 backward primer: 5’ CGT GGG AAG GTG CAG AGT AG 3’, human β-actin forward primer: 5’ TTG CCG ACA GGA TGC CAG AA 3’, human β-actin backward primer: 5’ GCC GACT CCA CAC GGA GTA CT 3’. The reaction mixture contained: 1 μl cDNA, 0.25 μl forward primer, 0.25 μl backward primer, 11 μl DDW, and 12.5 μl 2X realQ PCR master mix (with 10 mM MgCl2, Green DNA dye). PCR consists of a 95 denaturation step for 10 min and ℃ followed by 40 cycles of 15 s at
95 , 1 min at 60℃ . The Ct number was gotten by ABI prism 7000 SDS software. ℃ The relative foxp3 gene expression levels were calculated with the followed equation: relative foxp3 mRNA expression level =2^ - [ (the Ct (the cycle of threshold) of foxp3 of sample – the Ct of β-actin of sample) – (the Ct of foxp3 of control – the Ct of β-actin of sample) ].
3.2.17 Statistical analysis
All data are expressed as mean ± SD. Statistical analyses were done by SPSS
statistics software (SPSS Inc., Chicago, IL, USA). In cell proliferation study, PBMC assay were obtained from two independent experiments, CD3+ T cell and Jurkat cells assay were obtained from three independent experiments. In Annexin-V-FITC/PI study, PBMC assay were obtained from two independent experiments, CD3+ T cell and Jurkat cells assay were obtained from three independent experiments. In TGF-β level detection study, PBMC and CD3+ T cell assays were obtained from three independent experiments. In surface marker staining study, PBMC assay were obtained from four independent experiments and CD3+ T cell assay from six independent experiments. In foxp3 mRNA expression study, CD3+ T cell assay was obtained from one independent experiment. All statistical significant was set at p < 0.05.
Chapter 4 Results
4.1 The effect of Hp hsp60 on immune cells.
4.1.1 Hp hsp60 inhibits the proliferation of PBMC and jurkat cells, whereas has no effect on CD3+ T cells.
As mentioned before, we thought that Hp hsp60 might have the immune modulation ability. To test this, we used PBMC and CD3+ T cells as our targets. PBMC were composed of many kinds of immune cells from both innate immunity, which includes monocytes, macrophages, dendritic cells, and NK cells, and adaptive immunity, such as T and B lymphocytes. Because of this feature, we used it to mimic the infection area. T cells were important immune responses. They are responsible for many immune cell activation such as APCs and B cells. Thus, we investigate CD3+ T cells in our model. We also used Jurkat cells as model. Jurkat cells are acute T cell leukemia cells and are usually used for the investigation of T cell signal transduction. To monitor the proliferation of these immune cells, we cultured 2*105/well (106/ml) of PBMC and CD3+ T cells in the anti-CD3 mAb-pre-coading 96 well plate with culture medium (see 3.2.9) for 4 days. Jurkat cells (2*104/well, 105/ml) were cultured in a 96-well plate for 2 days. Each well was added with 40 μl MTS and incubated at 37 ℃ for with 4 hr.
The relative OD490 showed that the proliferation of PBMC was strongly inhibited by Hp hsp60 about 30% compared with the anti-CD3 activated, Hp- hsp60
untreated group, even with the TCR (T cell reception) stimulation (Figure 5). Different concentration of Hp hsp60 (1 μg/ml, 5 μg/ml, and 10 μg/ml) all have this inhibitory effect. In Jurkat cells, the inhibition rate only was 4% and only high dose
(10 μg/ml) has effect (Figure 7). However, high dose Hp hsp60 seemed to have no effect on CD3+ T cells (Figure 6).
4.1.2 Hp hsp60 inhibit the cell proliferation neither by apoptosis nor by necrosis.
Since the cell proliferation induced by TCR stimulation was inhibited by Hp hsp60, we wanted to demonstrate the mechanism of this inhibition. The cell
proliferation inhibition can be divided into two major possibilities: cell cycle arrest and cell death. The cell death is also divided into two possibilities: apoptosis and necrosis. To find out the possibility, we use the Annexin V-FITC/ PI double staining assay. Annexin V is characterized by binding to the translocated PS (phospholipid phosphatidylserine) on the cell membrane which is a feature of early apoptosis. PI is a DNA intercalating agent and a fluorescent molecule. Combine with these two factors, we can determine the cell physiological stage including the apoptosis cells, necrosis
the same culture condition as used in MTS assay.
All the anti-CD3 activated, Hp hsp60 untreated cell group (Figure 9, lane 2) and the activated, Hp hsp60-treated groups (Figure 9, lane3, 4, and 5) exhibited no difference in the cell percentage of apoptosis, necrosis and alive cells. It means that the cell proliferation inhibition might not due to cell death, but cell cycle arrest. On the other hand, in CD3+ T cell experiment, the cell percentage of apoptosis, necrosis
and alive cells in the activated, untreated cell group (Figure 10, lane2) were no difference compared with those in the activated, Hp hsp60-treated groups (Figure 10,
lane3). This result was fit with the result in MTS assay.
4.2 The effect of Hp hsp60 on Treg differentiation
4.2.1 Hp hsp60 increase the percentage of Treg in CD4+ T cells
Since Hp hsp60 inhibits the cell proliferation of PBMC, we wanted to know how Hp hsp60 inhibits the proliferation. As mentioned before, Treg are a powerful immune modulation cells that suppress almost all kinds of immune cells. If Hp hsp60 inhibit the cell proliferation via Terg, the number of Treg should be increase. To clarify this possibility, we cultured 106 cells/ml PBMC and CD3+ T cells with 100 U/ml rHuman IL-2 in anti-CD3 mAb- pre-coaded 24 well plate, respectively. 10 μg/ml Hp hsp60
was used for this experiment. After treatment for 6 days, cell were harvested and stained with anti-human CD4-FITC and anti-human CD25-PE. After detected with cytometry by FL1 and FL2 channels, the cell percentage was analysized as shown in
Figure 11.
In PBMC, Hp hsp60 enhanced the percentage of CD4+CD25+ T cell in CD4+ T
cell under the stimulation of TCR (Figure 12). Although the percentage of
CD4+CD25+ T cell also increased in CD4+ T cell without TCR stimulation, however,
this is no significant that compared with the untreated group (Figure 12). Similar result was happened in CD3+ T cells. Compared with the untreated group, the Hp hsp60 enhanced the percentage of CD4+CD25+ T cell in CD4+ T cell with the help of
TCR stimulation (Figure 13B), however, the increase percentage was not significant when cultured without the present of anti-human CD3 mAb (Figure 13A). Collect these finding together, we found that Hp hsp60 has the ability to increase the number of CD4+CD25+ T cell with the TCR stimulation.
4.2.2 Hp hsp60 induces the foxp3 mRNA expression under the TCR stimulation
Although Treg express both CD4 and CD25 on the surface at the same time, however, CD4+CD25+ T cells do not equal to Treg. In this experiment, we wanted to
confirm that whether these increased CD4+CD25+ T cells were Treg. foxp3 is a key factor for differentiation and suppression function of Treg. Therefore, we used
real-time PCR to detect the mRNA expression level of the foxp3 with the same culture
condition as the experiment in 4.2.1. In Figure 14 B, we found that foxp3 mRNA expression level in activated, Hp hsp60 treated CD3+ T cells could be induced up to 2.5 times compared with the untreated group. However, the phenomenon was not
Chapter 5 Discussion
How does H. pylori inhibit the immune responses that specific to it? As
mentioned in introduction, many reports suggested that virulence factors may play the role to suppress the host immune system. However, these factors all have their own defects to help every strain of H. pylori survive and escape from the immune response [21-25, 28, 30, 50]. Thus, we thought there are some factor else that helps H. pylori inhibit immune responses needs to coincide with three features: i) it presents in every stain, ii) its amino acid sequence is mostly conserved in every strain, and iii) it should exhibit immune suppressive ability. After checking the eight common virulence factors with these three features, Hp hsp60 has the highest homology and is present in every strain. On the other hand, Hp hsp60 also helps H. pylori to adhere and colonize in gastric mucosa [40], which means this protein has posibility to contact with
immune cells. Taken these together, Hp hsp60 has the highest possibility to help H. pylori as long as it has the ability to suppress immune responses.
In this study, we found that after treated with Hp hsp60, the cell proliferation of PBMC was seriously inhibited and Jurkat cells were slightly inhibited. However, the cell proliferation of CD3+ T cell was not affected. This proliferation inhibition might be due to the cell arrest. Besides, the CD4+CD25+ T cells percentage in Hp hsp60
treated PBMC and CD3+ T cells were both increase. These increased CD4+CD25+ T cells were confirmed as Treg by detecting the induction of foxp3 mRNA expression. Taking these finding together, we found that Hp hsp60 has the ability to help H. pylori escape from the immune attacks by increasing the number of Treg which inhibit the proliferation of PBMC. However, there were also some doubtful points in our study.
These controversial results between PBMC and CD3+ T cells might be due to whether the cells had been activated. Because the monoclonal antibody we used in T cell isolation has the ability to activate the T cells. During the T cell purification procession, this antibody might have activated the T cells. This activation can be confirmed by the difference between cells that cultured with or without antibody. The difference in PBMC is about 40%, however, the difference in CD3+ T cells only 17%. Therefore, when cells treated with Hp hsp60, PBMC was inactivated, whereas CD3+ T cells had been activated. Thus, whether the cells have been activated might be the key factor that influences the inhibitory function of Hp hsp60.
In our study, we detected the increased number of Treg after treated with Hp hsp60, but where did the Treg come from? According to the literatures, CD4+CD25+ Treg are arisen from two major sources. Natural CD4+CD25+ Treg were generated in