國立交通大學
土木工程學系碩士班
碩士論文
點振動夯實造成砂土密度及土壓力變化
Variation of Soil Density and Earth Pressure due to
Vibratory Compaction at A Point
研究生 : 許仕達
指導教授 : 方永壽 博士
點振動夯實造成砂土密度及土壓力變化
Variation of Soil Density and Earth Pressure due to
Vibratory Compaction at A Point
研究生:許仕達 Student:Shih-Da Hsu
指導教授:方永壽 博士 Advisor:Dr. Yung-Show Fang
國立交通大學土木工程學系碩士班
碩士論文
A Thesis
Submitted to the Department of Civil Engineering
College of Engineering
0B
National Chiao Tung University
in Partial Fulfillment of the Requirements
for the Degree of
Master of Engineering in
Civil Engineering
September 2007
Hsinchu, Taiwan, Republic of China
中華民國九十六年九月
點振動夯實造成砂土密度及土壓力變化
研究生 : 許仕達 指導教授 : 方永壽 博士
國立交通大學土木工程學系碩士班
摘要
本論文以實驗方法探討點振動夯實造成疏鬆乾砂回填土之地表沉陷、密度變 化及土壓力變化。本研究以氣乾渥太華砂作為回填土,回填土高 1.5 公尺。量測 於鬆砂相對密度(Dr = 34%)表面進行單點振動夯實造成之砂土密度及土壓力變化 。本變研究利用國立交通大學模型擋土牆設備來探討經過 7 秒、20 秒、46 秒、及 123 秒的地表振動夯實對地表沉陷、砂土密度及土壓力造成的變化。依據實驗結 果,本研究獲得以下幾項結論。 1. 在鬆砂的回填土中,土壤內部的垂直與水平土壓力可以分別用σv = γz 與 Jaky 公式估算。 2. 在無凝聚性土壤表面受夯實的受力情況可模擬成方形鋼樁承受振動式打樁機 的貫入模式。在夯實過程中,土層發生地表沉陷,直到樁底的極限承載力 qp 與振動夯實應力σcyc達到平衡。 3. 隨著夯實時間的增加,相對密度等高線(Dr = 36%)會往深處發展,並且土壤內 部之最大相對密度 Dr,max,也會隨著夯實時間的增加而增大。 4. 隨著夯實時間的增加,土體殘餘的最大垂直與最大水平應力變化(夯實後測得 的應力減去初始未夯實測得之應力)也跟著增加。這是因為隨著夯實時間增 加,夯實能量也持續傳遞至土壤內部。 5. 夯實後移走夯實機,土壤內部可測得夯實造成之殘餘應力。最大的垂直應力Δσv位置,隨著夯實時間的增加,此位置會從深度 250 mm 稍微向下移動至 350 mm 的位置。
Variation of Soil Density and Earth Pressure due to
Vibratory Compaction at a Point
Student : Shih-Da Hsu Advisor : Dr. Yung-Show Fang Department of Civil Engineering
National Chiao Tung University
Abstract
This paper studies the surface settlement, change of soil density and earth pressures due to vibratory compaction at a point. Dry Ottawa sand was used as the backfill material. The height of backfill was 1.5 m. The variation of soil density and earth pressure due to the vibratory compaction on the surface of the loose sand (Dr = 34 %) was measured. The instrumented model retaining-wall at National Chiao Tung University was used to investigate the variation of the surface settlement, soil density and earth pressures after 7, 20, 46 and 123 seconds of vibratory compaction. Based on the test results, the following conclusions were drawn.
1. For a loose backfill, the vertical and horizontal earth pressures in the soil mass can be properly estimated with the equation σv = γz and Jaky’s equation, respectively.
2. The compaction of a cohesionless soil with a vibratory compactor can be simulated with the penetration of a square steel pile driven with a vibratory pile hammer. In the compaction process, the soils under the compacting plate settled until the ultimate tip resistance qp and the cyclic compacting stress σcyc reached an
equilibrium.
3. The depth of the relative density contour (Dr = 36 %) increased with increasing time of compaction. The peak relative density in the soil also increased with increasing time of compaction.
2.41, 3.16, 3.32 kN/m2) increased with increasing compaction time. This is because, with increasing compaction time, more compaction energy was transmitted to the soil.
5. After the removal of the compactor, residual stresses in the soil mass were measured due to the vibratory compaction. The point of peak Δσv, as the compaction time increased, moved downward slightly from the depth of 250 mm to the depth of 350 mm.
v
Acknowledgements
The author wishes to give his sincere appreciation to his advisor, Dr. Yung-Show Fang for his enthusiastic advice and continuous encouragement in the past two years. If there is not the guidance from him, the thesis can not be accomplished.
Very special thanks are extended to Dr. Yii-Wen Pan, Dr. Jyh-Jong Liao, Dr. An-Bin Huang, Dr. Shinn-Yu Shann and Dr. Zhi-Ping Lin for their teaching and valuable suggestions. In addition, the author also wants to express his appreciation to the members of his supervisory committee, Dr. Mei-Ling Lin and Dr. Tsang-Jiang Chen for their helpful advice and discussions.
The author is indebted to his classmates for their stimulating suggestions and the donation of their time. Appreciation is extended to Mr. Hao-Chen Chang, Mr. Yu-Lun Chien, Mr. Yung-Cheng Cheng, Mr. Chun-Te Wu, Mr. Sheng-Feng Huang, Mr. Po-Shih Cheng and Miss I-Chen Chiang for their encouragement and assistance.
Table of Contents
Page
Abstract (in Chinese) ………..………... i
Abstract ………..………... iii
Acknowledgements …….………... v
Table of Contents ………... vi
List of Tables ………. ix
List of Figures ………... x
List of Symbols ……….. xiv
Chapter 1 Introduction
………... 11.1 Objectives of Study …..………... 1
1.2 Research Outline ………..………... 2
Chapter 2 Literature Review
……….……….. 42.1 Earth Pressure At-Rest Theory ……..………... 4
2.1.1 Coefficient of Earth Pressure At-Rest ………...………. 4
2.1.2 Jaky’s Formula …..………. 6
2.2 Ultimate Bearing Capacity of Surface Footing ..…..……….. 7
2.3 Density Change due to Compaction …...……….... 8
2.4 Elastic Solution …...………... 8
2.4.1 Boussinesq’s Equations ………...…..……… 8
2.4.2 Holl’s Equations ………...…….……… 9
2.5 Penetration of pile …...………..……….. 10
2.6 Effective of Vibratory Compaction on Earth Pressure ……... 11
2.6.1 Duncan and Seed ……... 12
2.6.2 Study of Peck and Mesri …………..………... 14
Page
Chapter 3 Experimental Apparatus
……….……….. 163.1 Soil Bin ………..…….……….... 16
3.2 Soil Pressure Transducers (SRT) …...………... 17
3.3 Data Acquisition System ………..……...……... 17
3.4 Vibratory Soil Compactor ………... 18
Chapter 4 Backfill Characteristics
…….…………...…….……..….. 194.1 Backfill Properties ………..……….... 19
4.2 Reduction of Wall Friction ………...………...…..……. 20
Chapter 5 Experimental Results for Loose Sand
………..………. 225.1 Control of Soil Density ………..………...……….. 22
5.1.1 Air-Pluviation of Backfill ………...………...…… 22
5.1.2 Uniformity of Soil Density ………...….……… 23
5.2 Stresses in Loose Sand ..……….…………. 23
Chapter 6 Variation of Surface Settlement and Soil Density due
to Compaction
………... 25 6.1 Pilot Tests ………...………..………... 256.2 Surface Settlement due to Compaction ..………. 26
6.3 Density Change due to Compaction ………….……….. 27
Chapter 7 Variation of σ
vdue to Compaction
………...………... 297.1 Distribution of Vertical Earth Pressure after Compaction ….. 29
7.1.1 Testing procedure ………...……… 29
7.1.2 Test result ………...……… 30
7.2 Change of Vertical Earth Pressure due to Compaction ……... 31
Chapter 8 Variation of σ
hdue to Compaction
…...……...………... 328.1 Distribution of Horizontal Earth Pressure after Compaction . 32
8.2 Change of Horizontal Earth Pressure due to Compaction ….. 33
8.3 Mechanism of Soils under Compaction ……….. 34
Page
Reference ……….………... 36
Tables ……….………. 40
Figures ……….…………... 44
Appendix A: Calibration of Soil Pressure Transducer ……….………... 128
Appendix B: Operation of Software Sufer 8 and Grapher 7 and Rlative Density Measured at Grid Points after Compaction ... 141
Appendix C:
Δσ
v Measured at Grid Points after Compaction ... 145List of Tables
No. Page
3.1 Technical information of the Acentric Motor ………. 40 4.1 Properties of Ottawa Sand ……….. 41 6.1 Determination of compaction time for testing with hyperbolic
model ………... 42 6.2 Compaction Time for Testing with Corresponding Settlement of the
Center of Square Compactor ………... 42 6.3 Compaction between the NCTU’s Compaction Tests and
List of Figures
No. Page
1.1 Compaction on the surface of a 1500 mm-thick loose sand …..……. 44 1.2 Compaction of backfill using hand tamper (after Day, 1998) ………. 45 2.1 Development of in-situ stresses (after Chen, 2003) ……… 46 2.2 Principal stresses in soil element (after Chen, 2003) ……….. 47 2.3 Jaky's formulation of the relationship between Ko on OC and φ
mobilized in OAB (after Mesri and Hayat, 1993) ………... 48 2.4 (a) Mode of foundation failure in sand (after Vesic, 1973)
(b) Definition of failure mode (after Vesic, 1973) ………... 49 2.5 Settlement of circular and rectangular plates used to achieve an
ultimate load (Df / B = 0) in sand (after Vesic, 1963) ……….… 50 2.6 Growth curves for a silty clay - relationship between dry unit weight
and number of passes of 84.5 kN three-wheel roller when the soil is compacted in 229 mm loose layers at different moisture contents
(after Johnson and Sallberg, 1960) ………... 51 2.7
V
ibratory compaction of a sand - variation of dry unit weight withnumber of roller passes; thickness of lift = 2.45 m (after D’Appolonia, et al., 1969) ……….. 52 2.8 Principles of vibratory rollers (after Das, 1994) …..………... 53 2.9 Stresses due to a vertical point load in rectangular coordinates (after
Boussinesq, 1883) ……….……….. 54 2.10 Stresses below the corner of a rectangular loaded area …..…………. 55 2.11 Ultimate load-carrying capacity of pile (after Das, 2004) …..……… 56 2.12 Nature of variation of unit point resistance in a homogeneous sand
(after Das, 2004) …..……… 57 2.13 Variation of the maximum values of Nq
*
with soil friction with soil
friction angle φ’(after Meyerhof, 1976) …..……… 58 2.14 Load transfer mechanism for piles at deep foundation in a punching
mode (after Das, 2004) …...………. 59 2.15 Basic components of hysteretic Ko-loading/unloading model (after
Duncan and Seed, 1986) …..……… 60 2.16 Hand-calculation for estimating σh (after Peck and Mesri, 1987) ….. 61
2.17 Distribution of horizontal earth pressure after compaction (after Chen,
2003) …..……….. 62
3.1 NCTU non-yielding soil bin (after Chen, 2003) ………... 63
3.2 Soil-pressure transducer (Kyowa BE-2KCM17) (after Chen, 2003) .. 64
3.3 Data acquisition system (after Wang, 2005) ………... 65
3.4 Acentric motors (Mikasa KJ75) (after Wang, 2005) ………...… 66
3.5 Side-view of vibratory soil compactor (after Chen, 2003) ………..… 67
3.6 Vibratory soil compactor (after Chen, 2003) ………..……… 68
4.1 Grain size distribution of Ottawa sand (after Hou, 2006) …………... 69
4.2 Shear box of direct shear test device (after Wu, 1992) …………... 70
4.3 Relationship between unit weight r and internal angle (after Chang, 2000) …………... 71
4.4 Lubrication layers on four walls …………... 72
4.5 Schematic diagram of sliding block test (after Fang et al., 2004) …... 73
4.6 Sliding block test apparatus (after Fang et al., 2004) …………... 74
4.7 Variation of interface angle with normal stress (after Fang et al., 2004) 75
5.1 Soil hopper ………... 76
5.2 Pluviation of dry sand into soil bin …………... 77
5.3 Relationship between relation density and drop height (after Ho, 1999) 78 5.4 Soil-density cup (after Ho, 1999) …………... 79
5.5 Soil-density cup …………... 80
5.6 Soil density cups buried at the different elevations …………... 81
5.7 Locations of soil density cups at the same elevation …………... 82
5.8 Steps of soil density control test …………... 83
5.9 Distribution of soil density for loose sand …………... 84
5.10 (a) Locations of SPT to measure vertical earth pressure; (b) Locations of SPT to measure horizontal earth pressure …………... 85
5.11 Positioning of soil pressure transducer in the backfill …………... 86
5.12 (a) SPT placed in soil bin to measureσv; (b) SPT placed in soil bin to measure σh …………... 87
5.13 (a) Distributions of vertical earth pressure; (b) Distributions of horizontal earth pressure …………... 88
6.1 Major cross-section of measurement in this study …………... 89
6.2 Measurement of surface settlement …………... 90
6.3 Hyperbolic model to estimate surface settlement S as a function of time of compaction …………... 91
6.4 Variation of surface settlement due to point compaction ………….... 92
6.5
S
urface settlement after due to 123 s of compaction ……….. 936.6 Location of soil density cups in the backfill (side-view) ………….... 94
6.7 Location of soil density cups (top-view) …………... 95
6.8 Relative density measured at grid points after 7 s of point compaction 96
6.9 Distribution of relative density after 7 s of point compaction ………. 97
6.10 Distribution of relative density after 20 s of point compaction ……... 98
6.11 Distribution of relative density after 46 s of point compaction ……... 99
6.12 Distribution of relative density after 123 s of point compaction ……. 100
6.13 Relationship between relative density and compaction time ……….. 101
6.14 Comparison of distribution of soil unit weight after compaction …... 102
7.1 Location of SPT to measure
σ
v under the center of compactor (side view) …………... 1037.2 Distributions of
σ
v under compactor …………... 1047.3 Change of vertical earth pressure under compactor …………... 105
7.4 Location of SPT to measure
Δσ
v (side view) …………... 1067.5 SPT placed in soil bin (top view) …………... 107
7.6 Location of SPT to measure
Δσ
v (top view) …………... 1087.7
Δσ
v after 7 s of point compaction measured at grid points ………… 1097.8 Distribution of
Δσ
v after 7 s of compaction …………... 1107.9 Distribution of
Δσ
v after 20 s of compaction …………... 1117.10 Distribution of
Δσ
v after 46 s of compaction …………... 1127.11 Distribution of
Δσ
v after 123 s of compaction …………... 1137.12 Vertical earth pressure due to the surface Square loading q by Holl’s elastic equation …………... 114
8.1 Location of SPT to measure
σ
h under the center of compactor (side view) …………... 1158.3 Change of horizontal earth pressure under compactor …………... 117
8.4 Location of SPT to measure
Δσ
h (side view) …………... 1188.5 SPT placed in soil bin (top view) …………... 119
8.6 Location of SPT to measure
Δσ
h (top view) …………... 1208.7
Δσ
h after 7 s of point compaction measured at grid points ………… 1218.8 Distribution of
Δσ
h after 7 s of compaction …………... 1228.9 Distribution of
Δσ
h after 20 s of compaction …………... 1238.10 Distribution of
Δσ
h after 46 s of compaction …………... 1248.11 Distribution of
Δσ
h after 123 s of compaction …………... 1258.12 Horizontal earth pressure due to the surface loading q by Holl’s elastic equation …………... 126
8.13 Mechanism of soils under 123 seconds vibratory compaction liked the penetration of pile ……… 127
List of Symbols
Cu = Coefficient of uniformity of soil Dr = Relative density of soil
D10 = Soil particle diameter corresponding to 60% finer D60 = Soil particle diameter corresponding to 10% finer
E = Young’s modulus
emax = Maximum void ratio of soil emin = Minimum void ratio of soil
Gs = Specific gravity of soil
Ko = Coefficient of earth pressure at-rest Ka = Coefficient of active earth pressure Kp = Coefficient of passive earth pressure
t = Compaction time S = Surface settlement z = Depth
φ = Internal friction angle of soil δ = Wall friction angle
δsw = Angle of side wall friction σ = Normal stress
σh = Horizontal earth pressure σv = Vertical earth pressure σcyc = Cyclic normal stress
Δσh = Change of horizontal earth pressure Δσv = Change of vertical earth pressure
γ = Unit weight of soil ν = Poisson’s ratio τ = Shear stress ε = Normal strain
0B
Chapter 1
1B
INTRODUCTION
In this study, the effects of the vibratory compaction on the surface of a cohesionless soil mass are studied. Fig 1.1 shows the vibratory compaction on the surface of a 1500 mm-thick loose sand for this study. To achieve a dense backfill in the field the vibratory compactor is commonly used to densify the backfill. With a horizontal ground level, the geostatic vertical stress σv before compaction can be estimated from its effective overburden pressure σv = γz. The horizontal earth pressure σh before compaction can be estimated from the Jaky’s (1944) equation σh = Koγz. However, after the vibratory compaction, how to estimate the change of soil density due to compaction? How to determine the variation of earth pressure in the backfill due to compaction? In this paper, experiments were conducted with the NCTU model retaining wall facilities to investigate the change of soil density and earth pressures due to vibratory compaction at a point.
1.1 Objectives of Study
In most specifications for earthworks, the contractor is required that the backfill be compacted to 90-95 % of its maximum dry unit weight (γd,max) determined by the Standard Proctor test. Compaction is considered as an artificial densification of an earth mass. It is a particular kind of soil stabilization and one of the oldest methods for improving existing soil or man-placed fills. The objective of the compaction operation is to improve the engineering properties of soil, such as increasing the fill’s bearing capacity or reducing settlement. For granular soils, achieving a relative density of 70-75 % is generally recommended (see the NAVFAC Design Manual) (US Navy, 1982) by vibratory compaction. Therefore, in most cases, the backfill
encountered in the field would be dense soil. As indicated in Fig. 1.2, hand tampers or vibratory compaction equipment are commonly used to densify the backfill.
To analyze the residual lateral earth pressure induced by soil compaction, several methods of analysis have been proposed by Rowe (1954), Broms (1971), Duncan and Seed (1986), Peck and Mesri (1987) and other researchers. Duncan et al. (1991) used the analytical procedures proposed by Duncan and Seed (1986) to develop earth pressure charts and tables that can be used to estimate residual earth pressure due to compaction. However, little information regarding the mechanism of soils under compaction has been reported. This study presents experimental data to investigate the surface settlement, change of soil density, and earth pressures in the soil mass induced by the vibratory compaction. The mechanism of soils under vibratory compaction is proposed. All experiments mentioned in this study were conducted in the National Chiao Tung University (NCTU) retaining wall facility that is described in Chapter 3. The vertical and horizontal stresses in the soil mass were measured with the soil pressure transducers (SPTs) which were embedded in the backfill.
1.2 Research Outline
This research utilizes the NCTU model wall facility to investigate the surface settlement, change of soil density, and earth pressures in the soil mass due to compaction. Previous studies associated with the effects of compaction on soil behavior are summarized in Chapter 2. Details of the NCTU non-yielding model wall system and the vibratory compactor used to densify the backfill are discussed in Chapter 3. Test results regarding the characteristics of the backfill are introduced in Chapter 4. To reduce the effects of the boundary friction, the arrangement of lubrication layers on the four walls are discussed.
In Chapter 5, experiments were conducted to study the distribution of soil density in the loose backfill prepared with air-pluviation method. Test results
regarding the vertical and horizontal stresses in the loose sand are also reported in Chapter 5.
The variation of the surface settlement, change of soil density and earth pressures in the soil mass due to vibratory compaction was studied Chapter 6. Pilot tests were conducted to establish the program of compaction tests. the point compaction time was determined.
After determining the time of compaction, experiments were conducted and the stresses in the soil mass were measured. In Chapter 7, test results associated with the Δσv were reported. In Chapter 8, the test results regarding Δσh due to compaction were reported. Based on the experimental results, the mechanism of the cohesionless backfill subjected to a vibratory compaction was proposed.
Chapter 2
LITERATURE REVIEW
Previous studies regarding the surface settlement, change of soil density, and earth pressures after vibratory compaction are introduced in this chapter. In the field, the vibratory compaction is commonly used to densify the soil mass. However, the effects due to vibratory compaction at a point on the surface of a cohesionless backfill have received little attention in the literature.
2.1 Earth Pressure at-Rest
Donath (1891) was the first to introduce the concept of “the stationary pressure of unlimited ground”. Donath (1891) defined the coefficient of earth pressure K as the ratio of the effective horizontal pressure (σh) to the effective vertical earth pressure (σv) in soil
v h K σ σ = (2.1)
2.1.1 Coefficient of Earth Pressure at-Rest
The coefficient at-rest Ko is refer to the condition where no lateral yielding occurs, under the condition of constrained lateral deformation. As shown in Fig. 2.1(a), the overburden pressure σv compresses the soil element A formed in a horizontal sedimentary deposit. During the formation of the deposit, the element is consolidated under this vertical pressure. The
vertical stress produces a lateral deformation against surrounding soils due to the Poisson’s ratio effect. However, based on the definition and the field observation, over the geological period, the horizontal strain is kept to zero. It is concluded that the surrounding soil resists the lateral deformation with a developed lateral stress σh. A stable stress state will develop in which σh and σv become stresses acting on the vertical and horizontal planes as shown in Fig. 2.1(b). For an isotropic soil element shown in Fig. 2.2, if the soil behaved as an ideal elastic material, based on the mechanics of materials, the lateral strain εy can be expressed as:
) ( x z y y E E σ σ ν σ ε = − + (2.2) or ) ( h v h h E E σ σ ν σ ε = − + (2.3)
where E is the elastic modulus and ν is the Poisson’s ratio of the soil.
Base on the definition of the at-rest condition, the lateral strain would be zero under the application of stress state and the σh= Koσv. Then the Eq. 2.3 can be written as:
0 ) ( 1 − − = = o v o v v h K K E σ ν σ νσ ε (2.4) and the coefficient of earth pressure at-rest Ko:
ν ν − = 1 o K (2.5)
elastic materials only. However, the behavior of soil element is more complex and far from these assumptions. It is evident that the relationship between Ko
and elastic parameter ν of Eq. 2.5 is obsolescent for predicting in-situ horizontal stress.
2.1.2 Jaky’s Formula
Attempts have been made to establish a theoretical relationship between the strength properties of a soil and Ko. The empirical relationship to estimate
Ko of coarse-grained soils is discussed in this section.
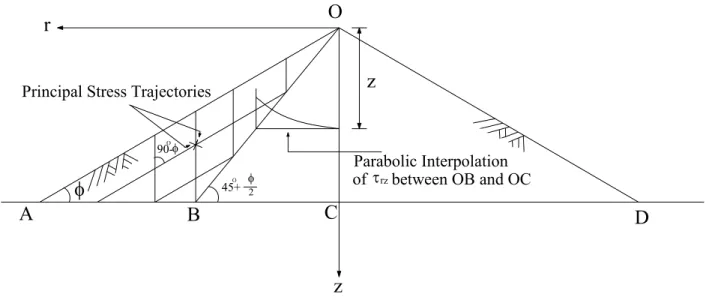
Mesri and Hayat (1993) reported that Jaky (1944) arrived at a relationship between Ko and the angle of internal friction φ by analyzing a talus of
granular soil freestanding at the angle of repose. Jaky (1944) assumed that the angle of repose is equal to the angle of internal friction φ. This assumption is reasonable for sedimented, normally consolidated materials for which the angle of repose is equal to the constant-volume friction angle, φcv (Cornforth, 1973). Darwin (1883) defined the angle of repose as the greatest inclination to the horizon at which a talus will stand. Jaky (1944) reasoned that the sand cone OAD in Fig. 2.3 is in a state of equilibrium and its surface and inner points are motionless. The horizontal pressure acting on OC is the earth pressure at-rest. As OC is a line of symmetry, shear stresses can not develop on it. Hence OC is a principal stress trajectory. Based on the equations of equilibrium, Jaky expressed the coefficient of earth pressure at-rest with the angle of internal friction,
φ φ φ sin 1 sin 3 2 1 ) sin 1 ( + + − = o K (2.6)
Eq. 2.6. φ sin 1− = o K (2.7)
These expressions were the first attempt to relate the coefficient of earth pressure at-rest Ko to the angle of resistance φ of the soil. Eq. 2.7 is still widely used due to its practical significance and attractive simplicity. It should be mentioned that Jaky’s analysis was for a soil with φ φ= cv. Thus, these expressions were suitable for Ko of sedimented, normal consolidated
clays and granular materials that have not been densified by vibration or compaction.
2.2 Ultimate Bearing Capacity of Surface Footing
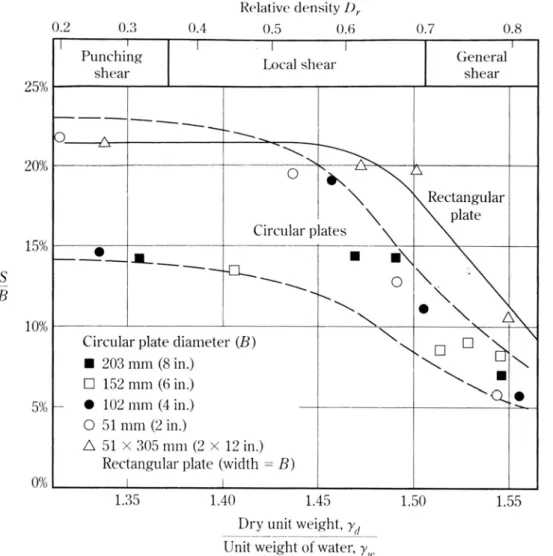
To study the mechanism of soils under vibratory compaction, it is helpful to study the bearing failure of a shallow footing. In Fig. 2.4, Vesic (1973) defined three types of the bearing failure mode with the soil density and the depth of embedment of footing. Typical failure modes of a footing includes: punch shear failure, local shear failure, and general shear failure. If the relative density of backfill is about 34% and the vertical loading was applied on the surface of the backfill (Df = 0). Based on Fig. 2.4, the punching shear failure would occur under the loaded footing.
Vesic (1963) presented the settlement S required for circular and rectangular plates acting on the surface of a sand to reach an ultimate load. Fig. 2.5. indicates a general range of S/B required to reach qult as a function of the relative density of the foundation soil. In general, for foundations on a dense sand, the ultimate load qult would occur at a foundation settlement of 4 ~ 10 % of B. The S/B increases together with the decrease of soil density. In the case of local or punching shear failure, the ultimate load would occur at the settlement of 0.14B ~ 0.23B.
2.3 Density Change due to Compaction
Johnson and Sallberg (1960) proposed that the dry unit weight of soil would be affected by the number of roller passes during compaction. Fig. 2.6 shows the growth curves for a silty clay soil. The dry unit weight of a soil at a given moisture content increases to a certain point with the number of roller passes. Beyond this point, the dry unit weight remains approximately constant. In most cases, about 10 to 15 roller passes yield the maximum dry unit weight economically attainable.
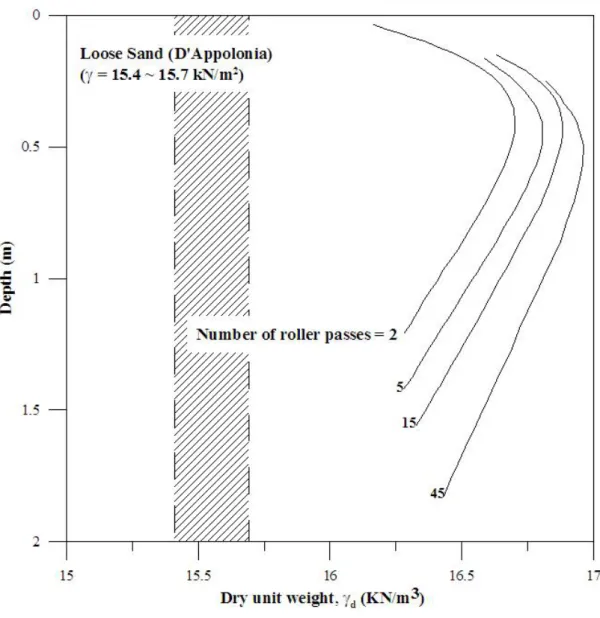
D’Appolonia, et al. (1969) reported that the variation in the unit weight of compaction with depth for a poorly graded sand for which compaction was achieved by a vibratory drum rolleris is as shown in Fig. 2.7. The vibratory drum roller is shown in Fig. 2.8. Vibration was produced by mounting an eccentric weight on a single rotating shaft within the drum cylinder. The weight of the roller used for this compaction was 55.6 kN, and the drum diameter was 1.19 m. The lifts were kept at 2.44 m. In Fig. 2.7 at any given depth, the dry unit weight of compaction increases with the number of roller passes. However, the rate of increase in unit weight of soil gradually decreases after about 15 passes. Another fact from Fig. 2.7 is the distribution of dry unit weight with depth for any given number of roller pass. The dry unit weight and hence the relative density, Dr, reach maximum values at a depth of about 0.5 m and gradually decreases at lesser depths. This decrease occurs because of the lack of confining pressure near the surface of the fill.
2.4 Elastic Solution
Boussinesq (1883) developed theoretical expressions for determining stresses at a point within an "ideal" mass due to a surface point load. The theory was based on the assumptions that the mass is an elastic, isotropic, homogeneous, and semi-infinite medium that extends infinitely in all directions from a level surface. Boussinesq’s equations provide a widely used basis for estimating the stresses within a soil mass caused by a concentrated load applied perpendicularly to the soil surface.
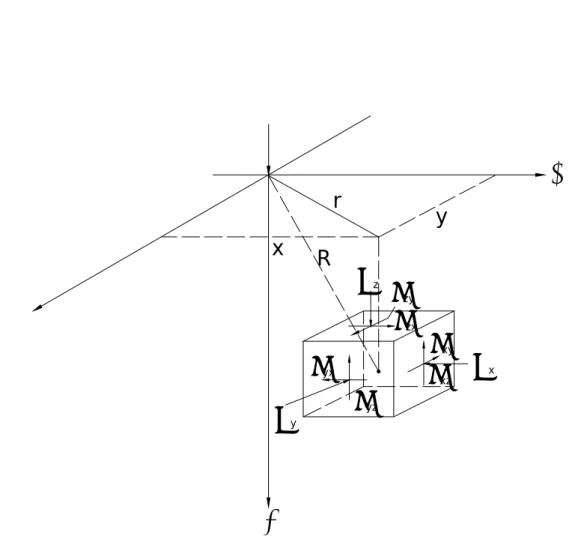
Boussinesq’s equation may be expressed in terms of rectangular coordinates. Referring to the element shown in Fig. 2.9, the two equations to determine the vertical normal stress σz and the horizontal normal stress σ are as follow: x
5 3 2 3 R Qz z π σ = (2.8)
(
)
(
)
(
)
⎪⎭⎪⎬ ⎫ ⎪⎩ ⎪ ⎨ ⎧ ⎥ ⎦ ⎤ ⎢ ⎣ ⎡ − + + − + μ − + π = σ 25 1 23 22 3 3 2 1 2 3 R z z R R x z R z R R R x Q x (2.9) where ratio s Poisson r z R y x r load po Q ' int 2 2 2 2 = + = + = = μ2.4.2 Holl’s Equations
Holl (1940) advanced the integration technique of Boussinesq’s equation for determining stresses at the point A which is beneath the corner of a rectangle rectangular load. Referring to the Point A shown in Fig. 2.10, the two equations to determine the vertical normal stress σz and the horizontal normal stress σx are as follows:
⎥ ⎥ ⎦ ⎤ ⎢ ⎢ ⎣ ⎡ ⎜ ⎜ ⎝ ⎛ ⎟ ⎟ ⎠ ⎞ + + = − 2 2 2 1 3 3 1 1 1 tan 2 R R R LBz zR LB qo z π σ (2.10) ⎥ ⎥ ⎦ ⎤ ⎢ ⎢ ⎣ ⎡ − = − 3 2 1 3 1 tan 2 R R LBz zR LB qo x π σ (2.11) where 2 2 2 3 2 2 2 2 2 1 z B L R z B R z L R area unit per load qo + + = + = + = =
2.5 Penetration of Pile
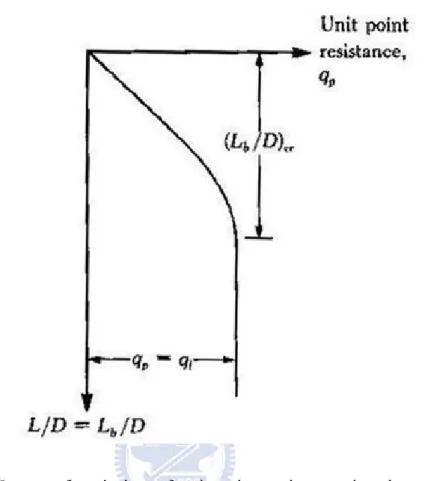
The penetration of a pile into the ground is shown in Fig. 2.11. Fig. 2.12 shows that the unit point resistance qp of a pile in sand generally increases with increasing depth of embedment then reaches a maximum value at an embedment ratio of L/D = (Lb/D)cr. In a homogeneous soil Lb is equal to the actual embedment length of the pile, L (Fig. 2.11). However, where a pile has penetrated into a bearing stratum Lb<L. Beyond the critical embedment ratio, (Lb/D)cr, the value of qp remains constant (qp = ql). That is, as shown in Fig. 2.12 for the case of a homogeneous soil, L = Lb. For piles in sand, c’ = 0, the point bearing of piles is
* ' q p p p p A q A q N Q = = (2.12) where
Qp = point bearing capacity Ap = area of pile tip
c’ = cohesion of the soil supporting the pile tip qp = unit point resistance
Nc*, Nq* = the bearing capacity factors
The variation of Nq* with soil friction angle φ’ is shown in Fig. 2.13. However, Qp should not exceed the limiting value Apql; that is,
l p q p p A q N A q Q = ' *≤ (2.13) The limiting point resistance is
ql =0.5paNq*tanφ' (2.14) where
pa = atmospheric pressure (pa = 100 kN/m2)
φ’= effective soil friction angle of the bearing stratum
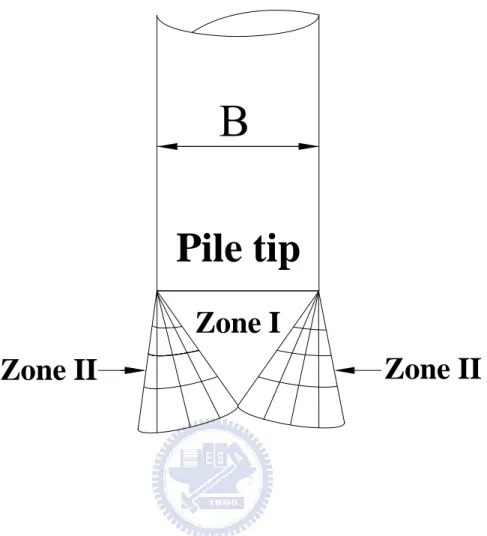
Αt an ultimate load, the failure surface in the soil at the pile tip (a bearing capacity failure caused by Qp) is like that shown in Fig. 2.14. Pile foundations are deep foundations and that the soil fails mostly in a punching mode, as illustrated previously in Fig. 2.4. That is, a triangular zone, I, is developed at the pile tip, which is pushed downward without producing any other visible slip surface. In dense sands and stiff clayey soils, a radial shear zone, II, may partially develop. Hence, the load displacement curves of piles will resemble those shown in Fig. 2.4.
2.6 Effects of Vibratory Compaction on
Earth Pressure
Compaction of soil can produce a stiff, settlement-free and less permeable mass. It is usually accomplished by mechanical means that cause the density of soil to increase. At the same time the air voids are reduced. It has been realized that the compaction of the backfill material has an important effect on the earth pressure.
Some theories introduce the idea that compaction represents a form of overconsolidation, where stresses resulting from a temporary or transient loading condition are retained following removal of this load.
2.6.1 Study of Duncan and Seed
Duncan and Seed (1986) presented an analytical procedure for the calculation of peak and residual compaction-induced stresses either in the free field or acting against vertical non-yielding structures. This procedure employs a hysteretic Ko -loading
model (Fig. 2.15) to track the vertical and lateral stresses for a lift of backfill as it is placed, and as overlying lifts are subsequently placed and compacted. In their model, it is assumed that the effect of compaction could be considered as a cyclic surcharge on the backfill surface. When the surcharge is applied on the soil surface, it will increase the vertical stress and the horizontal stress. In Fig. 2.15, as the virgin loading is applied on the soil, both σv and σh increase along the Ko -line (Ko = 1-sinφ).
However, when the surcharge is removed, σv and σh would decrease along the virgin
unloading path. All unloading is subject to the passive failure limiting conditions. When virgin reloading was applied again, the increment of earth pressure is less than that induced by virgin loading.
The hysteretic model was used to the analysis. Compaction was represented by a transient, moving surficial load of finite lateral extent by directly modeling loading as an increase in vertical effective stress (Δσv). To simulate the compaction loading, a
parameter of the peak virgin, compaction-induced horizontal stress increase (Δσ’h,vc,p)
is defined as the horizontal effective stress which would be induced by the most critical positioning of the compactor. If the soil had been previously uncompacted (that is, the soil had no “lock-in” residual stresses due to previous compaction), Δσ’h,vc,p can be obtained by using the simple elastic analysis. The hysteretic Ko model
described up to this point is a one-dimensional model. But a compactor does not cover the entire backfill surface and the real case is three-dimensional. To account for the three-dimensional effects, an “equivalent peak vertical stress” is applied to represent the compactor in the Ko-model. Compaction loading would be modeled on
which can be calculated as o p vc h p e v K ' , , ' , , σ σ = Δ Δ (2.15)
In this model the peak compaction loading was based on directly calculated lateral stress increase, rather than on the basis of a directly calculated peak vertical stress increase subsequently multiplied by Ko, Ka or some other coefficient. Seed and
Duncan (1983) presented a study and recommendations for the calculation of Δσ’h,vc,p
for various situation. Seed and Duncan (1983) concluded that either in the free field, or at or near vertical, nondeflecting soil/structure interfaces, Δσ’h,vc,p resulting from
surficial compaction loading can be calculated directly by simple elastic analysis. The parameter of Poisson’s ratio, ν for surficial compaction loading was chosen according to the empirically derived relationship
(0.5 ) 2 1 o o ν ν ν = + − (2.16) where o o o K K + = 1 ν and Ko = 1-sinφ
Seed and Duncan (1983) also pointed that based on the observation of field measurements, the loading imposed by a typical vibratory roller can be modeled as approximately two to four times the static weight of the roller. For Δσ’h,vc,p acting at a
vertical, nondeflecting soil-structure interface due to concentrated surficial loading can be taken as twice the value that would be calculated at the same point by closed-form elastic solutions. Unfortunately, as the comments by Seed and Duncan, the hysteretic model is very complex. However, based on the concept, the proposed model may be incorporated in an increment analytical procedure, which can be used to evaluate the earth pressure resulting from the placement and compaction of soil layers.
2.6.2 Study of Peck and Mesri
k and Mesri (1987) presented a calculation method to evaluate the compaction-induced earth pressure. The lateral pressure profile can be determined by four conditions on σ , as illustrated in Fig. 2.16 and summarized in the following.
1. Lateral pressure resulting from the overburden of the com acted backfill, Based on the elastic analysis, Pec
h
p
σh =(1−sinφ)γz (2.17) ailure condition,
= + (2.18)
ing from backfill over stresses,
2. Lateral pressure limited by passive f
z
h φ γ
σ tan2(45 /2)
3. Lateral pressure result burden plus the residual horizontal
h h φ γz σ σ = − +1(5 φ −1)Δ 4 ) sin 1 ( (2.19)
ateral earth pressure increase res
compaction loading of the last backfill lift and can be determined based on the elastic solution.
4. Lateral pressure profile defined by a line which envelops the residual lateral pressures resulting from the compaction of individual backfill lifts. This line can be computed by Eq. 2.20. sin 2 . 1
where Δσh is the l ulted from the surface
γ φ σ φ ) 5 5 ( 4 sin 1− − 1.2sin = Δz (2.20)
Fig. 2.16 indicates that near the surface of backfill, from point a to b, the lateral pressure on the wall is subject to the passive failure condition. From b to c, the overburden and compaction-induced lateral pressure profile is determined by Eq. 2.19.
From c the lateral pressure increases with depth according to Eq. 2.20 until point d is reached. Below d, the overburden pressure exceeds the peak increase in stress by compaction. In the lower part of the backfill, the lateral pressure is directly related to the effective overburden pressure.
2.6.3 Study of Chen
Chen (2003) reported some experiments in non-yielding retaining wall at sity to investigate influence of earth pressure due to vibra
National Chiao Tung Univer
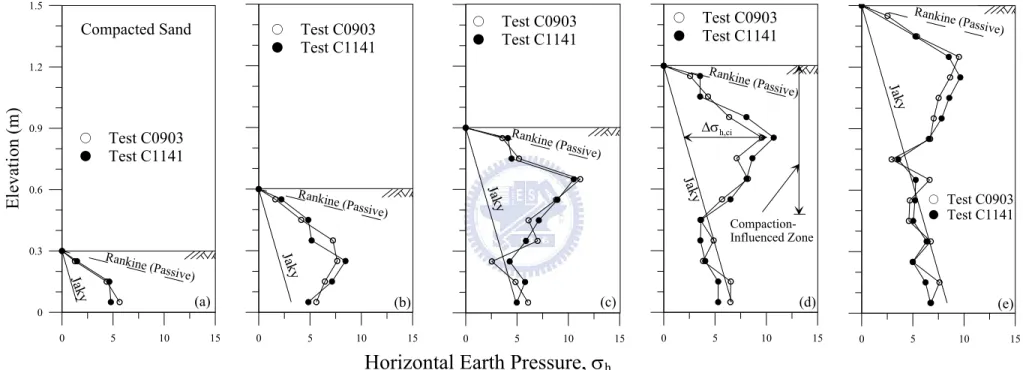
tory compaction. Air-dry Ottawa sand was used as backfill material. Vertical and horizontal stresses in the soil mass were measured in loose and compacted sand. Based on his test results, Chen (2003) proposed three points of view: (1) after compaction, the lateral stress measured near the top of backfill is almost identical to the passive earth pressure estimated with Rankine theory (Fig. 2.17). The compaction-influenced zone rises with rising compaction surface. Below the compaction-influenced zone, the horizontal stresses converge to the earth pressure at-rest, as indicated in Fig. 2.17 (e); (2) when total (static + dynamic) loading due to the vibratory compacting equipment exceeds the bearing capacity of foundation soils, the mechanism of vibratory compaction on soil can be described with the bearing capacity failure of foundation soils; (3) the vibratory compaction on top of the backfill transmits elastic waves through soil elements continuously. For soils below the compaction-influenced zone, soil particles are vibrated. The passive state of stress among particles is disturbed. The horizontal stresses among soil particles readjust under the application of a uniform overburden pressure and constrained lateral deformation, and eventually converge to the at-rest state of stress.
Chapter 3
EXPERIMENTAL APPARATUS
To investigate the effects of vibratory compaction on the vertical and horizontal stresses in a cohesionless soil mass, an instrumented model retaining wall facility at National Chiao Tung University (NCTU) was used. This chapter introduces the NCTU model retaining wall facilities and the vibratory compactor used to densify the loose backfill. The NCTU non-yielding retaining wall facilities consist of three components: (1) the soil bin, (2) soil pressure transducers, and (3) the data acquisition system (Chen and Fang, 2002). The details of the foregoing apparatuses are described in the following sections.
3.1 Soil Bin
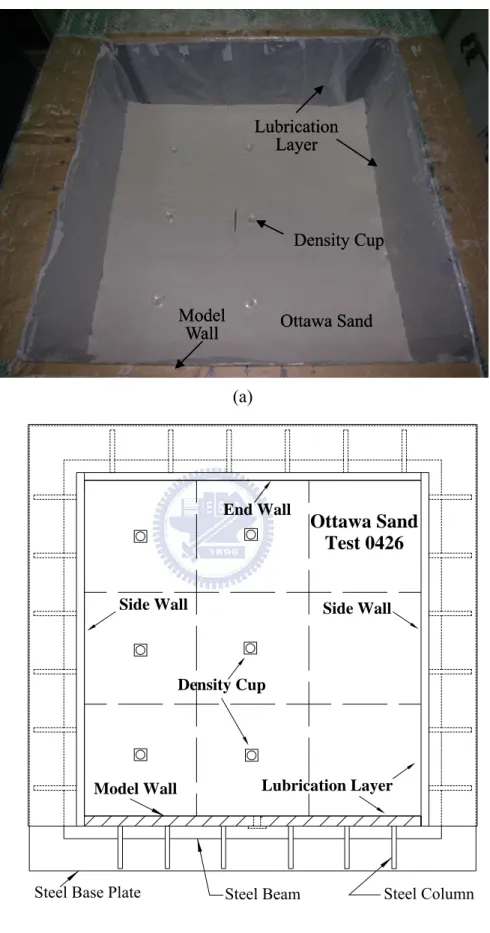
The soil bin was designed to minimize the lateral deflection of the four walls. The soil bin was made of steel plates with inside dimensions of 1500 mm × 1500 mm × 1600 mm as illustrated in Fig. 3.1. The sidewalls and end-wall of the soil bin were made of 35 mm-thick steel plates. Vertical steel columns and horizontal steel beams were used to increase the stiffness of the soil bin. If the soil bin was filled with dense sand, the estimated maximum deflection of the sidewall would be 1.86 × 10⁻³ mm. The bottom of the soil bin was covered with a layer of SAFETY WALK to provide adequate friction between the soil and the base of the bin.
The model wall shown in Fig. 3.1 is 1500 mm-wide, 1600 mm-high, and 45 mm- thick. To achieve an at-rest condition, the wall material should be nearly rigid. As a result, a solid steel plate with a Young’s modulus of 210 GPa was chosen as the wall material. As indicated in Fig. 3.1, the model wall is actually the front-side of the
reinforced steel box. To avoid the lateral deformation of the box, twenty-four 20 mm-thick steel columns were welded vertically on the outside of the box. In addition, twelve C-shaped steel beams were welded horizontally around the box to further increase the stiffness of the box.
Assuming a 1.5 m-thick cohesionless backfill with a unit weight γ = 17.1 kN/m3, and an internal friction angle φ = 41o
was pluviated into the box. The estimated deflection of the model wall would be only 1.22 × 10⁻³ mm. Therefore, it can be concluded that the lateral deformation of the model wall is negligible. From a practical point of view, the model wall, sidewalls, end-wall, and base plate of the soil bin were welded together to reduce flexibility..
3.2 Soil Pressure Transducers (SPT)
To investigate the development of stresses in the backfill, a series of soil pressure transducers (Kyowa BE-2KCM17, capacity = 98.1 kN/m2) were embedded in the cohesionless soil mass. The transducers were used to measure the variation of vertical and horizontal earth pressure after the filling and compaction of the backfill. The soil pressure transducers buried in the backfill were strain-gage-type transducers as shown in Fig. 3.2. The five radial extensions attached to the transducers were used to prevent possible rotation of the transducer due to vibratory compaction. The effective diameter of the transducer was 22 mm and its thickness was 6 mm.
3.3 Data Acquisition System
A data acquisition system was used to collect and store the considerable amount of data generated during the tests. In the Fig. 3.3, the data acquisition system was composed of the following three parts: (1) dynamic strain amplifiers (Kyowa: DPM601A and DPM711B); (2) AD/DA card (NI BNC-2090); and (3) Personal Computer. The analog signals from the sensors were filtered and amplified by the dynamic strain amplifiers (Kyowa DPM601A and DPM711B). Then, the analog test
data were digitized by an A/D-D/A card. Finally, the digital data were transmitted to the personal computer for storage and analysis.
3.4 Vibratory Soil Compactor
To simulate compaction of backfill in the field, a vibratory soil compactor was used. The acentric motor (Mikasa, KJ75-2P) was selected to be the source of vibration. The acentric force generated by the motor could be controlled by adjusting the number of acentric plates attached to the motor as illustrated in Fig. 3.4. Fig. 3.4 shows acentric steel plates were attached to the central rotating shaft of the motor. For this study, sixteen acentric plates (8+8) were used. Detail information regarding the acentric motor was listed in Table 3.1.
The vibratory soil compactor with the base area of 225 mm × 225 mm was illustrated in Fig. 3.5 and Fig. 3.6. The acentric motor was fixed on the steel compaction plate of the compactor. The height of the handle is 1.0 m, and the total mass of the compactor was 12.1 kg (0.119kN). Chen (2003) reported the peck cyclic vertical force (static + dynamic) measured with a load cell placed under the base plate of the vibratory compactor was 1.767kN, and the frequency of vibration was 44 Hz. With the 225 mm × 225 mm compaction plate, the peak cyclic normal stress σcyc applied on the surface of soil was 34.9 kN/m2. It should be mentioned that the distribution of contact pressure between the foundation and the cohesionless soil varies with the stiffness of the footing. If the footing was perfectly rigid, the static contact pressure on the footing increases from zero at the edge to a maximum at the center.
0B
Chapter 4
BACKFILL CHARACTERISTICS
This chapter introduces the properties of backfill. The interface characteristics between the backfill and the walls of soil bin are discussed. The following sections included: (1) backfill properties; (2) reduction of wall friction.
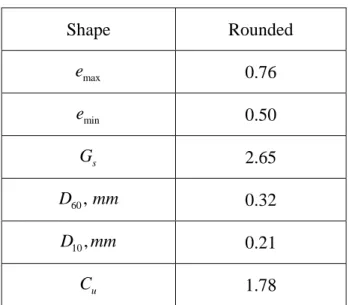
4.1 Backfill Properties
Air-dry Ottawa silica sand (ASTM C-778) was used as the backfill material for all experiments. Physical properties of Ottawa sand are listed in Table 4.1. Grain-size distribution of the backfill is shown in Fig. 4.1. Major factors considered in choosing Ottawa sand as backfill material are summarized as follows.
1. Its round shape, which avoids the effect of angularity of soil grains.
2. Its uniform distribution of grain size (coefficient of uniformity Cu = 1.78), which avoids the effects due to soil gradation.
3. High rigidity of solid grains, which reduces possible disintegration of soil particles under loading.
4. Its high permeability, which allows fast drainage and therefore reduces water pressure behind the wall.
To establish the relationship between unit weight of backfill γ and its internal friction angle φ, direct shear tests were conducted. The shear box used has a square (60 mm × 60 mm) cross-section, and its arrangement is shown in Fig. 4.2. Before shearing, Ottawa sand was air-pluviated into the shear box. Details of the technique to control soil density are discussed in section 5.1.
Chang (2000) established the relationship between the internal friction angle φ and unit weight γ of Ottawa sand as shown in Fig. 4.3. It is obvious from the figure
that soil strength increases with increasing soil density. For the air-pluviated backfill, the empirical relationship between soil unit weight γ and φ angle was formulated as follows
φ = 6.43γ - 68.99 (4.1) where
φ = angle of internal friction of soil (degree) γ = unit weight of soil (kN/m3
)
Eq. (4.1) is applicable for γ = 15.45 ~ 17.4 kN/m3 only.
For compacted backfill, the following relationship can be formulated.
φ = 7.25γ- 79.55 (4.2) Eq. (5.2) is applicable for γ= 15.8 ~ 17.05 kN/m3 only.
4.2 Reduction of Wall Friction
To decrease the boundary effect for earth pressure tests, the shear stress between the backfill and wall should be minimized to nearly frictionless. To reduce the friction between wall and soil, a lubrication fabricated layer with plastic sheets was furnished for all earth pressure experiments. Two types of plastic sheeting, one thick (0.152 mm-thick) and two thin (0.009 mm-thick)plastic sheets, were adopted to reduce the interface friction. All plastic sheets were hung vertically on each sidewall before the backfill was deposited as shown in Fig. 4.4.
Multiple layers of thin plastic sheets (without any lubricant) were used by McElroy (1997) for shaking table tests of geosynthetic reinforced soil (GRS) slopes. Burgess (1999) used three thin plastic sheets to reduce side wall friction in full-scale GRS wall tests. The wall friction angle was approximately 15° as determined by the shear box tests. In this study, two thin and one thick plastic sheets were adopted for the experiments. The friction angle developed between the plastic sheets and steel sidewall was determined by the sliding block test. A schematic diagram and a
photograph of the sliding block test proposed by Fang et al. (2004) are illustrated in Fig. 4.5 and Fig. 4.6. The sidewall friction angle δsw for the sliding block test was determined using basic principles of physics. Fig. 4.7 shows the variation of friction angle δsw as a function of the normal stress σ for the plastic sheet method (1 thick + 2 thin sheeting) used in this study. The measured friction angle with this method was about 7.5°. It is clear in Fig. 4.7 that the interface friction angle δw is nearly
independent of the applied normal stress σ on the interface. This constancy is an important advantage in establishing the input soil properties for analytical models that might be used to analyze the experimental results. For all experiments in this paper, the lubrication layer was applied on four walls as indicated in Fig. 4.4. The plastic sheets not only can help to reduce the friction angle between the wall and the backfill. The plastic sheets can also help to reduce the reflection of elastic waves transmitted to the soil-wall boundaries during compaction.
Chapter 5
EXPERIMENTAL RESULTS FOR
LOOSE SAND
This chapter introduces the distribution of soil density, the horizontal and vertical earth pressure in a loose cohesionless backfill. For all experiments, the surface of backfill was horizontal and the backfill was filled up to 1500 mm above the base of the soil bin.
5.1 Control of Soil Density
5.1.1 Air Pluviation of Backfill
To achieve a uniform soil density in the backfill, Ottawa sand was deposited by air-pluviation method into the soil bin. The air-pluviation method had been widely used to reconstitute laboratory sand specimens. Rad and Tumay (1987) reported that pluviation was the method that provided reasonably homogeneous specimens with a desired relative density. Lo Presti et al. (1992) reported that the pluviation method could be performed for greater specimens in less time. In Fig. 5.1, the soil hopper that lets the sand pass through a calibrated slot opening at the lower end was used for the spreading of sand. Air-pluviation of the Ottawa sand into soil bin is shown in Fig. 5.2.
Das (1994) suggested that the relative density of 15~50 % is defined as a loose condition. Ho (1999) established the relationship among slot opening, drop height, and soil density as shown in Fig. 5.3. The drop height of 1.0 m and hopper slot-opening of 15 mm were selected to achieve the loose backfill (Dr = 34%) for
testing in this study.
5.1.2 Uniformity of Soil Density
To observe the distribution of soil density in the soil bin, measurements were made. The soil density cup made of acrylic is illustrated in Fig. 5.4 and Fig. 5.5. During the preparation of soil specimen, density cups were embedded in the soil mass at different elevations and different locations as shown in Fig. 5.6 and Fig. 5.7. The four steps of the soil density control test for a loose sand are shown in Fig. 5.8 (a) to (d). After the soil had been filled up to 1.5 m from the bottom of the soil bin, the density cups were dug out from the soil mass carefully. Fig. 5.8 (a) shows the density cup was placed in the soil bin and Fig. 5.8 (d) shows the weight of the cup and soil was measured with an electrical scale.Based on the measurements, the distribution of soil density with depth for loose sand is shown in Fig. 5.9. The mean relative density was Dr = 34.1 % with a standard deviation of 2.4%. The test results were in fairly good agreement with the data reported by Chen (2003). The backfill achieved with the air-pluviation method was obviously loose, Dr = 15~50 % as suggested by Das (1994).
5.2 Stresses in Loose Sand
For comparison purposes, at the beginning of this study, experiments were conducted to investigate the stresses in an uncompacted backfill. Fig. 5.10 (a) shows the locations of soil pressure transducers in the soil mass to measure σv. Fig. 5.10 (b)
illustrates the locations of soil pressure transducers in the soil mass to measure σh.
The method to confirm depth of the SPT in the soil mass is shown in Fig. 5.11. After the backfill had been filled up to 1.5 m thick, the vertical earth pressure σv measured
with the SPTs was illustrated in Fig. 5.12 (a). In the figure, the vertical pressure σv
increased linearly with increasing depth. The test data were in fairly good agreement with the σv estimated traditional equation σv = γz, where γ is the unit weight of
backfill. The distribution of horizontal earth pressure σh in the soil mass is shown in
Fig. 5.12 (b). In the figure the horizontal pressure σh profile induced by the 1500
mm-thick loose fill was approximately linear. Jaky’s equation slightly overestimated the horizontal earth pressure. Mayne and Kulhawy (1982), Mesri and Hayat (1993) reported that Jaky’s equation is suitable for backfill in its loosest state. From a practical point of view, it may be concluded that for a loose backfill, the vertical and horizontal earth pressures in the soil mass can be properly estimated with the equation
Chapter 6
VARIATION OF SURFACE
SETTLEMENT AND SOIL DENSITY
DUE TO COMPACTION
This chapter introduces the variation of surface settlement and soil density due to compaction. For all experiments, the height of backfill was 1500 mm and the surface of the backfill was horizontal. Before compaction the backfill was loose and the initial relative density of the loose sand was 34 %. To reduce the friction between the soil and the four walls, the lubrication layers were applied at the side-wall interfaces.
6.1 Pilot Tests
To establish the program for testing, pilot tests were executed.
Fig. 6.1 shows the major cross-section in this study to measure the surface settlement, change of soil density, earth pressures after compaction. The longitudinal axis of the compactor (Fig. 3.4) was be placed forward the model wall or end wall.
Thetestingprocedures of point compaction were introduced as follows:
1. Before compaction, the loose backfill (Dr = 34 %) was fill with the air-pluviation method.
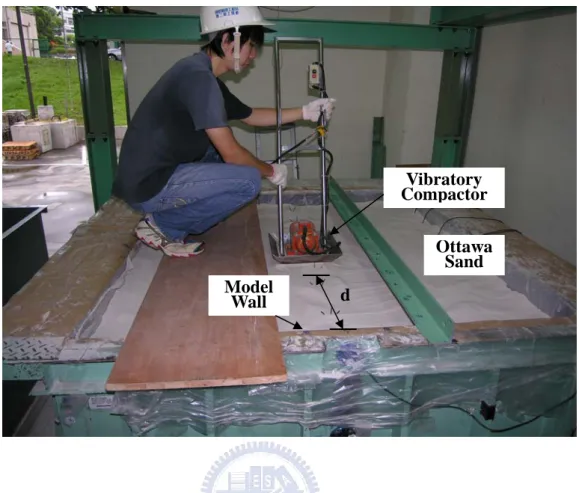
2. After the entire loose backfill had been filled, the vibratory compactor was placed at the center of the soil bin as shown in Fig. 1.1.
3. The soil mass was compacted for 5 seconds first, then remove the compactor and measure the surface settlement profile. Fig. 6.2 illustrates the measurement of surface settlement after the compaction.
4. Compacting the backfill, remove the compactor and measuring the surface settlement at t = 10, 20, 40, 80, 160, 320 and 640 seconds.
Fig. 6.3 shows the measured surface settlement versus the compaction time. In the figure, the surface settlement increased rapidly after first 20 seconds of compaction. As the compaction time increased, the rate of surface settlement increased slowly. Based on the tests data, a hyperbolic relationship function of the surface settlement versus the compaction time can be established as shown in Fig. 6.3. In the figure, the data points obtained from tests 0602, 0604 and 0609 indicated that the test results were quite reproducible. Based on the test results, the hyperbolic model was established to estimate the surface settlement S as a function of compaction time. The relationship can be expressed as:
t t S t 0238 . 0 7348 . 0 ) ( = + (6.1) where S = surface settlement (mm) t = compaction time (s)
The asymptote of the hyperbolic model was Smax = 42 mm. Table 6.1 shows that the Smax was divided into five equal parts and their corresponding compaction time was assumed. The effects of compaction on the fill after 7, 20, 46 and 123 seconds of compaction were discussed in the following sections.
6.2 Surface Settlement due to Compaction
The surface settlements profiles measured after 7, 20, 46, and 123 seconds of compaction were shown in Fig. 6.4. After the 7 seconds of the compaction, the average settlement was approximately 21 mm (Table 6.2). The surface settlement was about 9.3% of the width of the vibratory compactor (S/B = 9.3 %). It is clear in Fig. 6.4 that the amount of surface settlement increased with increasing compaction time.
After 123 seconds of vibratory compaction, the settlement measured was approximately 40.5 mm. The settlement / width ratio has increased to S/B = 18 %. Fig.
6.5 shows the surface settlement after 123 seconds of vibratory compaction.
6.3 Density Change due to Compaction
Before compaction, the loose backfill (34 %) was prepared with the air-pluviation method with the drop height of 1.0 m and a hopper slot-opening of 15 mm. The change of soil density was induced by the vibratory compaction. To investigate the change of soil relative density in the soil bin, many soil density cups were embedded in the backfill to measure the localdensities at different locations. To constitute the contours of density change, density cups were buried closely in the soil mass at different elevations as shown in Fig. 6.6. Fig. 6.7. shows the locations of soil density cups placed at the same elevation. After the desired compaction time, the soil density cups were dug out from the soil mass and their weights measured carefully.
The distribution of relative density after 7 seconds of point compaction is shown in Fig. 6.8. To visually observe the trend of the change of the relative density, the Software Sufer 8.0 was used. By using the Software Surfer 8, the values of Dr at grid points were converted into a Grapher Grid file. The Grapher Grid file included the test data of relative density. Opening the file with the program Software Grapher 7, the contours of the relative density after 7 seconds of compaction can be obtained as illustrated in Fig 6.9. The detail operation of the Software Surfer 8 and Grapher 7 are described in Appendix B. The distribution of relative density after the 20, 46 and 123 seconds of compaction measured at grid points are shown in Appendix B.
Before compaction, the backfill has a uniform relative density of 34 %. In Fig. 6.9, it is obvious that the soil density became quite dense (Dr = 51 %) under the vibratory compactor, and the soil density decreased gradually with the increasing distance from the compactor. Right below the compactor, the relative density increased from 34 % to 51 %, the effects of vibratory compaction on the soil density were quite obvious. As the compaction time increased to 20, 46, and 123 seconds, more compaction energy was transmitted to the soils.
The maximum relative densities measured below the compactor were 51 %, 61 %, 68 %, and 70 %, after 7, 20, 46 and 123 seconds of compaction, respectively. It can also be observed in Fig. 6.9 to Fig 6.12 that the depth of the Dr = 36 % contour increased with increasing time of compaction (see Table 6.2). Fig. 6.13 shows the relationship between dry unit weight and compaction time in this study. The peak relative density in the soil was increased with increasing time of compaction.
Fig. 6.14 shows the comparison of distribution of soil unit weight after compaction. Table 6.3 listed the reason about the difference from the NCTU model wall tests and the field tests.
Chapter 7
VARIATION OF σ
v
DUE TO
COMPACTION
This chapter reports experimental results regarding the variation of the vertical earth pressures in the soil mass due to compaction. The Δσv had been carefully measured with soil pressure transducers embed in the soil mass. The change of vertical earth pressure is defined as the difference of σv measured before and after compaction. The loose (Dr = 34 %) Ottawa sand with the unit weight γ of 15.6 kN/m3 was prepared as the backfill material before compaction.
7.1 Distribution of Vertical Earth Pressure after
Compaction
7.1.1 Testing procedure
The testing procedures to investigate the change of vertical earth pressure, are introduced as follows:
1. Before compaction, the loose backfill (Dr = 34 %) was prepared with the air-pluviation method. With the filling of the Ottawa sand, the SPTs were placed at the desired locations. Fig. 7.1 shows the location of soil pressure transducers (SPT) embedded in the soil mass below the center of the compactor.
2. After the 1.5m-thick loose backfill had been filled, the vibratory compactor was placed at the center of the soil bin as shown in Fig. 1.1.
3. The soil mass was compacted for t = 7 seconds, and then the compactor was removed. In the range of 5 to 10 seconds after the compacter removed, the earth pressure below the compactor was recorded. The σv in the soil mass was monitored by soil pressure transducers placed in the backfill.
4. Repeat step 3 for t = 20s, 46s and 123s.
7.1.2 Test results
Fig. 7.2 shows the distributions of vertical earth pressure under the compactor after compaction. Before compaction, the measured σv increased with increasing depth. The vertical overburden pressure can be properly estimated with the equation σv = γz. In Fig. 7.2 the vertical earth increased after 7 seconds of compaction. Is this Δσv increase a result of γ increase due to compaction? It can be observed in Fig. 7.2 that, as compared with the σv = γz for Dr = 70 %, the Δσv was much greater than the vertical increase due to the increase of γ . At the depth of 100mm, after 123 seconds of compaction, in soil unit weight increased from 15.6 to 16.5 kN/m3.
Fig. 7.3 shows that the extra vertical stress Δσv induced by the 7, 20, 46 and 123 seconds of compaction. It is obvious from the figure that the compaction-influenced zone extended from the compacted surface to the depth of approximately 600 ~ 800 mm. Based on the test results, the zone to measure Δσv was determined.
7.2 Change of Vertical Earth Pressure due to Compaction
To observe the change of vertical earth pressure after compaction. SPTs were buried in the soil mass at different elevations as shown in Fig. 7.4. The location of SPTs placed on the backfill at the same elevation was illustrated in Fig. 7.5 and Fig. 7.6. The of SPT was positioned primarily from the surface to the depth of 600 mm. Based on the measurement of σv and σh in the soil mass, it is hoped that mechanism of soils under compaction could be explored.
spot measured at grid points is shown in Fig. 7.7. The Δσv measured after 20, 46 and 123 seconds of compaction are shown in appendix C. Fig. 7.8, Fig. 7.9, Fig. 7.10 and Fig. 7.11 show the contours of Δσv after 7, 20, 46 and 123 seconds of compaction. In the figures, it is obvious that the peak Δσv (3.60, 3.99, 4.44, 4.96, kN/m2) increased as the compaction time increasing. This is because more compaction energy was transmitted to the soil.
After the removal of the compactor, the residual stress in the soil mass was induced by the vibratory compaction. The point of peak Δσv, as the compaction time increased, has moved downward slightly from the depth of 250 mm to the depth of 350 mm.
To compare with the elastic solution (section 2.4.2), Fig. 7.12 shows the distribution of Δσv in the soil mass due to a surface square loading q. It is obvious in the figure that the influenced zone was nearly 500 mm. In Fig. 7.12, the peak Δσv zone is located right below the surface static loading. However, in Fig. 7.11, the peak residual Δσv zone is located about 350 mm below the vibratory compactor, and the residual Δσv might below the compactor is less than 0.5 kN/m2.
Chapter 8
VARIATION OF σ
h
DUE TO
COMPACTION
This chapter reports experimental results regarding the variation of the horizontal earth pressure due to compaction and the mechanism of soil during compaction. The variation of horizontal earth pressure had been carefully measured with soil pressure transducers embedded in the soil mass. The change of horizontal earth pressure Δσh was defined as the horizontal earth pressure measured before and after compaction. A loose (Dr = 34 %) Ottawa sand with a unit weight γ of 15.6 kN/m3 was prepared as the backfill material before compaction.
8.1 Distribution of Horizontal Earth Pressure after
Compaction
The location of soil pressure transducers (SPT) arranged in the backfill under the compactor is illustrated in Fig. 8.1. The horizontal earth pressure was placed by soil pressure transducers mounted in the soil mass.
Fig. 8.2 shows the distributions of horizontal earth pressure σh under the compactor before and after 7, 20, 46 and 123 seconds of compaction. Test data indicate that before compaction the horizontal earth pressure σh can be approximated with the Jaky’s equation σh = Κογz (Κο = 1-sin φ).
Before compaction, the loose (Dr = 34 %) Ottawa sand has an unit weight γ of 15.6 kN/m3 and the soil friction angle φ = 31°. After compaction, it is clear in the figure that the vibratory compaction results some extra horizontal residual stress. And