行政院國家科學委員會專題研究計畫 期中進度報告
鐵還原反應在污染場址現地自然生物復育中所扮演角色之
探討(2/3)
計畫類別: 個別型計畫 計畫編號: NSC94-2211-E-110-003- 執行期間: 94 年 08 月 01 日至 95 年 07 月 31 日 執行單位: 國立中山大學環境工程研究所 計畫主持人: 高志明 共同主持人: 劉仲康 報告類型: 精簡報告 報告附件: 出席國際會議研究心得報告及發表論文 處理方式: 本計畫可公開查詢中 華 民 國 95 年 6 月 14 日
鐵還原反應在污染場址現地自然生物復育中所扮演角色之探討
計畫編號:94-2211-E-110-003執行期限:2005/08/01 ~ 2006/07/31 主持人:高志明 國立中山大學環工所 教授
Abstract: The availability of Fe(III) for microbial reduction was measured in macrocosms containing contaminated aquifer sediment with benzaldehyde as the organic substrate. Repeated benzaldehyde additions initially resulted in an increase in Fe(II) and decrease in Fe(III). However, after ~400 hours total Fe(II) and Fe(III) stabilized and both ethanol and benzylalcohol began to accumulate, indicating a shift in microbial processes from iron reduction to fermentation. Addition of Fe(III) as amorphous-oxyhydroxide, goethite and hematite to the Fe(III) depleted sediment stimulated ethanol and benzylalcohol degradation. Washing the sediment with CaCl2 and NaAc to remove sorbed and/or precipitated Fe(II) also stimulated ethanol and benzylalcohol degradation indicating that Fe(II) present on the sediment surface was limiting Fe(III) bioavailability. Selective chemical extraction of the sediment with either 0.5 M HCl or oxalate did not provide a useful indicator of the total bioavailable Fe(III).
keywords: Iron, Reduction, Bioavailability Introduction
Fe(III) reduction is an important electron sink in the oxidation of organic contaminants in a wide variety of sedimentary environments (Lovley, 1995; Lovley and Phillips, 1986; Lovley, 1991). Fe(III) is an abundant, if not the most abundant, potential electron acceptor in many soils, aquatic sediments and aquifers (Lovley, 1991). Fe(III) reduction by bacteria has been demonstrated in mineral oxides (Munch and Ottow, 1983; Lovley and Phillips, 1988), and clay minerals (Stucki et al. 1996; Kostka et al. 1996; Ernsten et al. 1998; Gates et al. 1998). However, most of the Fe(III) present in these minerals/environments is thought to be unavailable for microbial reduction (Munch and Ottow, 1983). There are multitude of Fe(III) oxide minerals that vary widely in their degree of crystallinity, particle size, available surface area, reactivity, and oxidation state (Lovley, 1991; Munch and Ottow, 1983). Rates of Fe(III) reductive dissolution of iron oxides appear to be inversely proportional to the degree of crystallinity (hematite < goethite < ferric hydroxide) (Lovley and Phillips, 1986; Lovley, 1991; Munch and Ottow, 1983). The greater bioavailability of the less crystalline forms may be due to their greater surface area (Lovley, 1991; Munch and Ottow, 1983; Lovley and Phillips, 1988). In Fe-rich clay minerals, increase in structural Fe(II) content due to microbial activity is much lower than that obtained by chemical reduced samples (Ernsten et al. 1998). In addition to microbial activity, particle size (fine or coarse clay) and the Fe(II) content of the clay minerals prior to incubation were very important factors affecting the extent of Fe reduction (Ernsten et al. 1998).
Most previous attempts to estimate the amount of bioavailable iron in aquifer sediments were based on the use of selective extractions to determine the most chemically reactive fraction. These included 0.5 N HCl extraction for 1 hr and 24 hrs (Lovley and Phillips, 1987; Heron et al. 1994); oxalate extraction for 4 hrs (Phillips and Lovley, 1987); and Ti(III)-EDTA extraction (Heron et al. 1994). Extraction with 0.5 N HCl for 24 hours dissolves only ferrihydrite and some akageneite; this technique has been reported as a non-quantitative indicator of poorly crystalline Fe(III) in sediment (Heron et al. 1994). Ammonium oxalate has been used to estimate the amount of amorphous or poorly crystalline Fe oxide in soils and sediments and has been suggested as a method for estimating the fraction of bioavailable Fe(III) (Phillips and Lovley,
1986). However, more recent work has shown that Fe(II) can catalyze the dissolution of crystalline oxides by oxalate, resulting in an overestimation of the amount of bioavailable Fe(III) (Heron et al, 1994; Phillips et al. 1993). Since aquifer sediments often contain Fe(II) compounds, ammonium oxalate cannot be used for the determination of poorly crystalline Fe(III) in such systems (Heron et al. 1994). Other workers have estimated bioavailable Fe(III) based on the accumulation of dissolved Fe(II). However, this approach may seriously underestimate Fe(III) availability since much of the Fe(II) produced remains in solid forms (Lovley, 1987 & 1995).
Iron bioavailability could also be limited by coating the mineral surfaces with sorbed or precipitated Fe(II). Most Fe(II) produced in sediments is present in the solid phase adsorbed onto surfaces or in a variety of reduced minerals including magnetite (Fe3O4), siderite (FeCO3) and vivianite (Fe3PO48H2O) (Lovley, 1987, 1991 & 1995). However the effect of sorption and/or precipitation of Fe(II) on Fe(III) bioavailability in sediments is not well understood. In one study, washing an Fe(II) fouled iron oxide with NaAc to remove adsorbed and/or precipitated Fe(II) stimulated Fe(III) reduction (Roden and Zachara, 1996). In a study using a dissimilatory Fe(III)-reducing bacterium, microbial Fe(III) oxide reduction was found to be controlled by sorption of Fe(II) to cell and oxide surfaces (Urrutia et al. 1998).
In this research, several factors potentially limiting Fe(III) bioavailability were evaluated using sediment from a petroleum-contaminated aquifer. Specific objectives of this work were to: (a) determine the amount of Fe(III) in the sediment available for microbial reduction; (b) relate Fe(III) depletion to shifts in microbial processes; (c) evaluate the effect of Fe(II) sorption and/or precipitation on Fe(III) availability; and (d) identify extraction methods that correlate with the amount of Fe(III) that is actually reduced.
Materials and Methods Experimental Design
Sediment and groundwater were obtained from a petroleum-contaminated aquifer at a location where Fe(III) was the predominant electron acceptor. This sediment was characterized using several different extraction methods (0.5 N HCl extraction for 1 and 24 hr.; oxalate extraction for 4 hr., 24 hr., and 7 days, and 5 N HCl extraction for 28 days). Macrocosms containing this sediment were repeatedly fed benzaldehyde and monitored for depletion of Fe(III), production of solid and aqueous phase Fe(II), benzaldehyde degradation and accumulation of degradation intermediates. Benzaldehyde was chosen as the carbon source since it is readily biodegradable and is presumed to be an intermediate in toluene biodegradation via iron reduction (Lovley and Lonergan, 1990). Treatments consisted of three live added carbon, one live-control (no added carbon) and one abiotic (benzaldehyde added) macrocosm.
After approximately 400 hours of incubation, iron reduction slowed and fermentation products began to accumulate. However, a significant amount of Fe(III) still remained in the sediment. Three potential hypotheses were developed to explain the apparent shift from Fe(III) reduction to fermentation: (1) Fe(III) availability was not limiting Fe(III) reduction and some other unknown factor was causing this shift; (2) the mineral surfaces were being fouled by sorption and/or precipitation of Fe(II), reducing the bioavailability of the remaining Fe(III); and (3) the mineral form of the remaining Fe(III) made it relatively unavailable for use by the sediment associated microorganisms.
To evaluate hypotheses 1 and 3, several different Fe(III) forms (amorphous-oxyhydroxide, goethite and hematite) were added to separate microcosm incubations containing the sediment from the initial macrocosms after 700 hours of incubation. To evaluate hypothesis 2, a portion of the sediment was washed with either CaCl2 or NaAc. CaCl2 should remove ion-exchanged
Fe(II) and NaAc should remove both carbonate precipitated and ion-exchanged Fe(II) (Roden and Zachara, 1996; Heron et al. 1994). As these treatments were expected to kill or remove most of the indigenous microbes, the washed sediment was then mixed with unwashed sediment for incubation. Both the mineral addition and sediment washing experiments were monitored for depletion of fermentation products and reduction of Fe(III). In both tests, live treatments were constructed in duplicate and single heat-killed abiotic controls were incubated in parallel for each live treatment.
Macrocosm and Microcosm Construction
The initial macrocosm set was constructed in 1-L bottles containing blended aquifer sediment (1000 g) and groundwater (600 mL). The sediment was collected from below the water table in the contaminated aquifer in sterile coring tubes. Once brought to the surface, cores were immediately capped with sterile butyl rubber stoppers, transported to the laboratory and extruded in an anaerobic glovebox (Ray Products, El Monte, CA) within 24 hours, paring away any sediment that came into contact with the core barrel. Groundwater was collected anaerobically from adjacent wells screened at the same depth as the sediment core. The well headspace was continually sparged with oxygen-free argon during sample collection. Groundwater was pumped from the well through a closed system of polyethylene tubing equipped with a 0.45-m filter (Gelman Sciences, Ann Arbor, MI) and collected in a nitrogen-sparged 2.3-L bottle. The water was transported to the laboratory on ice where it was stored at 4oC prior to use.
Benzaldehyde was repeatedly added to three live and one abiotic macrocosm. One additional live macrocosm was operated with no added carbon to measure the effect of background organic carbon. The abiotic macrocosm was constructed by autoclaving sediment on two consecutive days for 1 hour at 121 oC and 20 psi and adding HgCl2 (0.9 mM). All macrocosms were constructed in an anaerobic glove chamber using aseptic techniques and incubated in the chamber at 25 oC. CO2 was trapped in 2 M NaOH in a separate serum bottle connected to the macrocosm headspace with rubber tubing. Macrocosms were assayed for dissolved organics, Fe (solid and aqueous), CH4 (headspace). Sediment for solid phase Fe analysis was obtained by pushing a hollow glass rod into the sediment, covering the end or the rod (similar to pipetting), and then withdrawing the rod. Triplicate subsamples (3 g) were collected from each bottle using this procedure and blended prior to Fe analysis. Whenever the rubber stopper was opened, the 15-mL headspace in the macrocosms was flushed with oxygen-free N2to eliminate H2that may have entered the macrocosm from the anaerobic chamber.
The iron mineral addition microcosms were constructed in the anaerobic chamber in 160-mL serum bottles consisting of 100 grams of sediment, 100 160-mL of water from selected macrocosms and a 10 mL headspace. Microcosms prepared with sediment from the benzaldehyde amended macrocosm were amended with approximately 540 mol Fe(III)/g. Microcosms prepared with sediment from the no added-carbon macrocosm received approximately 54 mol Fe(III)/g. Fe(III) additions consisted of iron oxyhydroxide, goethite, hematite, live-control (no iron added) and an abiotic. As above, all microcosms were assayed for dissolved organics, Fe (solid and aqueous), CH4(headspace) and CO2.
The sediment washing microcosms were constructed in 60-mL serum bottles containing 20 grams of treated sediment, 20 grams of untreated sediment and 40 mL of liquid. The sediment used to construct these microcosms was obtained from one of the benzaldehyde amended macrocosms that was no longer producing Fe(II). Sediment was washed by mixing 75 g with 0.6 L of anaerobic treatment solution for 24 hours and then washing the treated sediment
with anaerobic deionized (DI). Ion exchanged Fe(II) was removed with 1 M CaCl2 (pH, 7.0) (Kostka et al. 1996) and both ion exchanged and carbonate precipitated Fe(II) were removed with 1 M NaAc (pH, 5.0) (Roden and Zachara, 1996). A third treatment contained sediment washed with DI only as a live control. Each treatment consisted of two live and one abiotic microcosm.
Iron Mineral Forms
Amorphous Fe(III) oxide was prepared by neutralizing a 0.4 M solution of FeCl3 6H2O with NaOH and washing with distilled water (Lovley and Phillips, 1986). Goethite was prepared by neutralizing FeCl24H2O (9.9 g/L) with 1 M NaHCO3(Schwertmann, 1991). X-ray diffraction analysis of freeze dried samples confirmed the mineral identities. Amorphous FeCO3 was prepared by titrating 1 M FeCl2 with 1 M Na2CO3 to pH 7.0 and washing with distilled water. The stoichiometry of the precipitate was confirmed to be FeCO3by Fe(II) and inorganic carbon analysis. Hematite was purchased from Fisher Scientific Co. and siderite was purchased from Ward’sNaturalScienceEstablishment,Inc.(Rochester,NY).Goethiteand hematiteweresieved to a particle size < 100m and siderite was sieved to < 250 m.
Microbial Enumerations
The number of total anaerobes, Fe reducers, and methanogens (H2-utilizers and acetate-utilizers) were determined by Most Probable Number (MPN) assays. Inocula were formed by shaking 10 g of sediment in 90 mL of groundwater and dilution series were formed in groundwater. 1 mL portions of each dilution were inoculated in 9 mL of media. MPNs were calculated using a computer program (Russek and Colwell, 1983).
Total anaerobes were enumerated with a 5 tube MPN assay (Barlaz et al. 1989). Volatile fatty acids and hemin were excluded from the medium and the pH was adjusted to 7. Tubes were scored positive based on elevated optical density after 1 month. Methanogens were enumerated by a 5 tube MPN (Barlaz et al. 1989). Tubes were scored positive if the headspace methane concentration exceeded 0.5% after 2 months.
Fe reducers were enumerated by 10 tube MPN using a medium selective for Fe(III) reducers (Lovley and Phillips, 1986). The tubes were incubated for 2 months after which Fe(II) was measured. For the Fe (II) analysis, 0.5 mL of sample was digested in 5 mL of 0.75 N HCl (anaerobically). 5.5 mL of acetate buffer at pH 5 (Stookey, 1970) containing phenanthroline (1 powder pillow / 25 mL) was then added to the digest and absorbance was read at 510 nm. Tubes were scored as positive if the dissolved Fe(II) exceeded that in uninoculated controls (P = 0.01). All MPN tests were incubated at 25oC.
Analytical Methods
Sediment Fe(II) and Fe(III) concentrations were determined using a 28 day extraction with 5 N HCl based on preliminary work in which Fe(II) and Fe(III) stabilized after 28 days. To quantify Fe(II) and Fe(III), 2g of sediment were digested in 50 mL of HCl (5 N, anaerobic) for 28 days. The acid was first deaerated by boiling under a stream of O2-free N2. In preliminary work, we found that deaeration of the HCl was necessary to prevent oxidation of dissolved Fe(II) to Fe(III). After 28 days, 0.5 mL of the extract was filtered to remove particles greater than 0.2m and added to acetate buffer at pH 5 (Stookey, 1970) containing phenanthroline. As above, the Fe(II) concentration was determined by reading absorbance at 510 nm and comparing to a standard curve. Total iron was determined by adding 1 mL of the filtered extract to 10% hydroxylamine-hydrochloride solution that served as a reductant. After 20 minutes, this
sample was analyzed by the phenanthroline assay. The same procedure was also used for the 1 hr and 24 hr 0.5 N HCl extractions. Fe analysis using oxalate extraction were conducted similarly (Phillips and Lovley, 1987).
Aqueous samples were analyzed for benzaldehyde, benzoate, benzylalcohol, hexanoic acid, caproic acid, butyrate, propionate, acetate and ethanol. Samples were first derivatized with meth-prep I (Altech, Deerfield, IL) to convert the organic acids to the corresponding methyl esters. For 1 mL of sample, approximately 40L of meth-prep I was added together with 3-L of internal standard (heptanoic acid). 1 L of the treated sample was then analyzed by direct aqueous injection using a Shimadzu 9A gas chromatograph (GC) equipped with a flame ionization detector and a DB-624 Megabore capillary column (J & W Scientific, Folsom, CA). The injector temperature was maintained at 250 oC. The oven was initially set at 40 oC for 5 minutes, increased at 15oC per minute to 165oC and then increased at 40 oC per minute to 220 o
C and held for 5 minutes. Compounds were determined by comparison to external standards. The lower detection limit for these compounds ranged from 0.01 to 0.02 mM. Among the organic compounds analyzed in the macrocosms, hexanoic acid, caproic acid, butyrate and propionate were not detected. The identity of organic acids and biodegradation intermediates was periodically confirmed using a GC equipped with a mass selective detector (GCD), (Hewlett Packard G1800A). Methane (headspace) concentrations were determined by GC.
Dissolved inorganic carbon in the CO2 traps was measured by using a Rosemount Dohrmann (DC-190) carbon analyzer (Santa Clara, CA). Total and organic sedimentary carbon was analyzed using the boat sampler attachment. Inorganic carbon was determined as the difference between total carbon and total organic carbon. For total organic carbon (TOC), 1 g samples were air dried (anaerobically), acidified with HCl (1 M) to remove inorganic carbon, and dried at 60oC overnight before analysis. Each sample was run at least three times. In all cases, the standard deviation was less than 20% of the mean.
Results
Sediment Characterization
The sediment used as a microbial inoculum and Fe(III) source in this study was obtained from a petroleum contaminated aquifer. Groundwater at the sediment sampling location contains no measurable dissolved oxygen, low sulfate (< .01 mM), low methane (< 0.1 mM), high dissolved Fe(II) (1.4 to 1.9 mM), and dissolved BTEX (~ 0.07 mM). In incubations with sediment from this location, toluene, o-xylene, m-xylene and benzene anaerobically degraded with Fe(III) as the predominant electron acceptor (Hunt et al. 1994). The number of total anaerobes in the sediment in the current study was low (2.3 x 10² cells/g) with few Fe(III) reducers (13 cells/g) and methanogens (4.4 cells/g). The amount of easily extractable (0.5 N HCl or oxalate) Fe(III) in the sediment varied from 2.8 to 6.0mol/g (Table 1). These values are lower than literature reports of easily extractable Fe(III) at other Fe reducing sites (18-49mol/g (Lovley and Phillips, 1986), 2-18 mol/g (Albrechtsen et al. 1995). However the total amount of Fe(III) present in the sediment was comparable to literature reports, suggesting that the Fe(III) present in the sediment was less reactive. Since the aquifer sediment had been exposed to anaerobic, organic rich water for over 10 years, most of the readily extractable Fe(III) may have been reduced. Pristine sediment collected 50 m outside the contaminant plume contained a slightly higher percentage of Fe(III), indicating that previous exposure to the contaminant plume may have reduced the amount of bioavailable iron. The aquifer material is of marine origin and consists of fine quartz sand (over 94% greater than 0.1 mm) in a clay matrix with minor amounts of pyrite and muscovite
flakes. X-ray diffraction has shown that most of the crystalline iron in the sediment is present as a mixed Fe(II):Fe(III) clay mineral--glauconite, with smaller amounts of the Fe(II) rich clay-berthierine and possibly iron-rich illite (Becker, 1992).
Macrocosm Experiment
Macrocosms were constructed using contaminated aquifer sediment and contaminated groundwater. Ethanol and acetate were present in the sediment and groundwater used to construct the macrocosms and consequently were present in all macrocosms. In the killed control, ethanol, acetate and benzaldehyde did not degrade and both Fe(II) and Fe(III) remained constant over 700 hours of incubation (data not shown).
In the benzaldehyde amended macrocosms, approximately 7 mM benzaldehyde was fed over a 700 hour period by repeatedly respiking whenever benzaldehyde was depleted (Fig. 1). The benzaldehyde uptake rate increased up until ~400 hours and then decreased. Total Fe(II) increased and Fe(III) decreased until about 400 hours after which Fe(II) production was nearly zero and there was no detectable Fe(III) depletion (Fig. 2). More Fe(II) was produced in the benzaldehyde amended macrocosms than in the no-added carbon controls, indicating that benzaldehyde addition stimulated Fe reduction (Fig. 2). Total anaerobes increased by 4 orders of magnitude and Fe reducers increased by 3 orders of magnitude in the benzaldehyde amended macrocosms (Table 2). The large increase in Fe reducers correlates with the large amount of Fe(II) produced. No methane was produced in these macrocosms and the number of methanogens remained below detection.
Acetate increased from about 2 mM to a maximum of ~ 4 mM between 250 and 300 hours and then remained constant or declined slightly (Fig. 1). Ethanol was also present in the benzaldehyde amended macrocosms and decreased from approximately 2.7 mM to 0.2 mM by 100 hours and then remained steady until 250-300 hours. After 300 hours, the ethanol concentration began to increase (Fig. 1). Ethanol production was stimulated by benzaldehyde as a similar increase was not measured in the no carbon-addition macrocosms (Fig. 3)
Benzaldehyde was transformed to benzoate and benzylalcohol (Fig. 1), which were not biodegraded further in the macrocosms. Benzoate is a known intermediate in the anaerobic biodegradation of both naturally occurring and xenobiotic aromatic compounds (Young and Frazer, 1987) and has been shown to degrade under Fe(III) reducing conditions (Lovley et al. 1989). However, A. putrefaciens was unable to couple the oxidation of benzoate to Fe(III) reduction even though it was able to oxidize a multitude of other electron donors (Lovley et al. 1989). In a study examining the fate of hydrocarbon metabolites, benzoate did not degrade when Fe(III) and sulfate were added as electron acceptors, even though iron reduction and sulfate reduction were important processes in situ and occurred in the microcosms (Cozzarelli et al. 1995). However, benzoate did degrade when nitrate was supplied as an electron acceptor. It was concluded that the biogeochemical fate of specific organic acids observed in groundwater varied with the structure of the acid and the availability of electron acceptors (Cozzarelli et al. 1995). Using sediments from the deep terrestrial subsurface (Jones et al. 1989), benzoate only degraded in those sediments that harbored methanogens and persisted in all non-methanogenic samples. Benzoate and acetate disappearance always occurred concomitantly. Therefore, the persistence of benzoate here can be attributed to the unavailability of a specific electron acceptor, non-methanogenic conditions or the absence of the required microorganisms.
Both benzoate and benzylalcohol were produced throughout the 700 hr incubation (Fig. 1). However, the ratio of benzylalcohol to benzoate varied considerably over time (Fig. 1). During the first 150 hours, when ethanol was being depleted, the benzylalcohol to benzoate
ratio dropped steadily, indicating more oxidizing conditions. During this same period, Fe(II) increased and Fe(III) decreased indicating active iron reduction. However, at about 250 to 300 hours, the ethanol concentration began to increase and the benzylalcohol to benzoate ratio began to increase, indicating more reducing conditions. Shortly after this (~400 hours), Fe(II) and Fe(III) stabilized indicating that iron reduction had stopped.
We hypothesize that the increase in benzylalcohol production after 300 hours is due to the accumulation of hydrogen. Hydrogen will be produced during the initial transformation of benzaldehyde to benzoate. During the first 250 to 300 hours, this H2 was consumed via reduction of sedimentary Fe(III). However, once Fe(III) reduction stopped, we hypothesize that hydrogen began to accumulate, causing a shift toward ethanol and benzylalcohol production. Numerous studies have shown that when microbial processes shift from oxidative to fermentative, there is a change in product formation (Reddy et al. 1972; Iannotti et al. 1973).
After 400 hours, sediment from the benzaldehyde amended macrocosms was analyzed to determine changes in Fe(II) and Fe(III) (Table 1). Total Fe(II) (aqueous plus 28-day extraction of sediment with 5.0 N HCl) increased by 7.0mol/g (0.75) of sediment while sediment Fe(III) decreased by 5.1 mol/g (0.07). Assuming ethanol and benzaldehyde were oxidized to acetate and benzoate, 5.2 mol/g of iron should have been reduced. The close match between predicted and observed iron reduction indicates that Fe(III) was the primary electron acceptor in this system. However, it is not clear why Fe(III) reduction stopped after 400 hours.
Over the 400 hour period of active iron reduction, between 5.1 and 7.0 mol/g of iron were reduced. This compares reasonably well with the amount of readily extractable Fe(III) present in the original sediment (2.8 –6.0 mol/g; Table 1) and suggests that all the easily extractable Fe(III) could have been reduced. However, a significant fraction of the 0.5 N HCl extractable Fe(III) and over 85% of the original 5.0 N extractable Fe(III) was still present in the sediment, suggesting that some other factor was limiting Fe(III) bioavailability.
Of the total Fe(II) produced in the incubations, 32% was in the aqueous phase and 68% was sorbed or precipitated on the solid phase. The form of the solid phase Fe(II) was not known. However equilibrium calculations using MINTEQA2 (Allison et al. 1991) indicated that the aqueous phase was supersaturated with siderite (FeCO3).
To provide some indication of the chemical composition of the solid phase Fe(II), sediment samples were extracted for 24 hours using anaerobic solutions of CaCl2(1 M, pH 7.0) and sodium acetate (1 M, pH 5.0). The CaCl2solution was intended to extract material that ion exchanged onto clays and recovered 2.9 mol Fe(II)/g sediment. The NaAc solution was intended to extract both ion exchanged and amorphous carbonate minerals and recovered 4.8 mol Fe(II)/g. In separate analyses, the sediment inorganic carbon was found to increase by 2.8 mol/g (Note: increase in inorganic carbon was detected on the solid phase but not in the aqueous phase). These results indicate that approximately 60% (2.9 mol/g) of the Fe(II) is ion exchanged onto the sediment with the remaining fraction present as a carbonate mineral with the same stoichiometry as siderite (FeCO3). We hypothesized that the FeCO3 was present in an amorphous form since previous reports indicated that NaAc at pH 5 does not extract siderite (Kostka et al. 1996). Preliminary work in our laboratory confirmed that NaAc does not extract ground siderite (<250 m). However, extraction of freshly prepared amorphous FeCO3 for 24 hours with anaerobic CaCl2(1 M, pH 7.0) and NaAc (1 M, pH 5.0) recovered 7% and 82% of the total Fe(II), respectively. This indicates that a substantial portion of the solid phase Fe(II) generated in the benzaldehyde amended incubations was present in a NaAc extractable form of FeCO3.
In the live-control (no-carbon addition) macrocosm, the ethanol concentration dropped from 2.5 mM to less than 0.2 mM and acetate increased from 2 mM to 5 mM by 400 hours (Fig. 3). Over this same period, total (solid + aqueous) Fe(II) increased from 10.7 mol/g to 13.3 mol/g sediment (Fig. 2). During the first 100 hours, aqueous Fe(II) increased from 1.1 mM to 2 mM while solid Fe(II) remained fairly constant. However from 100 to 400 hours, solid phase Fe(II) increased along with aqueous Fe(II).
We hypothesize that ethanol was fermented to acetate in these macrocosms by the following reaction.
CH3CH2OH (ethanol) + H2O CH3COO-(acetate) + H++ 2 H2 (1) The cause of the acetate accumulation in these macrocosms (benzaldehyde amended and live-control) is not known but may be related to the low pH of the sediment (~5.9), the low initial number of methanogens and/or benzoate toxicity. Acetate is an important substrate for methanogenic and iron reducing bacteria in anoxic environments and is known to be a major precursor of methane in sediments (Jones et al. 1989). However, other workers have noted acetate accumulations in aquifer sediments. In incubations of unamended sediment slurries, acetate accumulated over time (Jones et al. 1989) and elevated acetate concentrations have been reported for several contaminated aquifers (Cozzarelli et al. 1994; McMohan et al. 1995). In a study evaluating factors influencing methanogenesis in an anoxic aquifer (Beeman and Suflita, 1990), methanogenesis was severely inhibited at pH values < 7, suggesting that acetoclastic methanogenesis may have been inhibited by the low pH here.
In follow-up incubations of sediment from the no-added carbon macrocosms, acetate was degraded and methane accumulated. However, methane was never produced and acetate never degraded in sediment from the benzaldehyde amended macrocosms. The high benzoate concentrations in sediment from these macrocosms (> 7 mM) may also have inhibited methanogenic activity. At pH 7, total benzoate concentrations greater than 40 mM (equivalent to 0.04 mM benzoic acid) over a 100 hour period reduced methane production by over 50% in anaerobic granules adapted to methanogenic conditions (Fang et al. 1997). In the benzaldehyde amended incubations, the sediment was exposed to greater than 0.1 mM benzoic acid for over two months.
Over the first 400 hours, the ethanol concentration declined by 2.3 mM while acetate increased by approximately 3.0 mM. The somewhat greater than stoichiometric acetate production could be due to degradation of background organic carbon, release of sorbed acetate from the solid phase and/or minor analytical errors. Fe(III) reduction is believed to be the primary terminal electron acceptor in the no added carbon microcosms since: (1) oxygen, nitrate and sulfate were below detection; and (2) Fe(II) produced during the first 400 hours was equivalent to 62% of the measured ethanol depletion in equation 1. Lower than expected Fe(II) production may be due to loss of H2from the macrocosm headspace during sampling. In the no added carbon macrocosms, total anaerobes and Fe reducers increased by two orders of magnitude with Fe reducers continuing to be the dominant population (Table 2).
Addition of Iron Mineral Forms
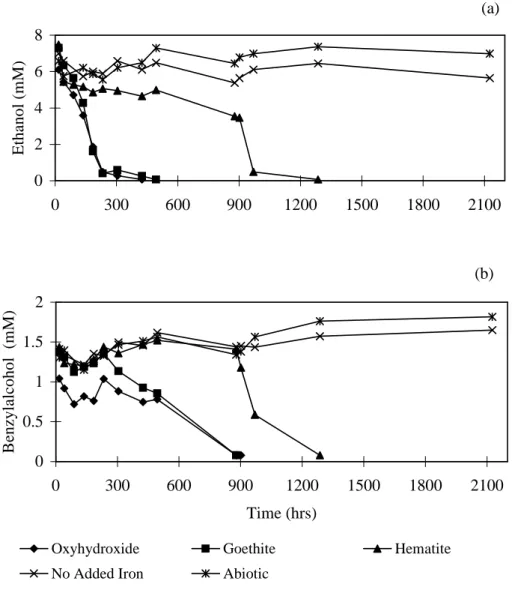
Separate microcosms were constructed using sediment and water from the benzaldehyde amended macrocosms. The microcosms were amended with different iron mineral forms to determine if an added electron acceptor could shift the microbial activity away from fermentation and back to Fe reduction. Ethanol and benzylalcohol degraded in all the iron treated microcosms, albeit at different rates, but did not degrade in microcosms without added iron (Fig. 4). This indicates that the observed shift from iron reduction to fermentation was due to depletion
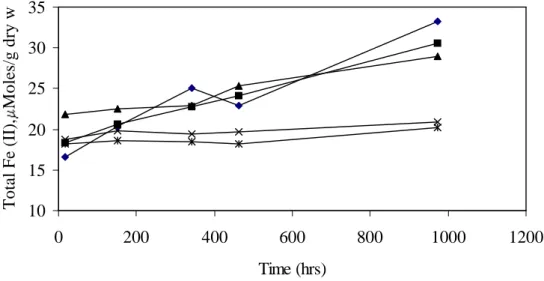
of bioavailable iron. Ethanol concentrations in iron oxyhydroxide and goethite treated microcosms dropped to < 0.01 mM in 300 and 400 hours respectively, while benzylalcohol concentrations dropped to < 0.01 mM after 800 hours. Ethanol and benzylalcohol did not degrade in the hematite treated microcosms until 1200 hours. Fe(II) concentrations increased in all the iron treated microcosms (Fig. 5). The largest increase in Fe(II) was in the iron oxyhydroxide and goethite treated microcosms followed by the hematite treated microcosm. Fe(II) increase in iron oxyhydroxide, goethite and hematite treatments were 16.6, 12.2 and 7.0 mol/g respectively. These results are consistent with previous reports that Fe(III) present in the more highly crystalline mineral forms is less bioavailable (Lovley and Phillips, 1986; Lovley, 1987). In the live-control microcosm (no iron added) and abiotic microcosm, Fe(II) concentrations increased slightly.
In the microcosms constructed with benzaldehyde amended sediment, acetate and benzoate did not degrade even in the presence of the added iron minerals, indicating that acetate and benzoate degradation is not limited by iron bioavailability.
Effect of Solid Phase Fe(II) on Fe(III) Reduction
Results of the iron addition experiments demonstrated that Fe(III) availability was limiting iron reduction, causing an accumulation of reduced fermentation products. However, it was not known whether the Fe(III) still present in the sediment was in a mineral form that was not available to the iron reducers or if coating of the sediment surfaces by Fe(II) had reduced the Fe(III) availability. To evaluate this, sediment from the benzaldehyde amended macrocosms was washed with either CaCl2 or NaAc. This sediment was then blended 50:50 with unwashed sediment and used to construct microcosms.
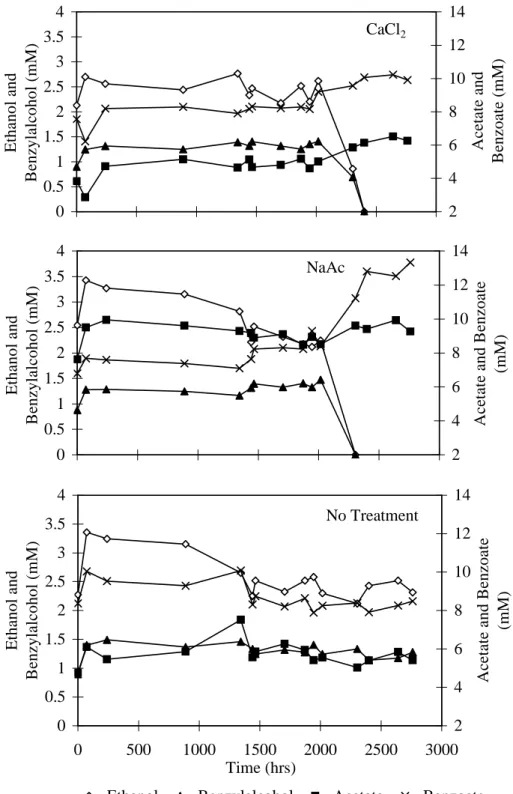
After approximately 1500 hours incubation, there was no evidence of enhanced iron reduction in any incubation. At that time, amorphous iron oxyhydroxide (545mol/g sediment) was added to one replicate from each treatment. The iron addition stimulated iron reduction, resulting in complete degradation of ethanol and benzylalcohol within 600 hours (Fig. 6).
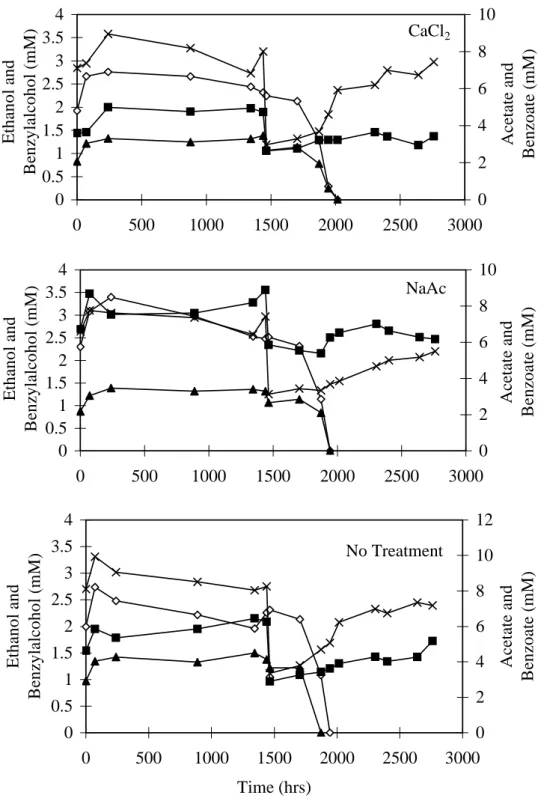
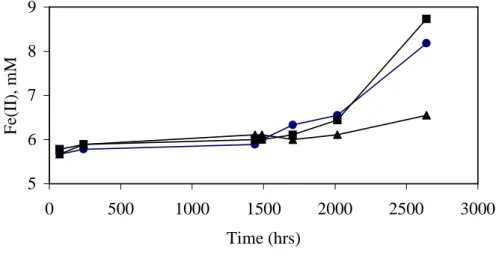
In the microcosms containing CaCl2 and NaAc treated sediment that did not receive added iron, ethanol and benzylalcohol degradation started after approximately 2000 hours (Fig. 7) and iron reduction resumed (Fig. 8). The long lag time prior the resumption of iron reduction is potentially due to three factors. First, the number of active iron reducers was probably greatly reduced by holding the sediment without bioavailable Fe(III) for > 2000 hours prior to the start of these incubations. Second, biosorption of Fe(II) may have reduced the rate and capacity for iron reduction (Roden and Zachara, 1996). Third, the remaining Fe(III) was probably in a mineral form that was less available to the microorganisms. In the Fe(III) addition experiments, the lag period prior to ethanol and benzylalcohol biodegradation was significantly longer for the hematite treatment than for the oxyhydroxide and goethite treatments, indicating that the iron mineral form may influence the lag period prior to resumption of Fe reduction.
In the abiotic treatments, all monitored parameters remained constant throughout the course of the experiment (data not shown). No methane was produced in any of the sediment washing incubations.
The enhanced biodegradation of ethanol and benzylalcohol and increased Fe(II) production in the CaCl2and NaAc washed sediment indicates that iron reduction was limited by coating of the mineral surfaces; not because the Fe(III) was in a form that was not available to the iron reducers. These results should not be surprising given that iron reduction was stimulated by the addition of the highly crystalline iron oxide, hematite. Although re-initiation of Fe(III) reduction was expected in NaAc microcosm, the mechanism for enhancing Fe(III) reduction
in CaCl2 microcosm is less clear. Theoretically, washing the sediment with CaCl2 should only substitute Fe(II) with Ca(II) on surface hydroxyl groups or surface-coating phase on the mineral. However minor, this substitution clearly enhanced iron reduction.
Discussion
In the macrocosms, ethanol and benzylalcohol began to accumulate when iron reduction slowed due to a decline in Fe(III) bioavailability. Calculations of the free energy yield indicates that ethanol should begin to accumulate at a H2concentration of 8M. Shifts in microbial processes from iron reduction to methanogenesis have been reported to occur in the range of 0.2 to 2 nM (Lovley et al. 1994; Vroblesky et al. 1997). Therefore, accumulation of ethanol suggests the absence of methanogenic conditions and serves as a geochemical signature indicating depletion of bioavailable iron in this system.
One surprising observation was the high concentration of ethanol present in groundwater at the start of our incubations. To our knowledge, ethanol accumulations in contaminated groundwater have not been previously reported. In ongoing work in another petroleum contaminated aquifer, high ethanol concentrations (~ 2.8 mM) was measured in microcosms (unpublished data). The high ethanol concentrations present in the groundwater suggest that iron reduction in the aquifer is limited by Fe(III) bioavailability. However when the macrocosms were constructed with groundwater and aquifer sediment, ethanol was rapidly degraded via iron reduction. We hypothesize that the rapid ethanol degradation observed in the macrocosms was due to sediment mixing during the initial macrocosm construction. In the aquifer, soil agglomerations could reduce Fe(III) availability. However when the macrocosms were constructed, these soil agglomerations would be physically disrupted, exposing fresh mineral surfaces and enhancing microbial access to the Fe(III) surfaces.
Acetate is known to be readily utilized under Fe(III) reducing conditions but accumulated in this study. In a study conducted to investigate the ability of A. putrefaciens to couple the oxidation of potential donors to the reduction of Fe(III), it was observed that A. putrefaciens could couple the oxidation of various electron donors to Fe(III) reduction, yet acetate produced from lactate and pyruvate oxidation was not metabolized further (Lovley et al. 1989). The presence of acetate in contaminated aquifers has been reported (Cozzarelli et al. 1994; McMohan et al. 1995). In aquifers contaminated with crude oil and gasoline, acetate concentrations were 0.002 mM (Cozzarelli et al. 1994). However at a creosote contaminated aquifer, aliphatic acids had accumulated (> 0.6 mM) and acetate (0.5 mM) was the major intermediate of creosote degradation under methanogenic conditions (McMohan et al. 1995). At a petroleum hydrocarbon contaminated aquifer near Hanahan, South Carolina, acetate concentrations were between 3 and 7 mM at six of nine locations sampled (McMohan et al. 1995). In comparison, acetate concentrations were between 2 to 3 mM in the benzaldehyde fed macrocosms. High acetate concentrations may persist because of the depletion of other electron acceptors and the low pH which inhibits methanogenesis.
In many aquifers, Fe(III) is potentially one of the most important electron acceptors for contaminant biodegradation. However there are no reliable methods for assessing the amount of bioavailable Fe(III) and the extent of iron reduction that is actually occurring. Over the course of the initial macrocosms incubations and follow-up sediment washing incubations, approximately 13mol/g of Fe(II) were produced or approximately 37% of the total Fe(III) originally present. Prior to the start of these incubations, selective chemical extraction of the sediment with 0.5 N HCl and oxalate for different time periods had generated estimates of the total bioavailable Fe(III) that varied between 2.8 and 6.0 mol/g. Clearly these selective extraction techniques underestimated the amount of Fe(III) that was actually bioavailable. Even in the initial macrocosm experiments, Fe(II) production exceeded the Fe(III) extracted with 0.5 N HCl or oxalate.
contaminated aquifers is to compare aqueous Fe(II) concentrations in contaminated and uncontaminated portions of the aquifer. Using this approach, the significance of iron reduction at 25 natural attenuation sites was evaluated and Fe(III) reduction was dominant at only 2 sites, while sulfate reduction and methanogenesis were dominant at the 23 remaining sites (Weidemeier et al. 1995). However in a landfill leachate polluted aquifer (Heron and Christensen, 1995), over 98% of the Fe(II) produced was not dissolved. In our system, over 68% of Fe(II) produced accumulated on solid phase. This Fe(II) was present as an ion exchangeable phase and as a NaAc extractable material consistent with FeCO3. Fe(II) precipitation has been reported in several different organic contaminated aquifers (Heron et al. 1994; Baedecker et al. 1992). These results further suggest that using only aqueous measurements of Fe(II) may significantly underestimate the extent of iron reduction.
At present, the significance of Fe(II) coating of iron oxide surfaces is poorly understood. In our work, ion exchanged and precipitated Fe(II) on the mineral surfaces reduced Fe(III) availability, resulting in an accumulation of reduced fermentation products. In a related study (Roden and Zachara, 1996), over 90% of the Fe(II) produced by a dissimilatory Fe(III) oxide-reducing bacterium was either incorporated as an adsorption complex or as a precipitate on the Fe(III) oxide surface. Iron reduction slowed after approximately 2.7% of the available Fe(III) was reduced; however, washing the iron oxide with NaAc re-initiated Fe(III) reduction. In a different study, Fe(II) sorption on oxide and cell surfaces, together with Fe(II) complexation by or precipitation with medium components, all influenced the rate and extent of Fe(III) reduction (Urrutia et al. 1998).
It is not clear whether Fe(II) coating is an important limitation on iron bioavailability in contaminated aquifers since other factors including advective flushing may limit Fe(II) precipitation. Analysis of pristine and contaminated aquifer sediment at the site showed some depletion of Fe(III) in the contaminated zone but no detectable increase in Fe(II) (Borden et al. 1994). At the Vejen landfill in Denmark, decades of exposure to leachate resulted in complete depletion of iron oxides originally present in the methanogenic zone immediately downgradient of the landfill (0.5 N HCl extraction for 24 hrs was less than 1.8mol/g) (Heron and Christensen, 1995). This occurred even though the groundwater was saturated with siderite and pyrite was precipitating near the landfill (Heron et al. 1994).
References
Albrechtsen, H. -J.,Heron,G.,and Christensen,T.H.(1995).“Limiting factorsformicrobial Fe(III) - reduction in a landfill leachate polluted aquifer (Vejen, Denmark).” FEMS Microbiol. Ecol. 16, 233-248.
Allison, J. D., Brown, S., and Novo-Gradac. (1991).“MINTEQA2/PRODEAF2:A geochemical
assessmentmodelforenvironmentalsystems,user’smanual,”EPA/600/3-91/021, Athens,
Georgia.
Baedecker,M.J.,Cozzarelli,I.M.,Evans,J.R.,and Hearn,P.P.(1992).“Authigenicmineral formation in aquifers rich in organic material”. Proc., 7th International Symposium on Water-Rock Interaction. A. A. Balkema, eds., 257-261.
Barlaz,M.A.,Schaefer,D.M.,and Ham,R.K.(1989).“Bacterialpopulation developmentand chemical characteristics of refuse decomposition in a simulated sanitary landfill”. Appl. Environ. Microbiol. 55, 55-65.
Becker, M. T. (1992). “Iron Reduction in a Gasoline-Contaminated Aquifer Containing Glauconite,”MS thesis,Dept.ofCivilEngg.,North CarolinaStateUniversity,Raleigh. Beeman, R. E.,and Suflita,J.M.(1990).“Environmentalfactorsinfluencing methanogenesisin
ashallow anoxicaquifer:A field and laboratory study.”J. Industrial. Microbiol. 5, 45-58.
Borden,R.C.,Gomez,C.,and Becker,M.T.(1994).“NaturalBioremediation ofa Gasoline Spill,Hydrocarbon Bioremediation”,R.E.Hinchee,B.C.Alleman,R.E.Hoeppel,and R.N. Miller, eds., Lewis Pub., Boca Raton, FL, pp. 290-295.
Cozzarelli,I.M.,Herman,J.S.,and Baedecker,M.J.(1995).“Fateofmicrobialmetabolitesof hydrocarbons in a coastal plain aquifer: The role of electron acceptors.” Environ. Sci. Technol. 29, 458-469.
Cozzarelli, I. M., Baedecker, M. J., Eganhouse, R. P., and Goerlitz, D. F. (1994). “The geochemical evolution of low-molecular-weight organic acids derived from degradation of petroleum contaminantsin groundwater”.Geochimica et Cosmochima Acta. 58, 863-877. Ernsten,V.,Gates,W.P.,and Stucki,J.W.(1998).“Microbialreduction ofstructuraliron in
clays-A renewable source of reduction capacity.”J. Environ. Qual. 27, 761-766.
Fang,H.H.,Lau,I.W.C.,and Chung,D.W.C.(1997).“Inhibition ofmethanogenicactivity of starch-degrading granulesby aromaticpollutants.”Wat. Sci. Tech. 35, 247-253.
Gates, W. P., Jaunet, A-M., Tessier, D., Cole, M. A., Wilkinson, H. T., and Stucki, J. W. (1998). “Swelling and textureofiron-bearing smectitesreduced by bacteria.”Clays Clay Miner. 46, 487-497.
Heron,G.,and Christensen,T.H.(1995).“Impactofsediment-bound iron on redox buffering in
a landfillleachatepolluted aquifer(Vejen,Denmark).”Environ. Sci. Technol. 29, 187-192.
Heron,G.,Christensen,T.H.,and Tjell,J.C.(1994).“Oxidation capacity ofaquifersediments.” Environ. Sci. Technol. 28, 153-158.
Heron, G., Crouzet, C., Bourg,A.C.M.,and Christensen,T.H.(1994).“Speciation ofFe(II)and
Fe(III)in contaminated aquifersedimentsusing chemicalextraction techniques.”Environ.
Sci. Technol. 28, 1698-1705.
Iannotti, E. L., Kafkewitz, D., Wolin, M. J., Bryant, M. P. (1973). “Glucose fermentation products of Ruminococcus albus grown in continuous culture with Vibrio succinogenes: Changes caused by interspecies transfer of H2.”J. of Bacteriol. 114, 1231-1240.
deep terrestrialsubsurface.”Geomicrobiol. J. 7, 117-130.
Kostka,J.M.,Nealson,K.H.,Wu,J.,Stucki,J.W.(1996).“Reduction ofstructuralFe(III)in smectite by a pure culture of Shewanella putrefaciens strain MR-1.”Clays Clay Miner. 44, 522-529.
Lovley, D. R. (1987). “Organic matter mineralization with the reduction of ferric iron: A
review.”Geomicrobiol. J. 5, 375-399.
Lovley,D.R.(1991).“Dissimilatory Fe(III)and Mn(IV)reduction.”Microbiol. Rev. 55, 259-287.
Lovley,D.R.(1995).“Microbialreduction ofiron,manganese,and othermetals.”Adv. Argon. 54, 175-231.
Lovley, D. R., Baedecker, M. J., Lonergan, D. J., Cozzarelli, I. M., Phillips, E. J. P., and Siegel, D. I. (1989). “Oxidation of aromatic contaminants coupled to microbial iron reduction.” Nature, 339, 297-299.
Lovley,D.R.,Chapelle,F.H.,and Woodward,J.C.(1994).“Useofdissolved H2concentrations to determinedistribution ofmicrobially catalyzed redox reactionsin anoxicgroundwater.” Environ. Sci. Technol. 28, 1205-1210.
Lovley,D.R.,and Lonergan,D.J.(1990).“Anaerobicoxidation oftoluene,phenol,and p-cresol by the dissimilatory iron-reducing organism, GS-15.”Appl. Environ. Microbiol. 56, 1858-1864.
Lovley, D. R., and Phillips, E.J.P.(1986).“Organicmattermineralization with reduction of
ferriciron in anaerobicsediments.”Appl. Environ. Microbiol. 51, 683-689.
Lovley, D. R., Phillips, E. J. P. (1987). “Competitive mechanisms for inhibition of sulfate reduction and methane production in thezoneofferriciron reduction in sediments.”Appl. Environ. Microbiol. 53, 2636-2641.
Lovley, D. R., and Phillips, E. J. P. (1988). “Novel mode of microbial energy metabolism: Organic carbon oxidation coupled to dissimilatory reduction ofiron and manganese.”Appl. Environ. Microbiol. 54, 1472-1480.
Lovley,D.R.,Phillips,E.J.P.,and Lonergan,D.J.(1989).“Hydrogen and formateoxidation coupled to dissimilatory reduction of iron and manganese by Alteromonas putrefaciens.” Appl. Environ. Microbiol. 55, 700-706.
McMohan, P.B., Vroblesky, D. A., Bradley, P. M., Chapelle, F. H., and Gullett, C. D. (1995). “Evidence for enhanced mineral dissolution in organic acid-rich shallow groundwater.” Groundwater. 33, 207-216.
Munch, J. C., and Ottow,J.C.G.(1983).“Reductivetransformation mechanism offerricoxides
in hydromorphicsoils.”Environ. Biogeochem. Ecol. Bull. 35, 383-394.
Phillips,E.J.,and Lovley,D.R.(1987).“Determination ofFe(II)and Fe(III)in oxalateextracts of sediment.”Soil Sci. Soc. Am. J. 51, 938-941.
Phillips,E.J.,Lovley,D.R.,and Roden,E.(1993).“Composition ofnon-microbially reducible
Fe(III)in aquaticsediments.”Appl. Environ. Microbiol. 59, 2727-2729.
Reddy, C. A., Bryant, M. P., and Wolin, M. J.(1972).“CharacteristicsofS organism isolated
from Methanobacillusomelianskii.”J. of Bacteriol. 109, 513-514.
Roden,E.E.,and Zachara,J.M.(1996).“Microbialreduction ofcrystallineiron (III)oxides: Influence of oxide surface area and potentialforcellgrowth.”Environ. Sci. Technol. 30, 1618-1628.
Russek,E.,and Colwell,R.R.(1983).“Computation ofmostprobablenumbers.”Appl. Environ. Microbiol. 45, 1646-1650.
Schwertmann, U. (1991). “Iron oxides in the laboratory: preparation and characterization.” Weinheim, New York, VCH.
Stookey,L.L.(1970).“Ferrozine- A new spectrophotometricreagentforiron.”Anal. Chem. 42, 779-781.
Stucki,J.W.,Bailey,G.W.,and Gan,H.(1996).“Oxidation-reduction mechanisms in iron-bearing phyllosilicates.”Appl. Clay Sci. 10, 417-430.
Urrutia,M.M.,Roden E.E.,Fredrickson J.K.,and ZacharaJ.M.(1998).“Microbialand surface chemistry controls on reduction of synthetic Fe(III) oxide minerals by the dissimilatory iron-reducing bacterium Shewanellaalga.”Geomicrobiology J. 15, 269-291.
Vroblesky,D.A.,Bradley,P.M.,and Chapelle,F.H.(1997).“Lack ofcorrelation between organic acid concentrations and predominant electron-accepting processes in a contaminated
aquifer.”Environ. Sci. Technol. 31, 1416-1418.
Wiedemeier,T.H.,Miller,R.N.,Wilson,J.T.,and Kampbell,D.H.(1995).“Significanceof anaerobic processes for the intrinsic bioremediation of fuel hydrocarbons.” National Groundwater Association. Proceedings of the petroleum hydrocarbons and organic chemicals in Groundwater Conference. November. Houston, Texas.
Young,L.Y.,and Frazer,A.C.(1987).“Thefateoflignin and lignin-derived compounds in
anaerobicenvironments.”Geomicrobiol. J. 5, 261-293.
LIST OF TABLES
Table 1. Extractable Fe Present in Contaminated and Pristine Sediment (mol/g dry sediment).
Table 2. Distribution of Microbial Populations During Macrocosm Experiment (cells/g dry wt. of sediment).
LIST OF FIGURES
Fig.1. Variations in benzaldehyde, benzoate, benzylalcohol, ethanol and acetate in benzaldehyde amended (live) macrocosms over time. (a) The rate of benzaldehyde depletion appears to slow after 400 hours. (b) Ethanol is initially depleted under iron reducing conditions. However, ethanol accumulates after 300 hours when iron reduction slows. (c) Both benzoate and benzylalcohol were produced throughout the incubation period. However, the rate of benzylalcohol production increases after 250 to 300 hours. (d) The increase in the benzylalcohol production rate after 300 hours causes the ratio of benzylalcohol to benzoate to increase after 300 hours. Error bars represent standard deviation of triplicate live macrocosms.
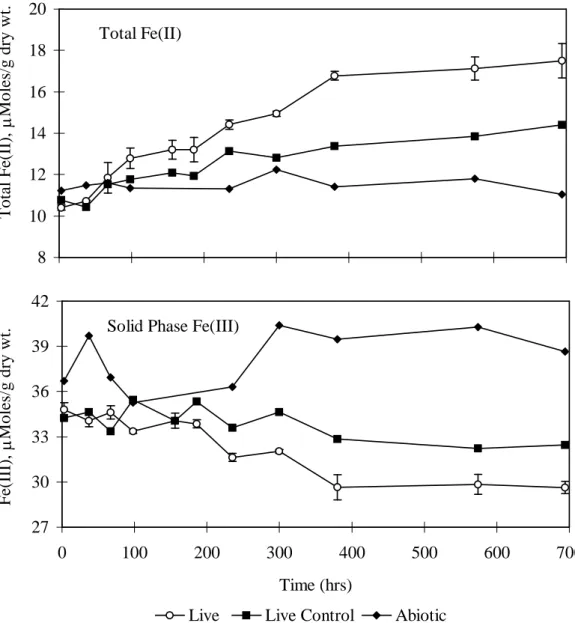
Fig. 2. Variations in total Fe(II) and solid phase Fe(III) in benzaldehyde amended (live), no added carbon (live control) and abiotic macrocosms over time. Total Fe(II) is the sum of aqueous plus solid phase measurements. In the abiotic macrocosms there was no significant change in Fe(II) or Fe(III) over time. However in the no added carbon macrocosms there was a measurable increase in Fe(II) and decrease in Fe(III) apparently associated with the biotransformation of ethanol present in the groundwater. Error bars represent standard deviation of triplicate live macrocosms.
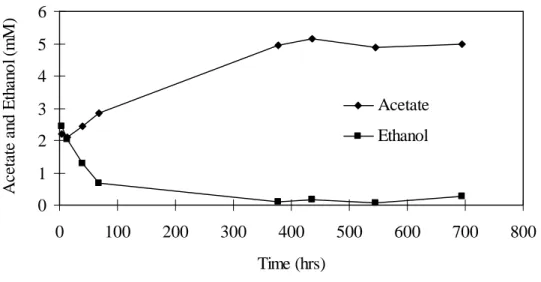
Fig. 3. Variation in aqueous ethanol and acetate in no-carbon added macrocosms. Both ethanol and acetate were present in the groundwater used to construct the macrocosms.
Fe(III) depleted sediment: (a) ethanol; (b) benzylalcohol.
Fig. 5. Variations in total Fe(II) in Fe(III) amended microcosms. Total Fe(II) is the sum of aqueous plus solid phase measurements.
Fig. 6. Variation in organic compounds over time in washed sediment microcosms spiked with iron oxyhydroxide at 1500 hours. Ethanol and benzylalcohol degradation resumed after Fe(III) addition indicating iron availability was limiting.
Fig. 7. Variation in organic compounds over time in washed sediment microcosms. Ethanol and benzylalcohol were depleted after 2100 hours in CaCl2 and NaAc washed sediment but persisted in untreated sediment.
Fig. 8. Variation in aqueous Fe(II) concentrations in washed sediment microcosms. Fe(II)
increased in CaCl2 and NaAc treated microcosms but did not increase in the untreated microcosm.
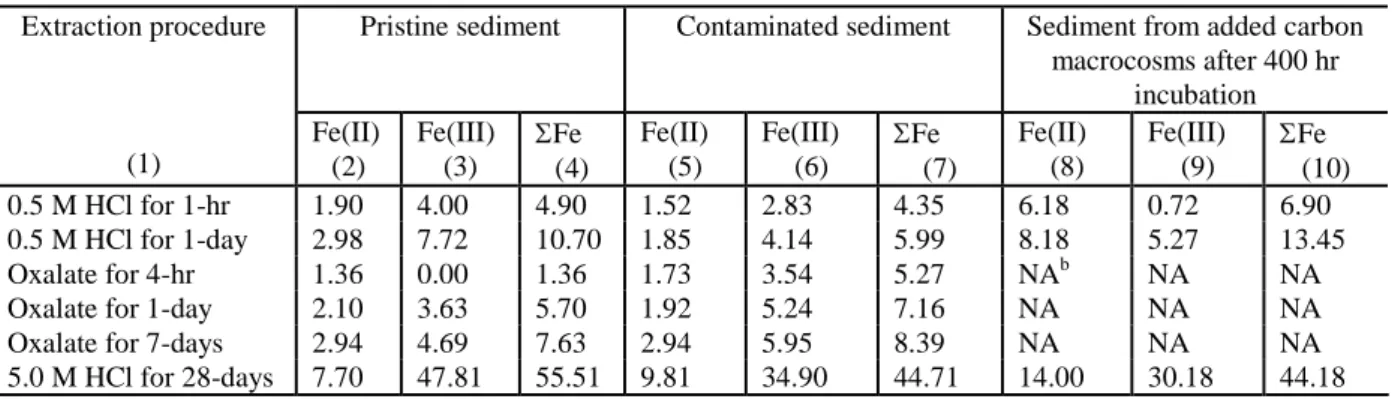
Table 1. Extractable Fe Present in Contaminated and Pristine Sediment (mol/g dry sediment)a.
Pristine sediment Contaminated sediment Sediment from added carbon macrocosms after 400 hr incubation Extraction procedure (1) Fe(II) (2) Fe(III) (3) Fe (4) Fe(II) (5) Fe(III) (6) Fe (7) Fe(II) (8) Fe(III) (9) Fe (10) 0.5 M HCl for 1-hr 1.90 4.00 4.90 1.52 2.83 4.35 6.18 0.72 6.90 0.5 M HCl for 1-day 2.98 7.72 10.70 1.85 4.14 5.99 8.18 5.27 13.45 Oxalate for 4-hr 1.36 0.00 1.36 1.73 3.54 5.27 NAb NA NA Oxalate for 1-day 2.10 3.63 5.70 1.92 5.24 7.16 NA NA NA Oxalate for 7-days 2.94 4.69 7.63 2.94 5.95 8.39 NA NA NA 5.0 M HCl for 28-days 7.70 47.81 55.51 9.81 34.90 44.71 14.00 30.18 44.18 a
Contaminated sediment was used in all incubations. b
NA –Not Applicable. Results of oxalate extractions at 400 hours are not representative since Fe(II) produced during incubation has been reported to catalyze the extraction of Fe(III) (Lovley, 1987).
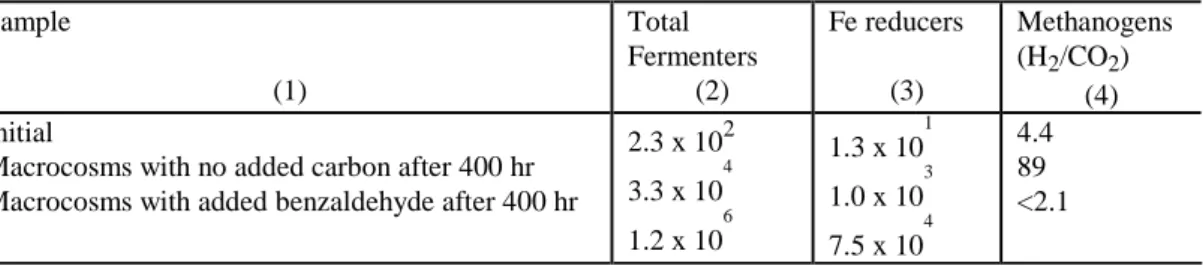
Table 2. Distribution of Microbial Populations During Macrocosm Experiment (cells/g dry wt. of sediment). Sample (1) Total Fermenters (2) Fe reducers (3) Methanogens (H2/CO2) (4) Initial
Macrocosms with no added carbon after 400 hr Macrocosms with added benzaldehyde after 400 hr
2.3 x 10² 3.3 x 10 4 1.2 x 10 6 1.3 x 10 1 1.0 x 10 3 7.5 x 10 4 4.4 89 <2.1
(c) 0 0.2 0.4 0.6 0.8 1 1.2 1.4 B e n z y la lc o h o l (m M ) 0 2 4 6 8 10 B e n z o a te (m M ) Benzylalcohol Benzoate (b) 0 1 2 3 4 5 6 A c e ta te a n d E th a n o l (m M ) Acetate Ethanol (a) 0 0.2 0.4 0.6 0.8 1 1.2 B en z al d eh y d e C o n c. (m M ) 0 2 4 6 8 C u m . B en za ld eh y d e (m M ) Benzaldehyde Conc. Cum. Benzladehyde (d) 0 0.05 0.1 0.15 0.2 0.25 0 100 200 300 400 500 600 700 Time (hrs) B e n z y la lc o h o l/ B e n z o a te
Fig.1. Variations in benzaldehyde, benzoate, benzylalcohol, ethanol and acetate in benzaldehyde amended (live)
macrocosms over time. (a) The rate of benzaldehyde depletion appears to slow after 400 hours. (b) Ethanol is initially depleted under iron reducing conditions. However, ethanol accumulates after 300 hours when iron reduction slows. (c) Both benzoate and benzylalcohol were produced throughout the incubation period. However, the rate of benzylalcohol production increases after 250 to 300 hours. (d) The increase in the benzylalcohol production rate
after 300 hours causes the ratio of benzylalcohol to benzoate to increase after 300 hours. Error bars represent standard deviation of triplicate live macrocosms.
Total Fe(II) 8 10 12 14 16 18 20 T o ta l F e( II ),M o le s/ g d ry w t.
Solid Phase Fe(III)
27 30 33 36 39 42 0 100 200 300 400 500 600 700 Time (hrs) F e( II I) ,M o le s/ g d ry w t.
Live Live Control Abiotic
Fig. 2. Variations in total Fe(II) and solid phase Fe(III) in benzaldehyde amended (live), no added carbon (live
control) and abiotic macrocosms over time. Total Fe(II) is the sum of aqueous plus solid phase measurements. In the abiotic macrocosms there was no significant change in Fe(II) or Fe(III) over time. However in the no added carbon macrocosms there was a measurable increase in Fe(II) and decrease in Fe(III) apparently associated with the biotransformation of ethanol present in the groundwater. Error bars represent standard deviation of triplicate live macrocosms.
Fig. 3. Variation in aqueous ethanol and acetate in no-carbon added macrocosms. Both ethanol and acetate were
present in the groundwater used to construct the macrocosms. 0 1 2 3 4 5 6 0 100 200 300 400 500 600 700 800 Time (hrs) A ce ta te an d E th an o l( m M ) Acetate Ethanol
Fig. 4. Effect of Fe mineral addition on biotransformation of fermentation products in Fe(III) depleted sediment: (a) ethanol; (b) benzylalcohol. (a) 0 2 4 6 8 0 300 600 900 1200 1500 1800 2100 E th an o l (m M ) (b) 0 0.5 1 1.5 2 0 300 600 900 1200 1500 1800 2100 Time (hrs) B en zy la lc o h o l (m M )
Oxyhydroxide Goethite Hematite
Fig. 5. Variations in total Fe(II) in Fe(III) amended microcosms. Total Fe(II) is the sum of aqueous plus solid phase measurements. 10 15 20 25 30 35 0 200 400 600 800 1000 1200 Time (hrs) T o ta l F e (I I) , M o le s/ g d ry w t
Fig. 6. Variation in organic compounds over time in washed sediment microcosms spiked with iron oxyhydroxide at
1500 hours. Ethanol and benzylalcohol degradation resumed after Fe(III) addition indicating iron availability was limiting. CaCl2 0 0.5 1 1.5 2 2.5 3 3.5 4 0 500 1000 1500 2000 2500 3000 E th an o l an d B en zy la lc o h o l (m M ) 0 2 4 6 8 10 A ce ta te an d B en zo at e (m M ) NaAc 0 0.5 1 1.5 2 2.5 3 3.5 4 0 500 1000 1500 2000 2500 3000 E th an o l an d B en zy la lc o h o l (m M ) 0 2 4 6 8 10 A ce ta te an d B en zo at e (m M ) No Treatment 0 0.5 1 1.5 2 2.5 3 3.5 4 0 500 1000 1500 2000 2500 3000 Time (hrs) E th an o l an d B en zy la lc o h o l (m M ) 0 2 4 6 8 10 12 A ce ta te an d B en zo at e (m M )
Fig. 7. Variation in organic compounds over time in washed sediment microcosms. Ethanol and benzylalcohol were
depleted after 2100 hours in CaCl2 and NaAc washed sediment but persisted in untreated sediment. CaCl2 0 0.5 1 1.5 2 2.5 3 3.5 4 E th an o l an d B en zy la lc o h o l (m M ) 2 4 6 8 10 12 14 A ce ta te an d B en zo at e (m M ) NaAc 0 0.5 1 1.5 2 2.5 3 3.5 4 E th an o l an d B en zy la lc o h o l (m M ) 2 4 6 8 10 12 14 A ce ta te an d B en zo at e (m M ) No Treatment 0 0.5 1 1.5 2 2.5 3 3.5 4 0 500 1000 1500 2000 2500 3000 Time (hrs) E th an o l an d B en zy la lc o h o l (m M ) 2 4 6 8 10 12 14 A ce ta te an d B en zo at e (m M )
Fig. 8. Variation in aqueous Fe(II) concentrations in washed sediment microcosms. Fe(II) increased in CaCl2and
NaAc treated microcosms but did not increase in the untreated microcosm. 5 6 7 8 9 0 500 1000 1500 2000 2500 3000 Time (hrs) F e( II ), m M