行政院國家科學委員會專題研究計畫 期末報告
勞依茲辛迪卡評等的決定因子:中央基金的影響
計 畫 類 別 : 個別型 計 畫 編 號 : NSC 101-2410-H-004-072- 執 行 期 間 : 101 年 08 月 01 日至 102 年 10 月 31 日 執 行 單 位 : 國立政治大學風險管理與保險學系 計 畫 主 持 人 : 許永明 計畫參與人員: 大專生-兼任助理人員:徐健翔 大專生-兼任助理人員:吳雅岩 博士班研究生-兼任助理人員:蕭景元 報 告 附 件 : 出席國際會議研究心得報告及發表論文 公 開 資 訊 : 本計畫涉及專利或其他智慧財產權,2 年後可公開查詢中 華 民 國 103 年 01 月 13 日
中 文 摘 要 : 勞依茲保險市場是世界重要的保險市場之一。與各國家之安 定基金不同,勞依茲保險市場設有所謂的中央基金,而辛迪 卡所發行的所有保單,皆受到該基金的全額保證。本研究的 目的在於:找出影響勞依茲保險人接受評等機率及所得到評 等之決定因子。我們發現:大型、獲利能力較好與流動性較 高的辛迪卡,較容易被評等,也會得到比較高的評等;對再 保險較為依賴的辛迪卡,也會較容易被評等,但會得到比較 低的評等。我們的發現,較為支持「訊號假說」,而比較不 支持「不確定性減少假說」。 中文關鍵詞: 中央基金、辛迪卡、評等
英 文 摘 要 : The Lloyd's market plays a pivotal role in the global insurance business. Unlike the national guaranty funds operating within the insurance markets, a Central Fund was set up by the Lloyd's market to provide a full guarantee for all policies issued by the syndicates, and since unsolicited ratings are also assigned to the syndicates by Standard & Poor's (S&P), a combination of these institutional attributes make the London insurance market an appropriate setting for our analysis of whether the `signaling' hypothesis or the
`uncertainty reduction' theory holds. Based upon a sample of Lloyd's syndicates covering the years 2006 to 2010, we examine the determinants of (i) the
likelihood of being rated, and (ii) the rating that is likely to be assigned by S&P, from which we document evidence of selectivity bias. Larger, more profitable and liquid syndicates are found to be more likely to receive a rating, and indeed, to have
higher ratings. Syndicates with more reinsurance dependence are more likely to be rated, but less likely to obtain a higher rating. Our findings
indicate that the `signaling' hypothesis dominates the `uncertainty reduction' theory.
英文關鍵詞: Lloyd's Central Fund; Syndicates; Unsolicited ratings
行政院國家科學委員會補助專題研究計畫
■ 成 果 報 告
□期中進度報告
勞依茲辛迪卡評等的決定因子:中央基金的影響
計畫類別:■ 個別型計畫 □ 整合型計畫
計畫編號:
NSC 101-2410-H-004-072
執行期間:101 年 8 月 1 日至 102 年 10 月 31 日
計畫主持人:許永明
共同主持人:
計畫參與人員:蕭景元、徐健翔、吳雅岩
成果報告類型(依經費核定清單規定繳交):■精簡報告 □完整報告
本成果報告包括以下應繳交之附件:
□赴國外出差或研習心得報告一份
□赴大陸地區出差或研習心得報告一份
■出席國際學術會議心得報告及發表之論文各一份 (另附)
□國際合作研究計畫國外研究報告書一份
處理方式:除產學合作研究計畫、提升產業技術及人才培育研究計畫、列管計 畫及下列情形者外,得立即公開查詢 □涉及專利或其他智慧財產權,□一年■二年後可公開查詢執行單位:政治大學風險管理與保險學系
中 華 民 國 103 年 1 月 13 日
1. INTRODUCTION
Financial economists have been striving for some considerable time to identify the factors
motivating firms to solicit ratings and the basis upon which such ratings are actually
determined. Although numerous studies have examined the rationale for soliciting corporate
ratings, along with the determinants of such ratings, relatively little research has been
undertaken into the motivation for firms within the insurance industry to obtain unsolicited
ratings, or indeed, the factors affecting these ratings. The primary aim of the present study is
therefore to examine the factors potentially determining Lloyd’s syndicates’ unsolicited
ratings.
The Lloyd’s market comprises of a number of syndicates playing a pivotal role within
the global insurance business; thus, in any analysis of syndicate ratings, it is necessary, and
indeed, important to take the distinct features of the Lloyd’s market into consideration. For
example, despite the fact that syndicates underwrite risk on a respective basis, their capital
is mutualized at market level through the Lloyd’s Central Fund; it should, however, be
noted that in contrast to the guaranty funds operating within the insurance markets across
the world, this fund actually serves as a comprehensive warranty for all policies issued by
the syndicates.
well-advanced, there appear to be very few studies which have set out to delve into the
motivation for insurers to obtain such ratings.1
1
Examples include Pottier and Sommer (1999), Adams, Burton and Hardwick (2003) and Gaver and Pottier (2005).
There are two main issues which have been
raised in these studies; the first relates to the identification of the factors affecting the initial
decisions by insurers to seek ratings by the various agencies, whilst the second examines the
determinants of the financial strength ratings which will ultimately be applied to such
insurers.
To the best of our knowledge, no study has yet set out to examine the determinants of
Lloyd’s syndicate ratings; thus, in the present study, we aim to fill the current gap within the
literature by investigating the relationship between syndicate ratings and key
syndicate-specific characteristics, whilst also seeking to determine whether these
characteristics may potentially influence the likelihood of a syndicate being rated. Of
particular importance is the fact that, as far as we can determine, this study is the first to
examine these two issues within the context of unsolicited ratings and full guarantee funds.
We therefore suggest that our results could provide a useful comparison with the prior US-
and UK-based studies in which examinations were undertaken of insurer attributes and their
association with the financial strength of insurers in policyholder markets with incomplete
As noted in a very recent study (Rymaszewski, Schmeiser and Wagner, 2012)
self-supporting insurance guarantee funds internalize the costs of insurer insolvency and
also reduce potential agency problems. The Central Fund of the Lloyd’s market is, in
essence, similar to the guaranty funds within the national insurance markets; however, the
primary difference between the two types of funds is that the Central Fund provides full
protection for policyholders, whereas the guaranty funds do not.2
We find that firm size, profitability, liquidity and reinsurance are important factors Thus, our primary aim in
this study is to determine whether the Central Fund of the Lloyd’s market directly affects
syndicate rating decisions.
Using data on Lloyd’s syndicates covering the years 2006 to 2010, our analysis begins
with the application of binary and ordered probit regressions as the means of examining the
determinants of the likelihood of being assigned a Lloyd’s Syndicate Assessment (LSA) by
Standard & Poor’s (S&P), as well as the determinants of the level of the assessment
assigned. Our study is heavily reliant on the related literature on the determinants of insurer
ratings, as well as the ratings criteria used by S&P to identify the potential determining
factors.
2Within the US insurance markets, state guaranty funds provide protection for policyholders in the event of their
insurer failing to fulfill their obligations; however, such protection is limited. For example, most states provide maximum life insurance benefits of US$300,000 and health insurance benefits of US$100,000. Comprehensive descriptions of the US life and non-life guaranty funds are provided by Brewer, Mondschean and Strahan (1997) and Feldhaus and Kazenski (1998).
determining not only the likelihood of syndicates being rated, but also the level of such
ratings. Our results provide general support for the ‘signaling’ hypothesis since they imply
that even though policyholder claims are fully guaranteed, financially-sound syndicates may
still choose to send a signal to the market by placing additional information into the public
domain for potential use by S&P for rating purposes; this suggests that syndicates wish to
clearly demonstrate their financial soundness to other stakeholders (creditors, investors and
regulators). We also document evidence of a sample selection problem in syndicate ratings.
Several of the prior ratings-based studies have examined the determinants of
bond/credit ratings relating to: (i) insurers (Pottier and Sommer, 1999; Adams, Burton and
Hardwick, 2003; Gaver and Pottier, 2005); (ii) banks (Moon and Stotsky, 1993; Poon, Firth
and Fung, 1999; Poon and Firth, 2005; Poon, Lee and Gup, 2009); and (iii) non-financial
firms (Poon, 2003; Han, Moore, Shin and Yi, 2012). These studies invariably set out to
examine the determinants of such ratings in the context of whether policyholders or
debtholders who place considerable reliance on insuring firms are sufficiently compensated if
and when a claim arises.3
We extend the prior works by examining whether any significant differences are
discernible between the characteristics of those syndicates that are assigned unsolicited
ratings and those that are not assigned such ratings. Of particular significance is the fact that
this issue is examined within the context of policyholders with no credit risk in order to
determine whether this would affect syndicates’ passively receiving unsolicited ratings. We
consider that the important institutional attribute, the full guarantee provided by the Lloyd’s
Central Fund, makes the London insurance market an appropriate environment within
which to carry out our research.
One study with a close connection to ours is that of Adams et al. (2003), although there
are two major differences between the two studies.4
Secondly, we find that the syndicate features which are of particular importance in
determining the assigned rating level are also of importance in determining the probability
of a rating being assigned when the ratings are unsolicited; these features include firm size,
profitability, liquidity and reinsurance dependence. In contrast, Adams et al. (2003) found Firstly, Adams et al. (2003) used data
on UK life, non-life and composite insurers, whereas we use data on the Lloyd’s syndicates
of the London insurance market. Furthermore, their sample comprised of only 10 percent of
all UK insurers authorized to engage in insurance business during their 1993-1997 analysis
period; in contrast, our sample represents approximately 83 percent of the total population
of syndicates operating within the Lloyd’s market during the years 2006 to 2010.
4Adams et al. (2003: 542) noted that Standard & Poor’s assigned ratings to UK insurers based almost
exclusively on public information. Our research uses LSAs assigned to UK syndicates byStandard & Poor’s which are also based primarily on public information. This similarity makes the comparison between their study and ours more valid.
that size, liquidity, surplus growth, reinsurance and business activity were important
determinants of the probability of being assigned an S&P rating, whilst profitability,
liquidity and financial leverage were found to be key factors in determining insurer credit
ratings.
The remainder of this paper is organized as follows. Background information on the
Lloyd’s market is provided in Section 2, followed in Section 3 by are view of the related
literature and the definition of our testable predictions, along with a discussion of the
methodology and empirical framework employed in this study. A description of our research
design and empirical analysis is provided in Section 4, followed in Section 5 by the
presentation of our empirical results. Finally, the conclusions drawn from this study are
presented in Section 6.
2. INSTITUTIONAL BACKGROUND
Lloyd’s is a leading market for reinsurance and specialist property, casualty, marine and
aviation insurance and is well known as an insurance/reinsurance provider for risks that are
characteristically of huge size, complex and often unusual nature, as well as the difficulty
involved in actuarially pricing the risk involved. According to the Lloyd’s market annual
report, gross income from premiums in 2010 had risen to £22,592 million (Society of
Lloyd’s underwrites a diversified portfolio of businesses by various classes, comprising
of reinsurance (37 per cent), property (22 per cent), casualty (20 per cent), marine (7 per
cent), energy (6 per cent), motor (5 per cent) and aviation (3 per cent). This portfolio is also
diverse from a geographic perspective, with Canada and the US being Lloyd’s most
important markets, accounting for 43 per cent of its gross income from premiums in 2010;
clearly, however, the UK is also an important market, accounting for a further 20 per cent of
its gross income from premiums.
Lloyd’s has additional business interests in Europe (16 per cent), Central Asia and the
Asia Pacific (10 per cent), ‘other Americas’ (7 per cent) and the rest of the world (4 per
cent). Such diversification of the portfolio, from both geographical and business class
perspectives, is extremely effective in spreading Lloyd’s overall business risk and protecting
its financial performance and solvency against individual adverse business and geographical
developments.
There are two unique features of the Lloyd’s market which distinguish it from all other
insurance markets. Firstly, members (both individuals and corporations) provide capital,
joining together as syndicates to underwrite the risks involved;5
5 Prior to 1994, the capital backing for syndicates was derived mainly from individual members, with
unlimited liability, also known as ‘Names’; however, according to the Society of Lloyd’s (2008), from January 2008 onwards, almost 95 per cent of its market capital was supplied by corporate members with only limited liability.
all members are financially
Lloyd’s has a unique capital structure chain comprising of three security links, each of
which are described below.
The first two links in the Lloyd’s chain are the syndicate level assets and the funds
provided by its members, whilst the third link includes the Central Fund and the
subordinated debts/securities issued by the Society of Lloyd’s. All risk is underwritten by
the syndicates on a respective basis, although the policies issued from the 1993 account year
onwards are all comprehensively backed by the Lloyd’s Central Fund to which members are
required to contribute annually based upon their capacity. The risks insured or reinsured by
the syndicates are then partly mutualized at market level through the Central Fund.
During our 2006-2010 analysis period, the LSAs assigned by S&P were primarily
based on publicly-available syndicate information. Since such ratings are not solicited by
syndicates, they are only assigned if sufficient information is available. Under a situation of
no policyholder default risk and unsolicited ratings, the full guarantee provided by the
Lloyd’s Central Fund makes the Lloyd’s market an appropriate setting to test whether the
‘signaling’ hypothesis or the ‘uncertainty reduction’ theory holds. Additionally, since data
on a single industry is used in this study, we are able to control for cross-industry
differences in both the regulatory environment and the underwriting/investment/reporting
In November 2001, the UK insurance regulator, the Financial Services Authority (FSA),
assumed legal supervisory responsibility for the Society of Lloyd’s and its managing agents,
with Lloyd’s daily business activities subsequently being overseen by the Corporation of
Lloyd’s with responsibility for monitoring the performance of the syndicates and managing all
regulatory reporting to the FSA. In compliance with the Insurance Accounts Directive
Regulations (Lloyd’s Syndicate and Aggregate Accounts) 2004, on 1 January 2005, Lloyd’s
switched its financial reporting from a three-year funded accounting basis to annual UK
‘Generally Accepted Accounting Principles’ (GAAP), thereby ensuring that the financial
information on the syndicates was comparable to that of insurers and reinsurers. This
regulatory change also results in our research being comparable to the prior studies on
insurers and reinsurers.
3. RELATED THEORIES AND HYPOTHESIS DEVELOPMENT
Analysis of the determinants of credit/financial strength ratings is already well documented
within the literature, with the related studies being broadly classified into two categories.
The first of these involves the identification of the determinants for seeking a rating. The
main research issue examined under this category relates to the factors affecting the
likelihood of a rating being assigned, with this category being further divided into two
The major difference between solicited and unsolicited ratings is that the former is
requested and therefore paid for by the rated firm, whilst the latter is neither initiated nor
paid for by the rated firm. Solicited ratings are assigned based upon
private/inside/confidential information, as well as publicly-available company information;
they are also assigned on an interactive basis, which would indicate that in most cases,
discussion with the company management is a prerequisite. Conversely, unsolicited ratings
are primarily assigned based upon publicly-available financial information (such as
financial statements and news) with no involvement by the rated company in the overall
rating process.
The second strand of the research into the rating determinants examines those factors
affecting rating levels. In contrast to various other studies (such as Gaver and Pottier, 2005;
and Gray, Mirkovic and Ragunathan, 2006), some of the prior studies simultaneously
examined the factors affecting the decision on whether to voluntarily apply for a rating,
along with the factors affecting the rating level.6
6 Examples include Moon and Stotsky (1993), Pottier and Sommer (1999) and Adams et al. (2003).
Furthermore, most of these studies tend to
adopt a similar set of statistically significant variables for their rating likelihood and rating
level models; and indeed, some of the firm characteristics that are important in determining
There are two main theories within the extant literature on the determinants of ratings;
that is, the ‘signaling’ hypothesis and the ‘uncertainty reduction’ theory. According to the
‘signaling’ hypothesis, if managing agents expect to receive a good rating outcome they will
be motivated to release sufficient financial information on the syndicate to passively obtain
a rating in order to signal to the market that their firm is in good financial health.7
Conversely, for various reasons, syndicates may decide not to release sufficient
information for rating purposes. Some low-quality syndicates may believe that their
financial/operating performance is not good enough to obtain a rating of any benefit to them;
thus, they would elect to maintain their non-rated status. Another reason that may Since
firms with superior performance are more likely to be rated, and to obtain a higher rating
(Han et al., 2012), this argument is actually based on a process of self-selection.
Those syndicates which perceive that being assigned a rating will be beneficial to them
will choose to place sufficient information in the public domain, based upon which S&P can
subsequently assign a rating. The reason for choosing to make such information available is
that they expect the costs (such as preparing information for public use) to be far exceeded
by the benefits (such as more business from customers or a lower cost of capital from
capital providers).
7These two theories are derived mainly from information asymmetry. In the context of insurance, the
potentially prevent syndicates from seeking a rating through the release of information is
that they may not wish their competitors to learn of their business strategies based upon an
assessment of their financial/operating profile. Furthermore, some non-rated syndicates will
choose not to seek a rating simply because they do not recognize any need to do so; that is,
they may feel that they already have sufficient lucrative business and/or do not need any
additional capital.
However, some syndicates can still find themselves being rated, despite the fact that
they do not actually want to be rated. In most cases, syndicates will, and can, select for
themselves what is better for them; that is, they will make the conscious decision on
whether to be rated or remain unrated. Therefore, in an ex-post sense, we expect to find that
non-rated syndicates are no less risky than rated syndicates.
The ‘uncertainty reduction’ theory nevertheless suggests that syndicates obtain ratings
as a means of reducing the ex-ante uncertainty amongst policyholders, investors and
regulators with regard to their future insolvency risk. Based upon this supposition, riskier
syndicates are more likely to be rated in order to reassure such policyholders, investors and
regulators that they are, in fact, in good financial health. Thus, from an ex-post standpoint,
we should find that non-rated syndicates are actually less risky than rated syndicates. We
Rating agencies fear that they may make mistakes when assigning ratings; that is, there
is the constant danger of underrating or overrating a firm. When setting out to assign ratings
to syndicates (which are generally more opaque than banks and insurers), it is believed that
rating agencies would tend to be relatively conservative, with conservative rating agencies
tending to underrate firms, as opposed to overrating them, for two specific reasons.
Firstly, the adverse consequences associated with overrating are greater than those
associated with underrating. The worst case scenario for overrating is a high rating being
assigned to a syndicate based upon a low risk evaluation, with the syndicate ultimately
becoming insolvent. By contrast, underrating involves a low rating being assigned to a
syndicate which is assessed as high risk, when in fact, no default occurs. Clearly, overrating
would tend to damage the reputation of the agency far more than underrating.
Secondly, if a conservative rating is assigned to a syndicate, this could also be regarded
by the rated firms as a form of ‘blackmail’; that is, if the rated firms consider that the rating
which they are likely to be given will be too low, then they may elect to place more
information into the public domain in order to obtain a rating which will correctly reflect
their financial strength.
Based upon the above discussion, the ‘signaling’ hypothesis suggests that there is a
‘uncertainty reduction’ theory posits that riskier firms are also likely to apply for a rating,
although this assumption may not hold in the case of syndicates. Given the existence of the
Lloyd’s Central Fund, syndicates will naturally be less motivated to release additional
information to obtain an S&P rating, essentially because the managing agents have no need
to signal to their policyholders that their syndicate is financially strong, or indeed, to reduce
any ex-ante uncertainty amongst policyholders with regard to the future insolvency risk of
their syndicate.
We therefore expect to find that no significant differences will be discernible between the
variables of the rated and non-rated syndicates discussed below; it is, however, likely that the
managing agents will still wish to reduce uncertainty amongst other market participants, such
as investors and regulators, or to send a signal to them. If this is the case, then we would
expect to find significant differences in certain financial features between rated and non-rated
syndicates.
Many potential explanatory factors on the LSAs assigned to syndicates are taken into
consideration in this study, where we not only draw on the prior studies examining the
financial strength/solvency ratings and bond/credit ratings of insurers, but also review the
financial constructs which are considered by S&P when assigning such LSAs. Most of the
stated by S&P as being employed in the determination of LSAs (Standard & Poor’s, 2006).
The proxies for these variables used in the present study are described in the following
sub-sections.
3.1 Firm Size
As compared to their smaller counterparts, larger firms generally have economies of scale
and/or scope along with several other associated benefits, including a greater capacity for
dealing with adverse market fluctuations and the ability to raise external funds at lower
costs (Harrington and Niehaus, 2004). Since larger firms are generally associated with
lower insolvency risk, they will also tend to be assigned higher ratings (Pottier and Sommer,
1999; Gaver and Pottier, 2005).
Furthermore, under the ‘voluntary disclosure’ theory, as a result of their greater
economies of scale in information production, as well as the greater demand for information
by market participants, firms are generally motivated to provide more company information
(Lang and Lundholm, 1993; Frankel, McNichols and Wilson, 1995). We therefore expect to
find that larger syndicates will be more likely to seek an appropriate rating by placing
sufficient information into the public domain, as a result of which they are likely to be
assigned a higher rating. To mitigate the effects of extreme observations and associated
natural logarithm of total assets.
3.2 Leverage
Excessive leverage increases insolvency risk (Staking and Babbel, 1995; Cole and
McCullough, 2006); thus, highly-leveraged syndicates are generally expected to be more
likely to become insolvent, and hence, to receive a low financial strength rating. Based upon
the ‘signaling’ hypothesis, such syndicates are unlikely to voluntarily release financial
information in order to apply for a financial strength rating; however, under the ‘uncertainty
reduction’ theory, highly-leveraged syndicates have a propensity for seeking ratings in order
to reduce the ex-ante uncertainty with regard to the insolvency risk arising from their high
leverage.
Although Pottier and Sommer (1999) found mixed evidence on the effects of leverage
on decisions to seek ratings from AM Best and Moody’s, they documented a negative
relationship between leverage and the ratings assigned by AM Best and Standard & Poor’s.
Furthermore, Adams et al. (2003) found that both the probability of being rated and the
rating level were negatively related to an insurer’s leverage, thereby providing support for
the ‘signaling’ hypothesis. Gaver and Pottier (2005) also documented a negative
relationship between leverage and rating levels.
have a negative correlation with the rating level; this variable is measured in the present
study as the ratio of accumulated reserves to total assets.
3.3 Profitability
The relationship between profitability and rating levels appears self-evident, since a profitable
syndicate has a greater likelihood of remaining in lucrative business and a relatively lower
likelihood of becoming insolvent. Based upon the ‘signaling’ hypothesis, a more profitable
syndicate will be motivated to send out a signal to the market. Thus it will be more likely to
voluntarily release its financial information, and accordingly, be assigned a rating; however,
under the ‘uncertainty reduction’ theory, we would expect to find that a more profitable
syndicate will have a lower association with uncertainty, and thus, will be less likely to obtain
a rating.
Nevertheless, the prior empirical research clearly indicates a positive relationship
between profitability and both the likelihood of being rated and the rating level assigned
(Pottier and Sommer, 1999; Adams et al., 2003; Gaver and Pottier, 2005). We would
therefore expect to find the profitability of a syndicate having positive correlations with
both the probability of being rated and the level of such rating. The Profitability variable is
proxied in this study by the return on assets, measured as the ratio of pre-tax profits
3.4 Liquidity
Syndicates with higher liquidity levels are expected to be more able to cope with unexpected
huge losses, and thus, have a lower likelihood of insolvency. Based upon the ‘signaling’
hypothesis, a highly liquid syndicate is more likely to be rated, and to obtain a higher rating;
however, under the ‘uncertainty reduction’ theory, since a more liquid syndicate has less
uncertainty, it will be less likely to obtain a rating.
Adams et al. (2003) found that although insurers with higher liquidity had a greater
likelihood of being AM Best-rated, they were less likely to be S&P-rated; nevertheless, they
found a consistent correlation between insurers with higher liquidity and higher AM Best
and S&P ratings, with this positive relationship between liquidity and ratings also being
documented by Gaver and Pottier (2005). We expect to find that syndicates with higher
liquidity will have a greater likelihood both of being rated and obtaining a higher rating.
The Liquidity variable is proxied in this study by the ratio of the sum of cash, bonds and
stocks to total assets.
3.5 Reinsurance Dependence
Reinsurance involves the transfer of risk from a cedant to a reinsurer. On the one hand,
reinsurance serves as an effective substitute for capital in reducing the probability of a
2003). On the other hand, however, there are costs involved in reinsurance, with excessive
reinsurance dependence potentially reducing profitability; indeed, Shiu (2004) demonstrated
that over the long term, reinsurance will tend to lead to a reduction in profitability.
Furthermore, heavily reinsured syndicates are highly exposed to the insolvency risk of
their reinsurer, although the empirical results on this issue are mixed. Pottier and Sommer
(1999) documented a positive relationship between the decision to seek a rating and
reinsurance dependence, whereas Adams et al. (2003) found a negative relationship; thus, the
net effect of reinsurance on rating levels is unclear. The Reinsurance Dependence variable is
measured in this study as the ratio of reinsurance premiums ceded to direct business written,
plus reinsurance premiums assumed.
3.6 Business Mix
Many syndicates specialize in particular lines of insurance business, which can obviously
have potential influences on their investment portfolios. We therefore expect to find that the
business mix of a syndicate will have significant impacts on the likelihood of the syndicate
being rated, as well as the level of the rating assigned. The Business Mix variable is measured
in this study as the proportions of net earned premiums written on each of the following lines:
damage and miscellaneous.8
Those firms with sufficient capital are expected to have a relatively lower risk of insolvency,
and thus, a greater likelihood of being rated and being assigned a higher rating. Within the
3.7 Business Concentration
The concentration of a syndicate’s lines of business reflects its underwriting profile; those
with greater diversity in their underwriting portfolios have a lower degree of risk exposure
to the underperformance and volatility of specific sectors (Standard &Poor’s, 2006). Pottier
and Sommer (1999) argued that business concentration has a negative influence on the
probability of being rated, whilst Harrington and Niehaus (2004) suggested that insurers
could reduce their underwriting risk by means of diversification of their production lines.
Consequently, we expect to find that the higher the business concentration of a
syndicate, the lower the probability of the syndicate seeking a rating, and the lower the
rating that is likely to be assigned. We use the Herfindahl index as the proxy for the business
concentration of a syndicate, with the Business Concentration variable in this study being
computed as the sum of the squares of the ratio of individual line-of-business premiums
written to gross premiums written.
3.8 Capitalization
8
We arbitrarily remove one line of business, ‘accident and health’, in order to avoid singularity in the regressions. The selection of the omitted line is not found to have any impact on the results.
Lloyd’s market, the solvency of a syndicate is backed by the balances of the syndicate
members and their funds at Lloyd’s. The balances of the syndicate members are the
difference between its assets and liabilities, whilst their funds at Lloyd’s comprise of the
capital provided by members, which is equivalent to the insurers’ capital.9
The syndicate data set used in the present study includes all of the LSAs assigned by
Standard & Poor’s between the years 2006 and 2010, with this period having been
specifically selected essentially because the S&P ratings assigned during these years were
primarily based upon public information, thereby ensuring a representative study sample. The Capitalization variable is measured in this study as the ratio of the members’
balances plus their funds at Lloyd’s to net premiums written. Ceteris paribus, the higher a
syndicate’s capitalization the lower its level of dependence on the Lloyd’s Central Fund, and
thus, the higher its probability of seeking a rating. We predict that a syndicate with greater
capitalization will receive a higher rating.
4. RESEARCH DESIGN
4.1 Data
10
9Since syndicates do not retain profits, there are no policyholder surpluses shown in their balance sheets. 10AM Best, Fitch and Moody’s also issue Lloyd’s syndicate ratings; however, in the majority of cases, these
rating agencies either use input from the syndicate’s management or provide interactive rating services. The ratings issued by Standard & Poor’s are primarily based on information already in the public domain.
business continuity and dependence on the Lloyd’s infrastructure and Central Fund
(Standard & Poor’s, 2007).
Those syndicates that were assigned an LSA of 1 were highly dependent on Lloyd’s
and had a low likelihood of continuing in business, whereas those that were assigned an
LSA of 5 had very low dependence on Lloyd’s and a high probability of business continuity.
It is, however, worth noting that from the perspective of policyholders, the measure of the
financial strength of a syndicate is its financial strength rating on the Lloyd’s market, which
is essentially based upon the full protection provided by the Central Fund. The LSA
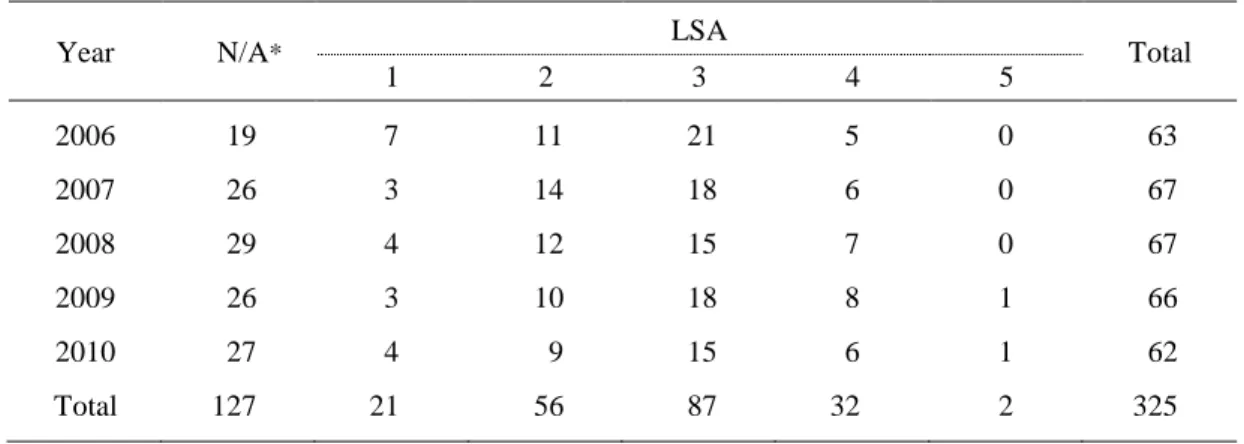
distribution of Lloyd’s syndicates from 2006 to 2010 is shown in Table 1.
<Table1is inserted about here>
Of the total of 325 syndicate-year observations, 127 (39 per cent) were not rated, 87 (27
per cent) were assigned an LSA of 3, 77 (24 per cent) were assigned an LSA below 3 (LSA=
1 or 2) and 34 (10 per cent) were assigned a rating above 3 (LSA= 4 or 5). The distribution
of the rated syndicate-year observations appears to have positive skewness, which would
thereby imply that in general, Lloyd’s syndicates are highly dependent on the Central Fund.
This evidence is consistent with the view that unsolicited ratings are invariably found to be
conservative.11
11 See for example Poon (2003), Poon and Firth (2005), Behr and Güttler (2008), Poon, Lee and Gulp (2009),
Bannier, Behr and Güttler (2010) and Van Roy (2012). Two arguments are proposed in these studies to explain the downward bias in unsolicited ratings. According to the ‘self-selection’ argument, those firms with better
A possible interpretation of this is that the LSAs assigned by S&P are based mainly on
public information, and where there is any doubt, the rating agencies tend to be cautious and
conservative. In addition, unsolicited ratings are considered to be less accurate than solicited
ratings because the rating agencies have insufficient access to undisclosed information
(Baker and Mansi, 2002; Van Roy, 2012).
All syndicates in existence during this period were included in the sample in order to
avoid potential ‘survivorship bias’, whilst observations with non-logical values (such as
non-positive values for assets, liabilities, members’ balances or premiums) were excluded for
those years in which the non-logical values were present. The resultant sample yielded an
unbalanced panel of 325 syndicate-year observations. Since this sample of the Lloyd’s market
represents roughly 83 per cent of the total population of syndicates, including non-rated
syndicates, operating over the period under analysis, it would seem to be sufficiently
representative.12
We begin by regressing the likelihood of being rated on the syndicate characteristics, with
the model being estimated using a binary probit regression. The dependent variable for this
4.2 Models
performance are more likely to opt for a rating; conversely, since low-quality firms generally do not solicit ratings, they consequently receive no rating or are assigned unsolicited ratings. Under the ‘agency conservatism’ hypothesis, the rating agencies are inclined to assign conservative ratings to firms with lower transparency.
12
The total numbers of syndicates in the Lloyd’s market were 66 in 2006, 72 in 2007, 81 in 2008, 85 in 2009 and 87 in 2010 (source: website of Society of Lloyd’s, http://www.lloyds.com).
regression is a dichotomous variable which takes a value of 1 or 0, depending on whether
the syndicate is assigned an LSA. We then use an ordered probit regression to estimate the
rating level model.13
∗ ∗ ∗ ∗ ∗ < = ≤ < = ≤ < = ≤ < = ≤ = + = t i t i t i t i t i t i it t i t i y if y if y if y if y if y x y , 3 3 , 2 2 , 1 1 , , , ' , * , 4 3 2 0 1 0 0 µ µ µ µ µ µ ε β
Since the LSAs have an ordinal scale, ranging from 1 to 5, an ordinary
linear regression would clearly be inappropriate (Liao, 1994). The ordered probit regression
model is as follows:
(1)
where yi∗,t is a continuous and unobserved variable for syndicate i in year t; xi,t is a vector of
explanatory variables for syndicate i in year t; and β is a vector ofthe coefficients to be estimated. We assume that εi,t follows normal distribution with zero mean across all observations; yi,t ranges from 0 to 4 to representthe S&P LSAs (ranging from 1 to 5) for
syndicate i in year t; and μ refers to the unknown threshold parameters separating the adjacent categories to be estimated.
5. EMPIRICAL RESULTS
13Following Poon, Firth and Fung (1999), we also estimate the model using an ordered logit regression, and find
that the determinants identified are identical to those using an ordered probit regression. The main theoretical difference between ordered probit and logit regressions is the assumption of the error terms. In a probit model, the error terms are assumed to follow a standard normal distribution, whereas in a logit model they are assumed to follow a logistic distribution. See Liao (1994: 37-47), Borooah (2002: 4-44) and Greene (2008: 831) for comprehensive details on ordered probit and logit regressions.
5.1 Univariate Analysis
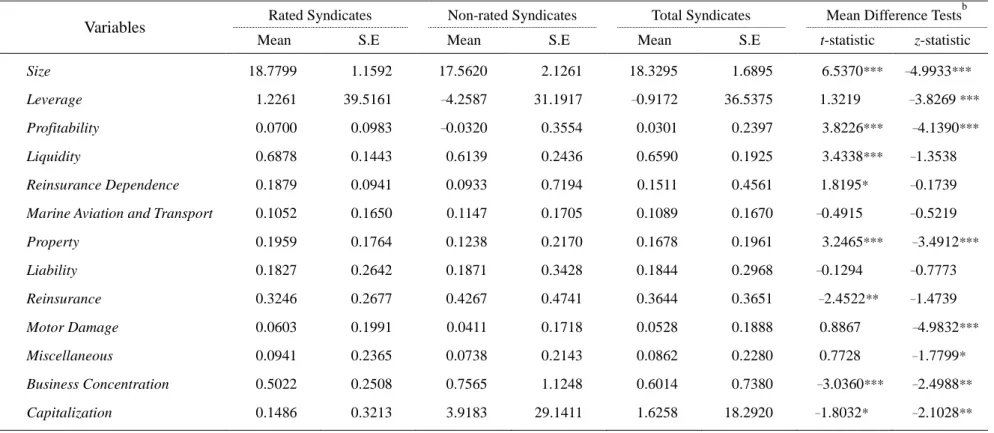
The summary statistics on the explanatory variables for both rated and non-rated syndicates
are shown in Table 2, which also reports the results on the independent samples t-tests and
Mann-Whitney U tests (also known as the Wilcoxon Rank Sum test) for differences in the
samples. About half of the explanatory variables are found to be statistically significant at
conventional levels, thereby indicating differences in these attributes between rated and
non-rated syndicates.
<Table 2 is inserted about here>
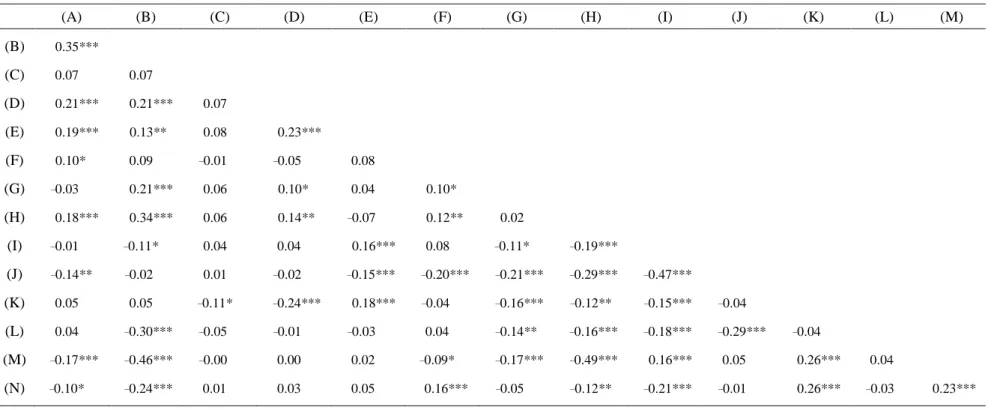
A correlation coefficient matrix on all of the explanatory variables included in the
regression models is illustrated in Table 3, which shows that the absolute correlation
coefficient values between the pairs of variables are generally found to be modest (highest
absolute value=0.47). We also calculate the variance inflation factor (VIF) for each
explanatory variable to test for possible multicollinearity; however, all of the calculated VIF
values are less than 10, thereby suggesting that multicollinearity is unlikely to be a serious
concern in this study (Gujarati, 1995).
<Table 3 is inserted about here>
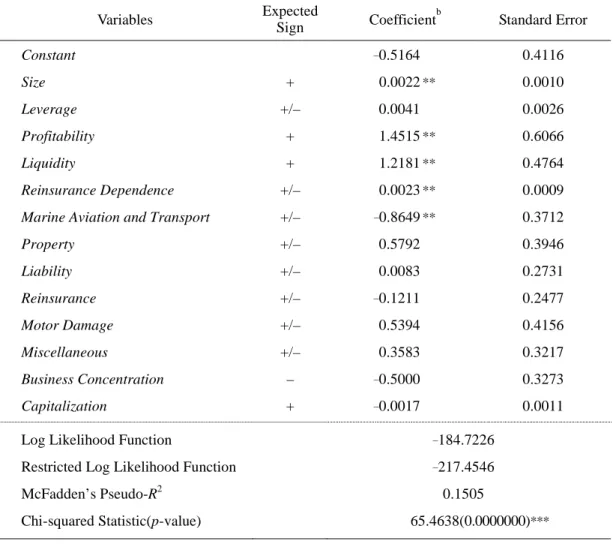
5.2 Multivariate Analysis
characteristics on the rating likelihood of the syndicates. When the constant term is the only
explanatory variable (denoted as L0) the log likelihood function value is –217.4546, whereas
when all of the explanatory variables are included (denoted as L1) the value is–184.7226;
McFadden’s (1974) pseudo-R2, defined as
0 1 1 L L − , is 0.1505. 14
In line with Pottier and Sommer (1999) and Adams et al. (2003), Profitability is found Furthermore, the
Chi-squared statistic, defined as 2(L1–L0), rejects the null hypothesis that the explanatory
power of the model is no greater than a null model without explanatory variables (χ2=
65.4638, p-value= 0.0000).
<Table 4 is inserted about here>
Consistent with our expectations, Size is found to be positive and significant at the 5
per cent level, thereby providing support for the argument that larger syndicates have a
greater likelihood of being assigned a rating. This is consistent with the ‘voluntary
disclosure’ theory, insofar as firms are generally motivated to provide company information
essentially as a result of their greater economies of scale in information production, as well
as the greater demand for information by market participants (Lang and Lundholm, 1993;
Frankel, McNichols and Wilson, 1995). However, this finding stands in stark contrast to that
of Adams et al. (2003), who reported that larger insurers were less likely to be S&P rated.
14
The pseudo-R2 value, bounded from below (by 0) and above (by 1), has no natural interpretation; however, Greene (2008) suggested that the value increases with improvement in the model fit.
to be positive and significant at the 5per cent level, indicating that more profitable
syndicates have a greater likelihood of being rated. This is consistent with the ‘signaling’
hypothesis, which postulates that profitable syndicates tend to be rated. The estimated
coefficient on Liquidity is positive (with statistical significance at the 5per cent level), a
finding which is consistent with the view that syndicates with higher levels of liquidity have
a greater likelihood of being rated.
The Marine Aviation and Transport variable is also found to be negative and
significant at the 5 per cent level, thereby indicating that syndicates insuring greater levels
of risk in the marine, aviation and transportation sector are less likely to be rated. This
provides some support for the view that the type of risk speciality in a particular syndicate
influences the likelihood of a rating being assigned.
Consistent with the results presented above on the equality tests for rated and non-rated
syndicates, the binary probit regression analysis also reveals some differences between rated
and non-rated syndicates with regard to the variables included in the model. This indicates
potential evidence of selectivity bias in our syndicate data;15
15 Evidence on selectivity bias varies in the extant literature. Some studies (Poon, 2003; Poon and Firth, 2005)
report significant sample selection bias, whilst others find no such evidence. For example, Cantor and Packer (1997) documented very limited evidence of selectivity bias, whilst Pottier and Sommer (1999) identified selectivity bias only in AM Best ratings, but not in S&P or Moody’s ratings; Adams et al. (2003) similarly reported selectivity bias in AM Best ratings, but not in S&P ratings.
indeed, we cannot rule out the
release sufficient information, with the result that they are not assessed by S&P.
Some studies stress the potential importance of controlling for any selectivity bias that
may be present (Poon, 2003; Poon and Firth, 2005); we therefore use the two-step
estimation method of Heckman (1979) to address the potential problem of sample selection
bias.16 We first obtain the inverse Mills ratio from the above binary probit analysis and then
use this ratio as an additional regressor in the two-step ordered probit regression model,
with the results being reported in Table 5.17
As shown in Panel A of Table 5, the inverse Mills ratio is found to be significant at the
5 per cent level, thereby indicating the presence of selectivity bias, and also justifying the
use of the Heckman (1979) two-step estimation approach to produce consistent estimates.
Furthermore, there are three positive and highly significant estimates of cut-off points,
which also indicates that the five categories in the response are indeed ordered (Liao,
1994).18
16 See Cantor and Packer (1997), Poon (2003) and Poon and Firth (2005).
17 The inefficiency of the two-step method reported by Johnston and DiNardo (1997) is worthy of note.
Furthermore, Heckman (1990) had earlier argued that simple estimation techniques may well just be as robust as complicated sample-selection-correction models. We therefore also run the ordered probit regressions without the use of the two-step approach and find that the results remain qualitatively unchanged.
18 Although we have five levels of LSA, there are only three non-zero estimates of cut-off points, essentially
because the first threshold parameter is typically normalized to zero so that there is one less parameter to be estimated (see Equation (1)).
The Chi-squared goodness-of-fit test is highly significant at the 1 per cent level
(χ2= 125.4726, p-value= 0.0000), which suggests that the fitted model is better than a null model without explanatory variables. The ‘hit ratio’ (the proportion of correct predictions)
is 58.33 per cent.
<Table 5 is inserted about here>
As expected, Size is found to have positive and statistically significant effects on the rating
assigned, thereby supporting the view that larger syndicates have higher LSAs. This is
consistent with the ‘scale and scope economies’ hypothesis and provides support for the view
that larger syndicates have relatively lower insolvency risk. These findings are also in line with
Pottier and Sommer (1999) and Gaver and Pottier (2005) who noted that insurer size was
positively related to their financial strength rating.
Consistent with our expectations, Profitability is found to be positive (with statistical
significance at the 1 per cent level), thereby providing strong support for the notion that
increased profitability is associated with higher LSAs. This is consistent with several of the
prior studies which reported that an increase in insurer rating was found to correspond with
higher profitability.19
Reinsurance Dependence is found to negative (with statistical significance at the 1 per
cent level), which suggests that those syndicates that are heavily dependent on reinsurance Liquidity is found to be positive and significant at the 5 per cent level,
which thereby suggests that an increase in liquidity is likely to lead to a higher rating. This
evidence is again consistent with the findings of Adams et al. (2003).
tend to have lower ratings. This is consistent with the finding of Shiu (2004) that over the
long term, reinsurance tends to be associated with a reduction in profitability; however, our
evidence conflicts with Pottier and Sommer (1999). We also find evidence of Business Mix
having some influence on rating levels.
The results on the marginal effects, which are shown in Panel B of Table 5, are
generally consistent with the parameter estimate results presented above. We find that an
increase in Size, Profitability and Liquidity increases (reduces) the probability of being
assigned an LSA of 2, 3 or 4 (LSA of 0 or 1). We also find that an increase in Reinsurance
Dependence reduces (increases) the probability of being assigned an LSA of 2, 3 or 4 (LSA
of 0 or 1).
6. CONCLUSIONS
We set out in this study to test two competing rating-related arguments, the ‘signaling’
hypothesis and the ‘uncertainty reduction’ theory, using data on a sample of Lloyd’s
syndicates. In the context of unsolicited ratings, the ‘signaling’ hypothesis argues that
better-performing syndicates which expect to receive a superior rating outcome are motivated
to release sufficient financial information to passively obtain a rating whilst signaling to the
markets that the syndicate is financially strong.
simply as a means of reducing ex-ante uncertainty amongst stakeholders with regard to the
future insolvency risk of the syndicate. Based upon this theory, riskier syndicates are more
likely to seek a rating as a means of reassuring their stakeholders that they are in good
financial health. In this study, we attempt to identify those factors that are of importance in
determining both the likelihood and the level of ratings, using the Heckman (1979) two-step
estimation method in order to avoid any potential selection bias.
We present evidence to show that the factors determining the likelihood of being rated
can also explain variations in the LSAs that are assigned to syndicates by Standard & Poor’s.
In more specific terms, we find larger, more profitable and more liquid syndicates are not
only more likely to be rated, but also more likely to obtain a higher rating. However, we
find that syndicates with more reinsurance dependence are more likely to be rated, but less
likely to obtain a higher rating. Our results provide general support for the ‘signaling’
hypothesis.
Since all policies issued by syndicates from the 1993 accounting year onwards are fully
guaranteed by the Lloyd’s Central Fund, some stakeholders (insured parties and policyholders
in particular) have no real concerns over the possible future insolvency of the syndicates.
Thus, the syndicates have no real need to reduce any ex-ante uncertainty that may be
reduction’ theory is not supported by our results. However, despite the establishment of
Lloyd’s Central Fund, syndicates still wish to signal to the market that they are in good
financial health. Since S&P LSAs are based on financial information already in the public
domain, syndicates seeking a rating will release sufficient additional public information to be
assigned a rating.
The results of this study add to the extant literature on the determinants of ratings; in
specific terms, we show that despite their ratings being assigned based primarily upon
public information and despite the fact that the claims of their policyholders are fully
protected, syndicates still feel the need to send out a signal to the market. Finally, we
provide evidence of selectivity bias, even in the context of Lloyd’s syndicates, thereby
providing additional support for the importance of controlling for selection bias when
REFERENCES
Adams, M., B. Burton and P. Hardwick (2003), ‘The Determinants of Credit Ratings in the
United Kingdom Insurance Industry’, Journal of Business Finance and Accounting,
30(3-4): 539-72.
Baker, H.K. and S.A. Mansi (2002),‘Assessing Credit Rating Agencies by Bond Issuers and
Institutional Investors’, Journal of Business Finance and Accounting, 29: 1367-98.
Bannier, C., P. Behr and A. Güttler (2010), ‘Rating Opaque Borrowers: Why Are Unsolicited
Ratings Lower?’, Review of Finance, 14: 263-94.
Behr, P. and A. Güttler (2008), ‘The Information of Unsolicited Ratings’, Journal of Banking
and Finance, 32: 587-99.
Borooah, V.K. (2002), Logit and Probit: Ordered and Multinomial Models, Thousand Oaks,
CA: Sage Publications.
Brewer, E., T.S. Mondschean and P.E. Strahan (1997), ‘The Role of Monitoring in Reducing
the Moral Hazard Problem Associated With Government Guarantees:Evidence From the
Life Insurance Industry’, Journal of Risk and Insurance, 64(2): 301-22.
Cantor, R. and F. Packer (1997), ‘Differences of Opinion and Selection Bias in the Credit
Rating Industry’, Journal of Banking and Finance, 21(10): 1395-1417.
Cole, C.R. and K.A. McCullough (2006), ‘A Reexamination of the Corporate Demand for
Davidson, R. and J. MacKinnon (1993), Estimation and Inference in Econometrics, New
York: Oxford University Press.
Feldhaus, W.R. and P.M. Kazenski (1998), ‘Risk-Based Guaranty Fund Assessments,
Journal of Insurance Regulation, 17(1): 42-63.
Frankel, R., M. McNichols and G. Wilson (1995), Discretionary Disclosure and External
Financing,Accounting Review,70: 135-50.
Garven, J.R. and J. Lamm-Tennant (2003), ‘The Demand for Reinsurance: Theory and
Empirical Tests’, Insurance and Risk Management, 71: 217-38.
Gaver, J.J. and S.W. Pottier(2005), ‘The Role of Holding Company Financial Information in
the Insurer-rating Process: Evidence from the Property-Liability Industry’, Journal of
Risk and Insurance, 72(1): 77-103.
Gray S, A.Mirkovic and V. Ragunathan (2006).‘The Determinants of Credit Ratings:
Australian Evidence’, Australian Journal of Management,31: 333-54
Greene, W.H. (2008), Econometric Analysis, 6thedn.,Upper Saddle River, New
Jersey:Pearson Prentice Hall.
Gujarati, D.N.(1995), Basic Econometrics, 3rd edn., New York:McGraw-Hill.
Han, S.H., W.T. Moore, Y.S. Shin and S. Yi(2012), ‘Unsolicited Versus Solicited: Credit
Ratings and Bond Yields’, Journal of Financial Services Research, forthcoming.
Harrington, S.E. and G.R. Niehaus(2004), Risk Management and Insurance, 2nd edn. New
Heckman, J.J.(1979), ‘Sample Selection Bias as a Specification Error’, Econometrica, 47:
153-61.
Heckman, J.J.(1990), ‘Varieties of Selection Bias’, American Economic Review, 80: 313-8.
Johnston, J. and J. DiNardo (1997), Econometric Methods, Singapore: McGraw-Hill.
Lang, M. and R. Lundholm (1993), ‘Cross-sectional Determinants of Analyst Ratings of
Corporate Disclosures’, Journal of Accounting Research, 31: 246-71.
Liao, T.F.(1994), Interpreting Probability Models: Logit, Probit and other Generalized Linear
Models, Thousand Oaks, CA: Sage Publications.
McFadden, D.(1974), ‘The Measurement of Urban Travel Demand’, Journal of Public
Economics, 3: 303-28.
Moon, C. and J.G. Stotsky (1993), ‘Testing the Differences between the Determinants of
Moody’s and Standard & Poor’s Ratings’, Journal of Applied Econometrics, 8: 51-69.
Poon, W.P.H.(2003),‘Are Unsolicited Credit Ratings Biased Downward?’, Journal of
Banking and Finance,27: 593-614.
Poon, W.P.H. and K.C. Chan (2010),‘Solicited and Unsolicited Credit Ratings: A Global
Perspective’, ADBI Working Paper 244. Tokyo: Asian Development Bank Institute.
Poon, W.P.H. and M.Firth (2005),‘Are Unsolicited Credit Ratings Lower? International
Evidence from Bank ratings’, Journal of Business Finance and Accounting,32: 1741-61.
Poon, W.P.H., M. Firth and H.G. Fung(1999), ‘A Multivariate Analysis of the Determinants
Markets, Institutions and Money, 9(3): 267-83.
Poon, W.P.H., J. Lee and B.E. Gup (2009), ‘Do Solicitations Matter in Bank Credit Ratings?
Results from a Study of 72 Countries’, Journal of Money, Credit and Banking, 41:
285-314.
Pottier, S.W.(1997), ‘Life Insurer Risk Characteristics and the Rating Process’, Journal of
Insurance Issues, 20: 111-30.
Pottier, S.W. and D.W. Sommer (1999), ‘Property-Liability Insurer Financial Strength
Ratings: Differences across Rating Agencies’, Journal of Risk and Insurance,66(4):
621-42.
Rymaszewski, P., H. Schmeiser and J. Wagner (2012), ‘Under What Conditions is an
Insurance Guaranty Fund Beneficial for Policyholders?’, Journal of Risk and Insurance,
79(3):785-815.
Shiu, Y. (2004),‘Determinants of United Kingdom General Insurance Company
Performance’, British Actuarial Journal, 10:1079-1110.
Shiu, Y. (2011), ‘Reinsurance and Capital Structure: Evidence from the United Kingdom
Non-Life Insurance Industry’,Journal of Risk and Insurance,78: 475-94.
Society of Lloyd’s (2008), Lloyd’s Market Services, January 2008.
Society of Lloyd’s (2011), Lloyd’s 2010 Annual Report.
Staking, K.B. and D.F. Babbel(1995), ‘The Relationship between Capital Structure, Interest
of Risk and Insurance, 62(4): 690-718.
Standard & Poor’s (2006), Insurance Criteria: Lloyd’s Syndicate Assessment Methodology
Revised in Light of the Lloyd's Market Move to Annual Accounting.
Standard & Poor’s (2007), Rating of the Lloyd’s Market 2007 Report.
Van Roy, P. (2012), ‘Is There a Difference Between Solicited and Unsolicited Bank Ratings
and, If So, Why?’, Journal of Financial Services Research , forthcoming.
Wooldridge, J.M.(2002), Econometric Analysis of Cross Sectional and Panel Data, 2nd edn.,
Table 1 LSA distribution of Lloyd’s syndicates
Year N/A* LSA Total
1 2 3 4 5 2006 19 7 11 21 5 0 63 2007 26 3 14 18 6 0 67 2008 29 4 12 15 7 0 67 2009 26 3 10 18 8 1 66 2010 27 4 9 15 6 1 62 Total 127 21 56 87 32 2 325
Table 2 Descriptive statistics and equality tests for rated and non-rated syndicatesa
Variables Rated Syndicates Non-rated Syndicates Total Syndicates Mean Difference Tests
b
Mean S.E Mean S.E Mean S.E t-statistic z-statistic Size 18.7799 1.1592 17.5620 2.1261 18.3295 1.6895 6.5370*** –4.9933***
Leverage 1.2261 39.5161 –4.2587 31.1917 –0.9172 36.5375 1.3219 –3.8269 ***
Profitability 0.0700 0.0983 –0.0320 0.3554 0.0301 0.2397 3.8226*** –4.1390***
Liquidity 0.6878 0.1443 0.6139 0.2436 0.6590 0.1925 3.4338*** –1.3538
Reinsurance Dependence 0.1879 0.0941 0.0933 0.7194 0.1511 0.4561 1.8195* –0.1739
Marine Aviation and Transport 0.1052 0.1650 0.1147 0.1705 0.1089 0.1670 –0.4915 –0.5219
Property 0.1959 0.1764 0.1238 0.2170 0.1678 0.1961 3.2465*** –3.4912*** Liability 0.1827 0.2642 0.1871 0.3428 0.1844 0.2968 –0.1294 –0.7773 Reinsurance 0.3246 0.2677 0.4267 0.4741 0.3644 0.3651 –2.4522** –1.4739 Motor Damage 0.0603 0.1991 0.0411 0.1718 0.0528 0.1888 0.8867 –4.9832*** Miscellaneous 0.0941 0.2365 0.0738 0.2143 0.0862 0.2280 0.7728 –1.7799* Business Concentration 0.5022 0.2508 0.7565 1.1248 0.6014 0.7380 –3.0360*** –2.4988** Capitalization 0.1486 0.3213 3.9183 29.1411 1.6258 18.2920 –1.8032* –2.1028** Notes: a
We carry out independent samples t tests and Mann-Whitney U tests (also known as the Wilcoxon Rank Sum test) for all of the explanatory variables included in the models in order to determine whether there are any discernible differences in the means between rated and non-rated syndicates.
b
The t-statistics report the results of the independent samples t tests, whilst the z-statistics report the results of the Mann-Whitney U test. * indicates statistical significance at the 10% level; **indicates statistical significance at the 5% level; and *** indicates statistical significance at the 1% level.
Table 3 Correlation coefficient matrix
(A) (B) (C) (D) (E) (F) (G) (H) (I) (J) (K) (L) (M) (B) 0.35*** (C) 0.07 0.07 (D) 0.21*** 0.21*** 0.07 (E) 0.19*** 0.13** 0.08 0.23*** (F) 0.10* 0.09 –0.01 –0.05 0.08 (G) –0.03 0.21*** 0.06 0.10* 0.04 0.10* (H) 0.18*** 0.34*** 0.06 0.14** –0.07 0.12** 0.02 (I) –0.01 –0.11* 0.04 0.04 0.16*** 0.08 –0.11* –0.19*** (J) –0.14** –0.02 0.01 –0.02 –0.15*** –0.20*** –0.21*** –0.29*** –0.47*** (K) 0.05 0.05 –0.11* –0.24*** 0.18*** –0.04 –0.16*** –0.12** –0.15*** –0.04 (L) 0.04 –0.30*** –0.05 –0.01 –0.03 0.04 –0.14** –0.16*** –0.18*** –0.29*** –0.04 (M) –0.17*** –0.46*** –0.00 0.00 0.02 –0.09* –0.17*** –0.49*** 0.16*** 0.05 0.26*** 0.04 (N) –0.10* –0.24*** 0.01 0.03 0.05 0.16*** –0.05 –0.12** –0.21*** –0.01 0.26*** –0.03 0.23*** Notes: a
The table reports the Pearson correlation coefficients between the variables used in this study, which are denoted as: Rating (A); Size (B); Leverage (C); Profitability (D); Liquidity (E); Reinsurance Dependence (F); Marine Aviation and Transport (G); Property (H); Liability (I); Reinsurance (J); Motor Damage (K); Miscellaneous (L); Business Concentration (M); and Capitalization (N).
b
Table 4 Binary probit regression resultsa Variables Expected Sign Coefficient b Standard Error Constant –0.5164 0.4116 Size + 0.0022 ** 0.0010 Leverage +/– 0.0041 0.0026 Profitability + 1.4515 ** 0.6066 Liquidity + 1.2181 ** 0.4764 Reinsurance Dependence +/– 0.0023 ** 0.0009
Marine Aviation and Transport +/– –0.8649 ** 0.3712
Property +/– 0.5792 0.3946 Liability +/– 0.0083 0.2731 Reinsurance +/– –0.1211 0.2477 Motor Damage +/– 0.5394 0.4156 Miscellaneous +/– 0.3583 0.3217 Business Concentration – –0.5000 0.3273 Capitalization + –0.0017 0.0011
Log Likelihood Function –184.7226 Restricted Log Likelihood Function –217.4546 McFadden’s Pseudo-R2 0.1505 Chi-squared Statistic(p-value) 65.4638(0.0000000)*** Notes:
a
Year dummies are included within the regression, but the results are not reported here.
b
Table 5 Two-step ordered probit regression results
Variables Parameter Estimates Marginal Effects
Expected Sign Coeff.b S.E. Prob(Y=0) Prob(Y=1) Prob(Y=2) Prob(Y=3) Prob(Y=4)
Constant –23.1131 *** 4.6415 Size + 0.8805 *** 0.1080 –0.0705 –0.2572 0.2026 0.1235 0.0016 Leverage – 0.0104 0.0078 –0.0008 –0.0030 0.0024 0.0015 0.0000 Profitability + 11.7339 *** 3.0077 –0.9389 –3.4279 2.7002 1.6453 0.0212 Liquidity + 5.8812 ** 2.4894 –0.4706 –1.7181 1.3534 0.8247 0.0106 Reinsurance Dependence +/– –0.8785 *** 0.1089 0.0703 0.2566 –0.2022 –0.1232 –0.0016
Marine Aviation and Transport +/– –3.1965 * 1.7696 0.2558 0.9338 –0.7356 –0.4482 –0.0058
Property +/– 1.4951 1.1223 –0.1196 –0.4368 0.3441 0.2096 0.0027 Liability +/– –0.0499 0.3335 0.0040 0.0146 –0.0115 –0.0070 –0.0001 Reinsurance +/– –0.5052 0.3359 0.0404 0.1476 –0.1163 –0.0708 –0.0009 Motor Damage +/– 1.4094 1.1304 –0.1128 –0.4117 0.3243 0.1976 0.0025 Miscellaneous +/– 2.7752 *** 0.8503 –0.2221 –0.8107 0.6386 0.3891 0.0050 Business Concentration – –1.9362 1.1898 0.1549 0.5656 –0.4456 –0.2715 –0.0035 Capitalization + –0.0023 0.0019 0.0002 0.0007 –0.0005 –0.0003 0.0000 Inverse Mills Ratio +/– 7.5330 ** 3.6046 –0.6028 –2.2006 1.7335 1.0563 0.0136 Index Threshold
Parameters
μ1 1.4196 *** 0.1235
μ2 3.2298 *** 0.1556
μ3 5.0777 *** 0.3452
Log Likelihood Function –194.1620 Restricted Log Likelihood Function –256.8984
Chi-squared Statistic(p-value) 125.4726 (0.0000)***
Hit Ratio 0.5833
Notes:
a
The estimation results are reported for the two-step ordered Probit model with sample selection. Year dummies are included within the regression, but the results are not reported here.
b
SELF-EVALUATION
This project was satisfactorily conducted from 1 August 2012 to 31 October 2013. I have written a paper based on the results obtained