科技部補助專題研究計畫成果報告
期末報告
再保險多還是少比較好?
計 畫 類 別 : 個別型計畫 計 畫 編 號 : MOST 102-2410-H-004-029- 執 行 期 間 : 102 年 08 月 01 日至 103 年 10 月 31 日 執 行 單 位 : 國立政治大學風險管理與保險學系 計 畫 主 持 人 : 許永明 計畫參與人員: 大專生-兼任助理人員:吳雅岩 大專生-兼任助理人員:連嬿倪 博士班研究生-兼任助理人員:陳瑞祥 博士班研究生-兼任助理人員:蕭景元 報 告 附 件 : 出席國際會議研究心得報告及發表論文 處 理 方 式 : 1.公開資訊:本計畫可公開查詢 2.「本研究」是否已有嚴重損及公共利益之發現:否 3.「本報告」是否建議提供政府單位施政參考:否中 華 民 國 104 年 01 月 20 日
中 文 摘 要 : 大家普遍以為:使用再保險與衍生性金融商品來避險的險 人,會有較好的績效表現。我們利用英國產險公司 1994 至 2011 年的資料,研究保險公司的績效與其使用再保險與衍生 性金融商品的關係;同時也探討這些關係,會不會隨著公司 大小與期間而改變。我們發現:使用再保險比較多且有使用 衍生性金融商品的小公司,比較難提高其市場佔有率,特別 是在危機期間。然而,我們卻沒有發現大公司或在非危機期 間,有上述這樣的情形發生。 中文關鍵詞: 再保險;衍生性商品;績效;小型產險公司
英 文 摘 要 : It is the public's perception that insurers which use reinsurance and derivative hedging have better performance. Using regulatory returns data on UK non-life insurers from 1994 to 2011, this paper
empirically examines whether insurer performance is related to the use of reinsurance and derivatives and how this relation varies across different size
classes and time periods. We find that small insurers that use more reinsurance and engage in derivative transactions are more difficult to improve their market share. This is particularly the case during crisis periods. However, we do not find any such evidence for large insurers or during non-crisis times. Our analysis sheds some light on the effect of reinsurance and derivative use by small insurers on their performance.
英文關鍵詞: Reinsurance; Derivatives; Performance; Small non-life insurers
1
How Does the Use of Reinsurance and Derivatives Affect Insurer
Performance? Evidence from the United Kingdom Non-life Insurance
Industry
ABSTRACT
It is the public’s perception that insurers which use reinsurance and derivative hedging have better
performance. Using regulatory returns data on UK non-life insurers from 1994 to 2011, this paper
empirically examines whether insurer performance is related to the use of reinsurance and
derivatives and how this relation varies across different size classes and time periods. We find that
small insurers that use more reinsurance and engage in derivative transactions are more difficult to
improve their market share. This is particularly the case during crisis periods. However, we do not
find any such evidence for large insurers or during non-crisis times. Our analysis sheds some light
on the effect of reinsurance and derivative use by small insurers on their performance.
2
How Does the Use of Reinsurance and Derivatives Affect Insurer
Performance?
INTRODUCTION
Recent studies on reinsurance determinants have fostered an improved understanding of why
primary insurers may use reinsurance (e.g., Mayers and Smith, Jr., 1990; Hoerger, Sloan, and
Hassan, 1990; Adams, 1996; Garven, and Lamm-Tennant, 2003; Cole and McCullough, 2006;
Powell and Sommer, 2007; Kader, Adams, and Mouratidis, 2010; Shiu, 2011) and derivatives (e.g.,
Colquitt and Hoyt, 1997; Hardwick and Adams, 1999; Cummins, Phillips and Smith, 1999;
Cummins, Phillips and Smith, 2001, Shiu, 2007). However, very little research has focused on
whether reinsurance and derivative hedging affects insurer performance, except Lee and Lee (2012)
and Shiu (2010), respectively. Lee and Lee (2012) document a negative effect of reinsurance
purchase on insurer performance in terms of return on assets. Shiu (2010) finds that non-life
insurers using derivative hedging have a lower level of solvency.
Reinsurance has traditionally been one of the major risk management tools for primary non-life
insurers to transfer underwriting risk. It is the public’s perception that reinsurance hedging is good
for insurers. In reality, however, is reinsurance instrumental in improving insurer various aspects of
3
stabilize underwriting results, provide protection against catastrophe losses, increase earning,
reduce expected tax payments, and obtain real services from reinsurers. Reinsurance purchase thus
reduces costs for capital.
However, there is a cost for reinsurance. As a matter of fact, it is very costly (Froot, 2001; Cummins,
Dionne, Gagné and Nouira, 2008). It seems that insurer managers have to strike a balance between
reducing insolvency risk and decreasing potential profitability when making reinsurance decisions
(Shiu, 2004). While the use of reinsurance may strengthen insurers’ financial position, we expect
that reinsurance may damages their other aspects of performance. Under the signal hypothesis,
however, Chen, Hamwi, and Hudson (2001) argue that an insurer that overly uses reinsurance may
signal its excessively high risk and eventually high likelihood of insolvency.
According to Swiss Reinsurance Company (2012: 36-37), the UK non-life insurance industry
generated annual premiums of £68.29 billion (US$ 109.49 billion) in 2011. This volume accounts
for 5.56 percent of all worldwide non-life insurance premium income. Moreover, in terms of
premium volume, the UK non-life sector was ranked second in Europe (after Germany) and fourth
in the world (after the US, Japan and Germany).
According to regulations, UK insurers are not permitted to engage in derivative transactions for
4
manage portfolios (Campbell, Goldberg and Rai, 2003; Shiu, 2007; Philpott, 2012). Like
reinsurance, the cost for setting up platform and hiring professionals for derivative transactions
generally is huge. On balance, we expect that reinsurance and derivative hedging has a negative
impact on insurer performance. In this paper, we attempt to explore empirically whether our
expectation is supported by the data within the analysis period.
The motivation for this study is twofold. First, the effects of reinsurance and derivatives on insurer
performance have not been extensively examined. Most prior insurance literature except Lee and
Lee (2012) does not directly and specifically examine the relation between reinsurance hedging and
performance, but just control for reinsurance in their studies. Shiu (2010) is the only research that
examines the influence of derivative use in the context of insurance. The current study
simultaneously examines the effects of these two types of hedging on insurer performance and
hence can be used to fill the gap in the literature. The second motivation is that prior studies have
mixed results regarding the relation between hedging and performance. In our research, we argue
that this could be because the relation may vary among insurer size classes and between crisis and
non-crisis times.
We find that the use of reinsurance and derivatives exerts a negative influence on the percentage
change in market share of total admissible assets for small insurers, especially during crisis times.
5
times. Our study improves our understanding of reinsurance and derivative use by insurers.
The remainder of this paper is organized as follows. The next section reviews related theories and
develops hypotheses. We then describe the research methodology and framework used in this study.
The empirical results are presented in the penultimate section, whereas the last section concludes.
RELATED THEORIES AND HYPOTHESIS DEVELOPMENT
According to Modigliani and Miller’s propositions, risk management including reinsurance and
derivative hedging should be irrelevant in a frictionless world. In reality, however, imperfections
exist in capital markets and Modigliani and Miller’s propositions do not completely hold. Insurers
are therefore motivated to use reinsurance and derivatives to reduce the expected bankruptcy costs,
agency costs, underinvestment problem.1 Ma and Elango (2008) report that reinsurance as a risk
management mechanism can help primary insurers smooth the variations in their revenues, which
will then increase risk-adjusted returns.
However, reinsurance hedging involves huge cost, which may adversely affect insurer performance.
Froot (2001) finds that insurers pay a much higher reinsurance premium than the actuarial price of
the risk transferred. Cummins, et al., (2008) also point out that although reinsurance reduces the
volatility of insurers’ loss ratio, buying reinsurance increases significantly their cost. Using data on
6
UK non-life insurance firms, Shiu (2004) finds evidence supporting the notion that reinsurance
negatively affects the insurer’s investment yield and percentage change in shareholders’ funds. He
further argues that higher reinsurance dependence increases operational stability but reduces the
potential profitability. Shiu (2009) also documents a negative relation between UK life insurers’
reinsurance use and their investment yield. Choi and Elyasiani (2011) find that the use of
reinsurance by US non-life insurers reduces their revenue efficiency. Lee and Lee (2012) argue that
non-life insurers that rely more on reinsurance have worse return on assets. Moreover, under the
signal hypothesis Chen, Hamwi, and Hudson (2001) argue that it is difficult for a nearly insolvent
insurer to raise required capital in the financial markets at a low cost. The insurer would therefore
purchase reinsurance to rent capital from reinsurers in order to increase its underwriting capacity.
An insurer that overly uses reinsurance may signal its excessively high risk and eventually high
likelihood of insolvency. Further, insurers that are heavily dependent on reinsurance are highly
subject to reinsurer default risk. In addition, some prior studies (e.g., Choi and Weiss, 2005) do not
find a relation between reinsurance and insurer performance. Taken together, the empirical evidence
is inconclusive. However,
Finance literature has examined the effects of derivatives on risk (e.g. Hirtle, 1997; Guay, 1999;
Hentschel and Kothari, 2001) and firm value (e.g., Carter, Rogers and Simkins, 2006; Jin and Jorion,
2006). The empirical results are also mixed. For instance, Hirtle (1997) finds a positive relation
7
and Kothari (2001) find no significant relation. As regards the relation between derivative use and
firm value, Carter, Rogers and Simkins (2006) find that derivative hedging add value to the firm,
while Jin and Jorion (2006) find that hedging does not seem to affect firm value.
As far as the authors understand, there is little research investigating the effects of derivatives in the
context of insurance, except Shiu (2010). He finds that non-life insurers that use derivative hedging
can maintain a lower level of solvency. Like reinsurance hedging, however, derivative hedging is
also costly. The high hedging cost arises from not only derivative products themselves but also
setting a platform for derivative transactions purposes.
One of the possible reasons why empirical results vary is because the relation between hedging and
performance may change. Although our theoretical framework should hold for insurers for all times,
the negative relation between hedging and performance could vary across firms and periods of time.
Warner (1977) argues that financial distress costs do not increase proportionately with firm size,
indicating that smaller insurers are subject to higher bankruptcy costs than larger ones. Moreover,
smaller insurers generally have less cash flows and higher borrowing costs. They also have less
tolerance for risk and are more likely to encounter insolvency problems. Conversely, large insurers
are less likely to fail due to a tacit “too big to fail” policy that was operated in most jurisdictions and
hence insurers knew that they would be rescued if they became financially distressed. Therefore,
8
costs, which will then have an adverse effect on their performance. This case is particularly
pronounced for small insurers during crises. When the market is in turmoil, the supply of hedging
tools generally is limited. As a result, hedging costs would be particularly high. We therefore expect
that the use of reinsurance and derivatives negatively affect performance, in particular for small
insurers and during crisis times.
THE METHODOLOGY AND EMPIRICAL FRAMEWORK
Data
We use data from SynThesys Non-life provided by Standard and Poor’s. This data set contains
regulatory returns for UK non-life insurers from 1985 through 2011. Given that UK non-life
insurers only started using derivatives from 1994 onwards, the data used in this study covers only
the period from 1994 to 2011, with several data exclusion criteria, as used in prior research, being
applied. First, we exclude firms whose reinsurance assumed account for more than 75 percent of
total premium written (Cole and McCullough, 2006; Powell and Sommer, 2007; Shiu, 2011)
because these firms are more like reinsurers rather than primary insurers. We then exclude insurers
with non-positive total admissible assets and negative premiums in any of the six lines of business,
including accident and health, marine, aviation and transport, property, liability, financial loss and
motor. Since our paper is only focused on the UK non-life insurance industry, insurers which submit
global returns are excluded from this study. The resulting sample includes 94 insurers and 670
9
survivorship bias because all insurers that existed during the 1994-2011 period and filed complete
regulatory returns are included in the sample, even if they failed to survive until the end of the
analysis period.
Model
We perform the following regression to examine the marginal effect of reinsurance and derivatives
on insurer performance:
where the subscripts i and t denote insurer and year, respectively. We estimate the model using
ordinary least squares and random-effect regressions.2 The LM test statistics across all regression
specifications suggest that ordinary least squares regression is more appropriate than random-effect
regression. Thus, we only report the ordinary least squares regression results in the empirical results
section. Since observations come from a large number of cross-section insurers, heteroscedasticiy
might exist. We therefore report White’s heteroscedasticiy-consistent estimators (White, 1980).
Following Berger and Bouwman (2013), the performance measure is proxied by the percentage
change in the insurer’s market share of total admissible assets. Market share is an important
performance benchmark for financial institutions including banks and insurers (Aghion and Stein,
2008; Berger and Bouwman, 2013). Reinsurance denotes the purchase of reinsurance, proxied by
2 Since organization form, one of the control variables included in our model, is time-invariant, the model cannot be
10
the ratio of reinsurance premiums ceded to direct business written plus reinsurance assumed.
Unlike the reinsurance variable, the derivatives variable is a dummy variable, with a value of 1 for
users and 0 for non-users. We do not employ an extent proxy for the derivatives variable due to the
low level of derivative use in the non-life insurance industry.
Our variables of interest, including reinsurance and derivatives, are lagged relative to the dependent
variable, which is performance in our study. This approach alleviates the endogeneity problem
because lagged use of reinsurance/derivatives and current performance are less likely to be jointed
determined. All the control variables are also lagged.
We first run a regression using the whole sample. We then equally divide the whole sample into two
groups: small and large firms. We also divide our sample into two periods: crisis and non-crisis
periods. Following Berger and Bouwman (2013), the crisis period include two sub-periods. The
first covers from 2000 to 2002, during which the bursting of the dot.com bubble and the terrorist
attacks of September 11 occurred. The second sub-period is related to the subprime lending crisis,
covering from 2007 to 2009. The remainder of the whole period is the non-crisis period.
Control variables
Based on previous research (e.g, McNamara and Rhee, 1992; Lai and Limpaphayom, 2003; Elango,
11
may affect insurer performance in order to avoid omitted variables bias. They include leverage,
business mix, business concentration, marginal tax rates, tax convexity, liquidity, underwriting risk,
and organization form. The definitions for the variables used in our study are described in Table 1.
(Insert Table 1 around here)
Although insurers with higher level of leverage have higher probability of insolvency, high
leverage may make firm performance better or worse depending upon the operating situation of the
firm (Zou, 2010). In our study, leverage is proxied by the ratio of direct premiums written to
surplus. We expect that insurers with higher leverage have more premium income and thus are
more capable of increasing their market share.
The nature of an insurer’s product portfolio determines its investment portfolio and both portfolios
determine insurer performance. Prior studies on insurer performance (e.g., Elango, Ma and Pope,
2008) consider the effects of lines of business on performance to reflect risk and return differences
across lines. We measure the proportions of net earned premiums written in each of the following
six lines: accident and health, marine, aviation and transport, property, liability, financial loss and
motor. We do not provide an ex ante prediction regarding the effect business mix on performance.
12
non-life lines generally have so-called underwriting cycles. The performance of insurers with high
business concentration will mostly depends on the underwriting cycles of the very few lines on
which they concentrate. As a result, their performance would be relatively unstable compared with
those insurers which have a diversified business portfolio. If this is the case, highly concentrated
insurers would not be in a position to increase their market share. Another line of argument can be
also proposed from the perspective of comparative advantage. Insurers would performance well if
they concentrate on the business that they know well and have edge over their competitors. In this
case, insurers with higher business concentration would be more capable of increasing market share.
The net effect of business concentration on performance is therefore an empirical question. We
calculate the Herfindahl index of net premiums written to reflect the concentration of lines of
business.
Since the accounting performance of insurers is influenced by taxes to a great extent, we include
two tax-related variables, including marginal tax rates and tax convexity. We set the marginal tax
rate equal to top rate if the net operating loss in the previous year is 0 and taxable income in the
current year is greater than 0, and 0 otherwise (Adams, Hardwick and Zou, 2008; Shiu, 2011).
Although Insurers which are subject to top rate will pay higher taxes than those which are not, they
are considered to operate well and hence are more likely to improve their market share. We also
include tax convexity in our regressions. This variable is to account for the fact that non-life
13
facing convex tax schedule. By so doing, their accounting performance will be smoothed and their
ability to increase market share may be adversely affected. Following Adams, Hardwick and Zou
(2008) and Shiu (2011), we measure tax convexity by the excess of the marginal tax rate (defined
above) over the annual effective tax rate (total tax expenses ÷ annual taxable income).
Since their losses are more variable, non-life insurers need more liquidity than their life
counterparts. High liquidity can reduce liquidity risk for insurers and could help them increase their
market share when they want to. We therefore predict a positive relation between insurer
performance and liquidity. This variable is proxied by the ratio of liquid assets (sum of cash, bonds
and shares) to total admissible assets.
Underwriting risk is one of the major risks faced by non-life insurers. It is expected that insurers
with higher underwriting risk could be less likely to increase their market share. The underwriting
risk variable is proxied by the ratio of claims to earned premiums.
Prior studies (e.g., McNamara and Rhee, 1992; Lai and Limpaphayom, 2003; Elango, Ma and Pope,
2008) on insurer performance consider the effects of organizational form on performance. Mutual
insurers are considered to be efficient than stock insurers in controlling agency costs. However,
stock insurers have easier access to market capital and lower costs of raising new capital than
14
share. We include a dummy variable that equals one if the insurer is a stock firm, and 0 otherwise.
EMPIRICAL RESULTS
Univariate analysis
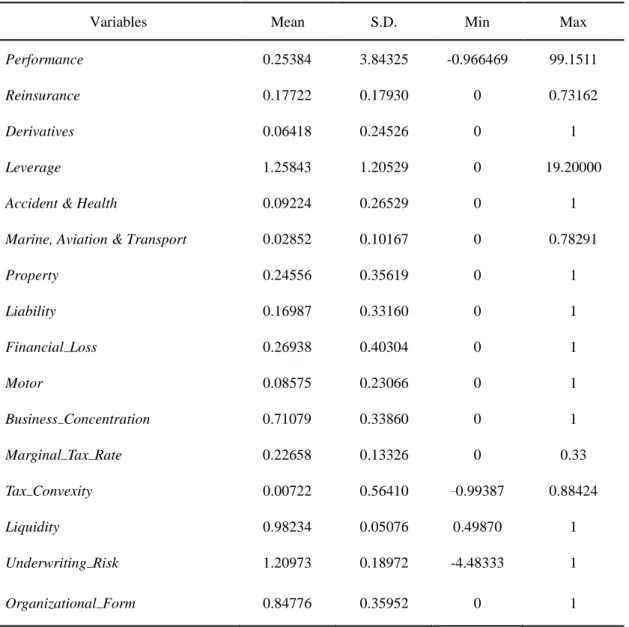
Table 2 presents summary statistics on all variables used in our analysis of the full sample. The
performance variable, measured by the percentage change in market share of total admissible assets,
ranges from -0.966469 to 99.1511 and has a standard deviation of 3.84325. This indicates that the
performance of the non-life insurers in our sample varies to a great extent. The sample firms
approximately reinsure an average of 17.72% of their annual direct business written and
reinsurance assumed. Approximately 6.42% of the firms participate in the derivative market. We
also find that some non-life insurers do not use either reinsurance or derivatives. The values for the
business mix variables, except accident & health, range from 0 to 1. This indicates that we have
specialist insurers as well as multiline insurance firms in our sample.
(Insert Table 2 around here)
In unreported results of the simple correlation coefficients, we find that in the full sample
reinsurance is positively, though insignificant at the 0.1 level, correlated with the performance with
a correlation coefficient of 0.034. However, the derivatives dummy is negatively correlated with
15
levels. In the sample of small insurers, however, we find that reinsurance is significantly negatively
related with performance at the 0.05 level, with a correlation coefficient of -0.148. The derivatives
dummy has an insignificant correlation coefficient of -0.061. In the sample of small insurers during
crisis times, the reinsurance variable has a significant correlation coefficient of -0.237 at the 0.01
level, while the derivatives dummy has an insignificant correlation coefficient of -0.137. Taken
together, it appears that the effects of reinsurance and derivatives are stronger for smaller insurers,
especially during crisis times.
Multivariate analysis
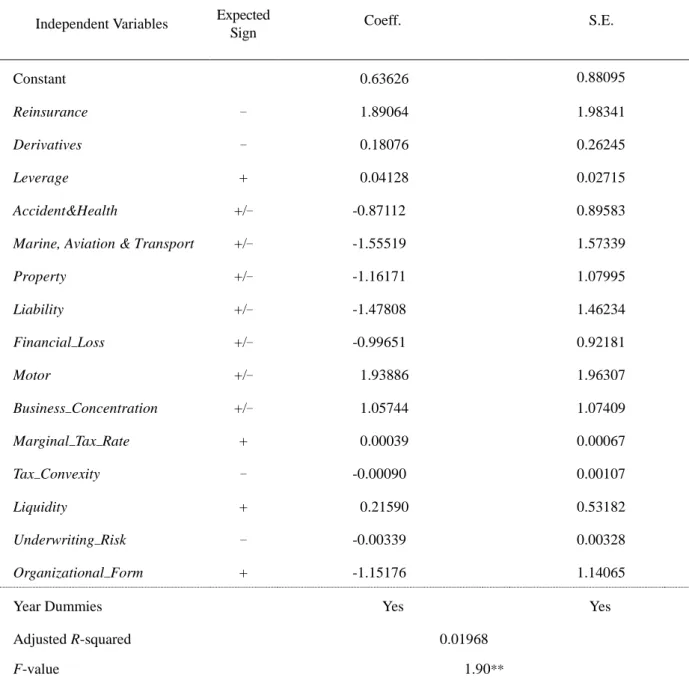
Table 3 presents the regression results for the full sample. The F-value for the overall goodness of
fit test is 1.90, statistically significant at the 0.05 level, confirming that the fitted model is better
than a null model without explanatory variables. The adjusted R2 is 0.01968. We report the White’s
heteroskedasticity-consistent standard errors. We do not find any significant explanatory variables,
including reinsurance and derivatives.
(Insert Table 3 around here)
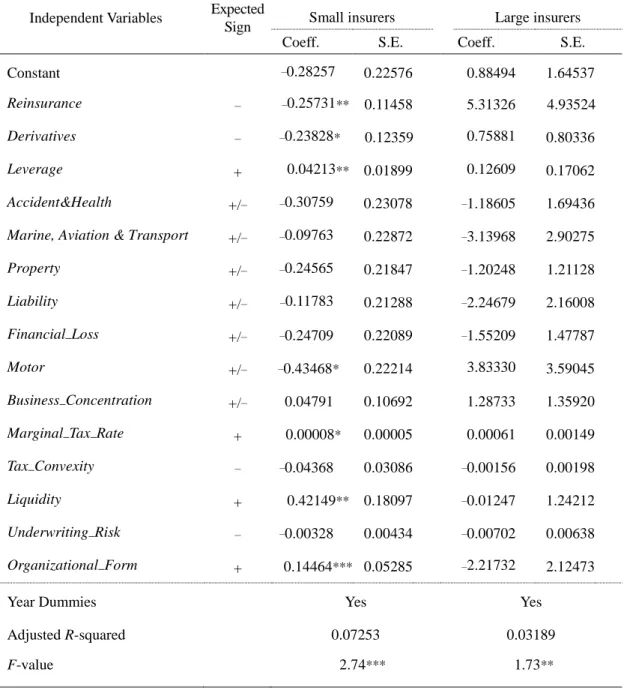
We then equally divide the full sample into two-subsamples: small and large insurers. The results
are presented in Table 4. F-tests for small and large insurers are both statistically significant and the
16
subsample for small firms reinsurance and derivatives have significantly negative effects on
performance at conventional levels, which supports the view that small insurers which use more
reinsurance or participate in the derivative markets could find it harder to improve their market
share. This negative relation is partly due to the fact of particularly high hedging costs for small
insurers. However, we find that reinsurance and derivatives are positively, thought insignificantly,
correlated with performance for large insurers.
(Insert Table 4 around here)
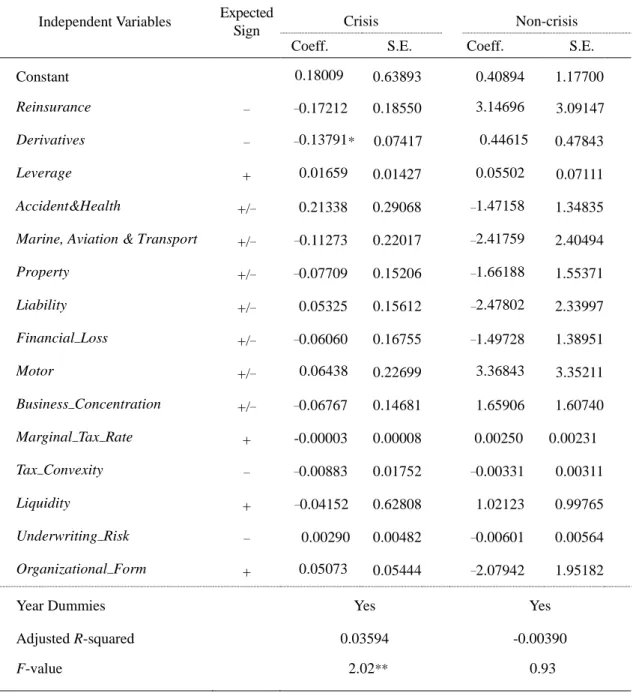
We also divide our whole sample period into two periods: crisis and non-crisis times. As shown in
Table 5, we document weak evidence on the negative relation between the derivatives dummy and
performance for the crisis period, suggesting that non-life insurers engaging in derivative
transactions are less likely to increase market share. Nevertheless, we do not find such evidence for
the non-crisis period.
(Insert Table 5 around here)
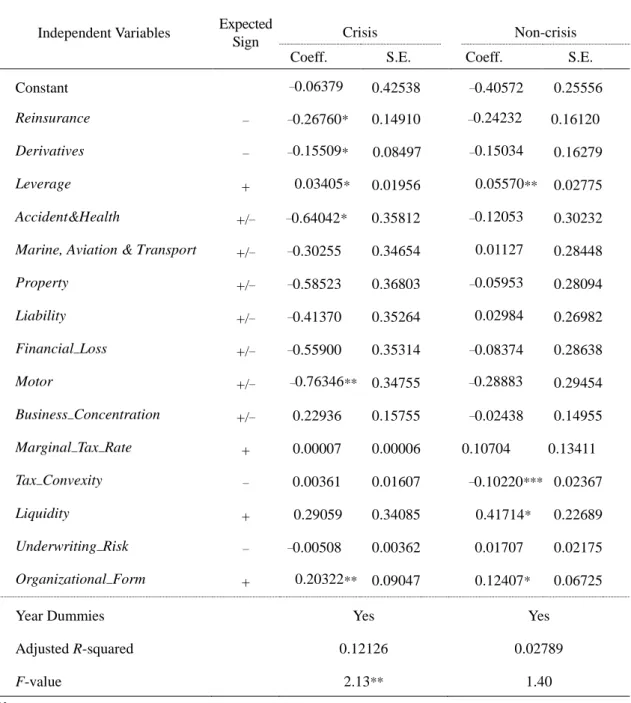
Next, we divide the full sample into four subgroups: small insurers during crisis times, small
insurers during non-crisis times, large insurers during crisis times and large insurers during
17
crisis times, the estimated coefficients of reinsurance and derivatives are both negative and
significant at the 0.1 level. The two variables still have negative, though insignificant, coefficients
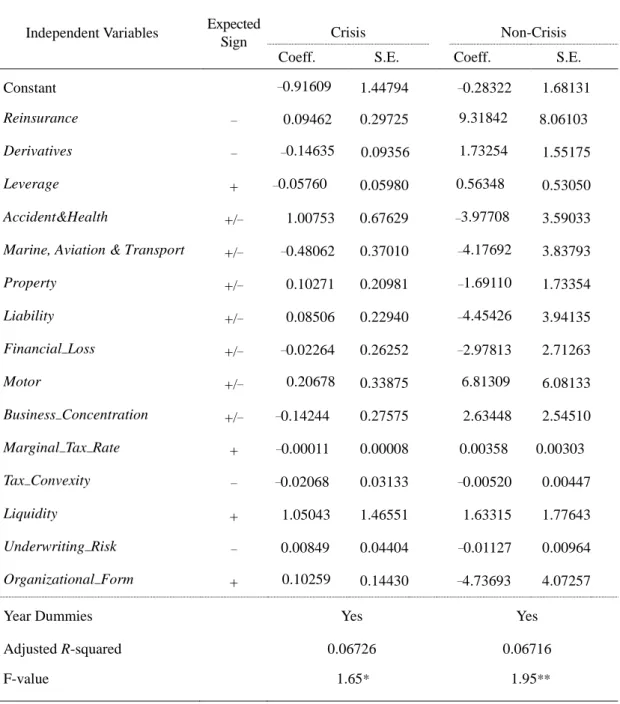
in the subsample of small insurers during non-crisis period. For large insurers whether in crisis or
non-crisis times, most of the coefficients on the reinsurance and derivatives variables are positive,
though insignificant. It appears that risk hedging benefits large insurers more than small insurers
especially during crisis times.
(Insert Tables 6 and 7 around here)
Our overall results have sensible economic interpretations. Reinsurance and derivatives are two risk
management tools used by non-life insurers to hedge underwriting and investment risks,
respectively. For smaller firms, bankruptcy and capital costs are higher. They are motivated to
hedge their risk in order to reduce these costs and hence have a greater demand for hedging
instruments, including reinsurance and derivatives. Other things being equal, they would be
charged a higher price for hedging instruments. It is generally accepted that the hedging cost would
be higher for smaller insurers, particularly during crisis times, because they are more likely to
become insolvent or default on their obligations.
For saving space, we only discuss the results of the control variables in the sample for small
18
significant at the 0.01 level. This evidence supports the notion that stock insurers are more likely to
increase their market share than mutual insurers. We also find that leverage is significantly
positively correlated with insurer performance at the 0.05 level, suggesting that highly-leveraged
insurers are in a better position to improve market share. The liquid variable is also positive and
statistically significant. This finding is consistent with the view that highly liquid insurers are more
likely to improve market share. We also find slight evidence indicating that business mix and
marginal tax rates have an influence on insurer performance.
CONCLUSION
In this paper, we examine whether the use of reinsurance and derivatives is related to insurer
performance. We further tests whether this relation may vary for small and large insurers and for
crisis and non-crisis times. Using data from a sample of UK non-life insurance companies from
1994 through 2001, we document a negative relation between small insurers’ use of reinsurance
and derivative and their percentage change in market share of total admissible assets. This is also
the case during the crisis times, including the years from 2000 to 2002 (the dot.com bubble and 911
attack) and from 2007 to 2009 (the subprime crisis). We, however, do not find such evidence for
large insurers or during non-crisis times. We partly attribute this to the fact that small insurers have
high hedging cost, especially in crisis times.
19
current research. Therefore, our results need to be interpreted with some caution. For instance, the
non-life insurance sector is a good research setting for testing the reinsurance-related argument
since reinsurance has been a traditional hedging instrument used by non-life insurers. However, this
setting potentially limits our ability to test the derivatives-related argument, given the generally
lower level of derivative use in the non-life insurance industry, compared with the life insurance
sector. Further research may thus seek to test further the relation between derivative use and insurer
performance in the life insurance industry.
REFERENCE
Adams, M. (1996) ‘The reinsurance decision in life insurance firms: An empirical test of the risk-bearing hypothesis’, Accounting and Finance 36: 15-30.
Adams, M., P. Hardwick, and H. Zou.(2008) ‘Reinsurance and corporate taxation in the United Kingdom life insurance industry’, Journal of Banking and Finance 32: 101-115.
Aghion, P. and Stein, J. (2008) ‘Growth vs. Margins: Destabilizing consequences of giving the stock market what it wants’, Journal of Finance 63: 1025-1058.
Berger, A. N. and Bouwman, C. H. S. (2013) ‘How does capital affect bank performance during financial crises?’Journal of Financial Economics 109: 146-176.
Browne, M. J., and Hoyt, R. E. (1995) ‘Economic and market predictors of insolvencies in the property-liability industry’, The Journal of Risk and Insurance 62: 309-327.
Browne, M. J., Carson, J. M. and Hoyt, R. E. (1999) ‘Economic and market predictors of insolvencies in the life-health insurance industry’, The Journal of Risk and Insurance 66: 643-659.
Campbell, C. J., L. Goldberg and A. Rai. (2003) ‘The impact of the European Union Insurance Directives on insurance company stocks’, Journal of Risk and Insurance 70: 125-67.
Carter, D. A., Rogers, D. A. and Simkins, B. J. (2006) ‘Does hedging affect firm value? Evidence from the US airline industry’, Financial Management 35(1): 53-86.
Chen, Y., I. S. Hamwi, and T. Hudson.(2001) ‘The effect of ceded reinsurance on solvency of primary insurers’, International Advances in Economic Research 7: 65-82.
20
Choi, B. P. and E. Elyasiani (2011) ‘Foreign-owned insurer performance in the US property-liability markets’, Applied Economics 43: 291-306.
Choi, B. P. and M. A. Weiss. (2005) ‘An empirical investigation of market structure, efficiency, and performance in property-liability insurance’, Journal of Risk and Insurance 72(4): 635-673. Cole, C. R., and K. A. McCullough.(2006) ‘A reexamination of the corporate demand for
reinsurance’, Journal of Risk and Insurance 73: 169-192.
Colquitt, L. L. and Hoyt, R. E. (1997) ‘Determinants of corporate hedging behaviour: Evidence from the life insurance industry’, Journal of Risk and Insurance 64: 649-71.
Cummins, J. D., G. Dionne, R. Gagn and A. Nouira. (2008) ‘The cost and benefits of reinsurance’,
working paper, available at SSRN http://papers.ssrn.com/sol3/papers.cfm?abstract_id=1142954, accessed on 24 December 2013.
Cummins, J. D., Phillips, R. D. and Smith, S. D. (1997) ‘Corporate hedging in the insurance industry: The use of financial derivatives by US insurers’, North American Actuarial Journal 1: 13-40.
Cummins, J. D., Phillips, R. D. and Smith, S. D. (2001) ‘Derivatives and corporate risk management: Participation and volume decisions in the insurance industry’, Journal of Risk and
Insurance 68: 51-91.
Elango, B., Ma, Y. and N. Pope. (2008) ‘An investigation into the diversification-performance relationship in the U.S. property-liability insurance industry’, Journal of Risk and Insurance
75(3): 567-591.
Froot, K. A. (2001) ‘The market for catastrophe risk: A clinical examination’, Journal of Financial
Economics 60: 529-571.
Garven, J. R., and J. Lamm-Tennant. (2003) ‘The demand for reinsurance: Theory and empirical tests’, Insurance and Risk Management 71: 217-238.
Guay, W. R. (1999) ‘The impact of derivatives on firm risk: An empirical examination of new derivatives users’, Journal of Accounting and Economics 26: 319-51.
Hardwick, P. and Adams, M. (1999) ‘The determinants of financial derivatives use in the United Kingdom life insurance industry’, Abacus 35: 163-84.
He, E., D. W. Sommer and X. Xie. (2011) ‘The impact of CEO turnover on the property-liability insurer performance’, Journal of Risk and Insurance 78(3): 586-608.
Hentschel, L. and S. P. Kothari.(2001) ‘Are corporations reducing or taking risks with derivatives?’Journal of Financial and Quantitative Analysis 36: 93-118.
Hirtle, B. J. (1997) ‘Derivatives, portfolio composition and bank holding company interest rate risk exposure’, Journal of Financial Services Research 12: 243-66.
Hoerger, T. J., F. A. Sloan, and M. Hassan.(1990) ‘Loss volatility, bankruptcy, and the demand for reinsurance’, Journal of Risk and Uncertainty 3: 221-245.
International insurance monitor. (1996) ‘Financial reinsurance: Legal or tax dodge?’4th Quarter 1996 49(4): 2-3.
21 Journal of Finance 61: 893-919.
Kader, H. A., Adams, M. and Mouratidis, K. (2010) ‘Testing for trade-offs in the reinsurance decision of U.K. life insurance firms’, Journal of Accounting, Auditing & Finance 25(3): 491-522.
Lai, G. C. and P. Limpaphayon. (2003) ‘Organizational structure and performance: Evidence from the non-life insurance industry in Japan’, Journal of Risk and Insurance 70(4): 735-757.
Lee, H. and Lee, C. (2012) ‘An analysis of reinsurance and firm performance: Evidence from the Taiwan property-liability insurance industry’, Geneva Papers on Risk and Insurance-Issues and
Practice 37: 467-484.
Ma, Y. and B. Elango.(2008) ‘When do international operations lead to improved performance? An analysis of property-liability insurers’, Risk Management and Insurance Review 11(1): 141-155. Mayers, D. and C. W. Smith, Jr. (1990) ‘On the corporate demand for insurance: Evidence from
reinsurance market’, Journal of Business 63: 19-40.
McNamara, M. J. and S. G. Rhee. (1992) ‘Ownership structure and performance: The demutualization of life insurers’, Journal of Risk and Insurance 59: 221-238.
Philpott, J. (2012) ‘FSA insurance returns, edition 3.6’, Ernst and Young LLP.
Powell, L. S. and D. W. Sommer. (2007) ‘Internal versus external capital markets in the insurance industry: The role of reinsurance’, Journal of Finance Services Research 31: 173-188.
Shiu, Y. (2004) ‘Determinants of United Kingdom general insurance company performance’,
British Actuarial Journal 10: 1079-1110.
Shiu, Y. (2005) ‘The determinants of solvency in the United Kingdom life insurance market’,
Applied Economics Letters 12: 339-344.
Shiu, Y. (2007) ‘An empirical investigation on derivatives usage: Evidence from the United Kingdom general insurance industry’, Applied Economic Letters 14: 353-360.
Shiu, Y. (2009) ‘Economic factors, firm characteristics and performance: A panel data analysis for United Kingdom life offices’, Applied Economic Letters 16: 1033-1037.
Shiu, Y. (2010) ‘Derivative hedging and insurer solvency: Evidence from Taiwan’, Geneva Papers
on Risk and Insurance-Issues and Practice 35: 469-483.
Shiu, Y. (2011) ‘Reinsurance and capital structure: Evidence from the United Kingdom non-life insurance industry’, Journal of Risk and Insurance 78: 475-494.
Swiss Reinsurance Company. (2012) ‘World insurance in 2011’, Sigma 3:1-44.
Warner, J. B. (1977) ‘Bankruptcy costs: Some evidence’, Journal of Finance 32: 337-47.
White, H. (1980) ‘A heteroskedasticity-consistent covariance matrix estimator and a direct test of heteroskedasticity’, Econometrica 48: 817-838.
Zou, H. (2010) ‘Hedging affecting firm value via financing and investment: Evidence from property insurance use’, Financial Management, 39: 965-995.
22
Table 1 Variable descriptions
Variables Description Dependent Variable
Performance The percentage change in market share of total admissible assets. Explanatory Variables
Reinsurance The ratio of reinsurance premiums ceded to direct business written plus reinsurance assumed.
Derivatives Derivative user = 1; Derivative non-users = 0 Leverage The ratio of direct premiums written to surplus
Business_Mix
The proportions of net earned premiums written in each of the six lines of business, comprising of accident and health, marine, aviation and transport, property, liability, financial loss and motor.
Business_Concentration The Herfindahl index of the concentration of lines of business using net premiums written by the insurer in the line of business.
Marginal_Tax_Rate Top rate if the net operating loss in the previous year = 0 and taxable income in the current year >0; otherwise 0.
Tax_Convexity
The excess of the marginal tax rate (top rate if the net operating loss in the previous year = 0 and taxable income in the current year >0; otherwise 0) over the annual effective tax rate (total tax expenses÷ annual taxable income)
Liquidity The ratio of liquid assets (sum of cash, bonds and shares) to total admissible assets
Underwriting_Risk The ratio of claims to earned premiums Organizational_Form Stock insurers = 1; Mutual insurers = 0
23
Table 2 Summary statistics
Variables Mean S.D. Min Max Performance 0.25384 3.84325 -0.966469 99.1511 Reinsurance 0.17722 0.17930 0 0.73162
Derivatives 0.06418 0.24526 0 1
Leverage 1.25843 1.20529 0 19.20000 Accident & Health 0.09224 0.26529 0 1 Marine, Aviation & Transport 0.02852 0.10167 0 0.78291
Property 0.24556 0.35619 0 1
Liability 0.16987 0.33160 0 1
Financial_Loss 0.26938 0.40304 0 1
Motor 0.08575 0.23066 0 1
Business_Concentration 0.71079 0.33860 0 1 Marginal_Tax_Rate 0.22658 0.13326 0 0.33 Tax_Convexity 0.00722 0.56410 –0.99387 0.88424 Liquidity 0.98234 0.05076 0.49870 1 Underwriting_Risk 1.20973 0.18972 -4.48333 1 Organizational_Form 0.84776 0.35952 0 1
24
Table 3 Regression results for all sample
Independent Variables Expected
Sign Coeff. S.E.
Constant 0.63626 0.88095
Reinsurance – 1.89064 1.98341
Derivatives – 0.18076 0.26245
Leverage + 0.04128 0.02715
Accident&Health +/– -0.87112 0.89583 Marine, Aviation & Transport +/– -1.55519 1.57339 Property +/– -1.16171 1.07995 Liability +/– -1.47808 1.46234 Financial_Loss +/– -0.99651 0.92181
Motor +/– 1.93886 1.96307
Business_Concentration +/– 1.05744 1.07409 Marginal_Tax_Rate + 0.00039 0.00067 Tax_Convexity – -0.00090 0.00107
Liquidity + 0.21590 0.53182
Underwriting_Risk – -0.00339 0.00328 Organizational_Form + -1.15176 1.14065
Year Dummies Yes Yes
Adjusted R-squared 0.01968
F-value 1.90**
Notes:
a
The heteroskedasticity-consistent estimates are derived by using a heteroskedasticity corrected covariance matrix (White, 1980).
b
*** indicates statistical significance at the 1 per cent level; ** indicates statistical significance at the 5 per cent level; and * indicates statistical significance at the 10 per cent level.
25
Table 4 Regression results for small and large insurers
Independent Variables Expected
Sign Small insurers Large insurers Coeff. S.E. Coeff. S.E. Constant –0.28257 0.22576 0.88494 1.64537 Reinsurance – –0.25731** 0.11458 5.31326 4.93524 Derivatives – –0.23828* 0.12359 0.75881 0.80336 Leverage + 0.04213** 0.01899 0.12609 0.17062 Accident&Health +/– –0.30759 0.23078 –1.18605 1.69436 Marine, Aviation & Transport +/– –0.09763 0.22872 –3.13968 2.90275 Property +/– –0.24565 0.21847 –1.20248 1.21128 Liability +/– –0.11783 0.21288 –2.24679 2.16008 Financial_Loss +/– –0.24709 0.22089 –1.55209 1.47787 Motor +/– –0.43468* 0.22214 3.83330 3.59045 Business_Concentration +/– 0.04791 0.10692 1.28733 1.35920 Marginal_Tax_Rate + 0.00008* 0.00005 0.00061 0.00149 Tax_Convexity – –0.04368 0.03086 –0.00156 0.00198 Liquidity + 0.42149** 0.18097 –0.01247 1.24212 Underwriting_Risk – –0.00328 0.00434 –0.00702 0.00638 Organizational_Form + 0.14464*** 0.05285 –2.21732 2.12473
Year Dummies Yes Yes
Adjusted R-squared 0.07253 0.03189 F-value 2.74*** 1.73**
Notes:
a
The heteroskedasticity-consistent estimates are derived by using a heteroskedasticity corrected covariance matrix (White, 1980).
b
*** indicates statistical significance at the 1 per cent level; ** indicates statistical significance at the 5 per cent level; and * indicates statistical significance at the 10 per cent level.
26
Table 5 Regression results for crisis and non-crisis periods
Independent Variables Expected
Sign Crisis Non-crisis Coeff. S.E. Coeff. S.E. Constant 0.18009 0.63893 0.40894 1.17700 Reinsurance – –0.17212 0.18550 3.14696 3.09147 Derivatives – –0.13791* 0.07417 0.44615 0.47843 Leverage + 0.01659 0.01427 0.05502 0.07111 Accident&Health +/– 0.21338 0.29068 –1.47158 1.34835 Marine, Aviation & Transport +/– –0.11273 0.22017 –2.41759 2.40494 Property +/– –0.07709 0.15206 –1.66188 1.55371 Liability +/– 0.05325 0.15612 –2.47802 2.33997 Financial_Loss +/– –0.06060 0.16755 –1.49728 1.38951 Motor +/– 0.06438 0.22699 3.36843 3.35211 Business_Concentration +/– –0.06767 0.14681 1.65906 1.60740 Marginal_Tax_Rate + -0.00003 0.00008 0.00250 0.00231 Tax_Convexity – –0.00883 0.01752 –0.00331 0.00311 Liquidity + –0.04152 0.62808 1.02123 0.99765 Underwriting_Risk – 0.00290 0.00482 –0.00601 0.00564 Organizational_Form + 0.05073 0.05444 –2.07942 1.95182
Year Dummies Yes Yes
Adjusted R-squared 0.03594 -0.00390 F-value 2.02** 0.93
Notes:
a
The heteroskedasticity-consistent estimates are derived by using a heteroskedasticity corrected covariance matrix (White, 1980).
b
*** indicates statistical significance at the 1 per cent level; ** indicates statistical significance at the 5 per cent level; and * indicates statistical significance at the 10 per cent level.
27
Table 6 Regression results for small insurers during crisis and non-crisis periods
Independent Variables Expected
Sign Crisis Non-crisis Coeff. S.E. Coeff. S.E. Constant –0.06379 0.42538 –0.40572 0.25556 Reinsurance – –0.26760* 0.14910 –0.24232 0.16120 Derivatives – –0.15509* 0.08497 –0.15034 0.16279 Leverage + 0.03405* 0.01956 0.05570** 0.02775 Accident&Health +/– –0.64042* 0.35812 –0.12053 0.30232 Marine, Aviation & Transport +/– –0.30255 0.34654 0.01127 0.28448 Property +/– –0.58523 0.36803 –0.05953 0.28094 Liability +/– –0.41370 0.35264 0.02984 0.26982 Financial_Loss +/– –0.55900 0.35314 –0.08374 0.28638 Motor +/– –0.76346** 0.34755 –0.28883 0.29454 Business_Concentration +/– 0.22936 0.15755 –0.02438 0.14955 Marginal_Tax_Rate + 0.00007 0.00006 0.10704 0.13411 Tax_Convexity – 0.00361 0.01607 –0.10220*** 0.02367 Liquidity + 0.29059 0.34085 0.41714* 0.22689 Underwriting_Risk – –0.00508 0.00362 0.01707 0.02175 Organizational_Form + 0.20322** 0.09047 0.12407* 0.06725
Year Dummies Yes Yes
Adjusted R-squared 0.12126 0.02789
F-value 2.13** 1.40
Notes:
a
The heteroskedasticity-consistent estimates are derived by using a heteroskedasticity corrected covariance matrix (White, 1980).
b
*** indicates statistical significance at the 1 per cent level; ** indicates statistical significance at the 5 per cent level; and * indicates statistical significance at the 10 per cent level.
28
Table 7 Regression results for large insurers during crisis and non-crisis periods
Independent Variables Expected
Sign Crisis Non-Crisis Coeff. S.E. Coeff. S.E. Constant –0.91609 1.44794 –0.28322 1.68131 Reinsurance – 0.09462 0.29725 9.31842 8.06103 Derivatives – –0.14635 0.09356 1.73254 1.55175 Leverage + –0.05760 0.05980 0.56348 0.53050 Accident&Health +/– 1.00753 0.67629 –3.97708 3.59033 Marine, Aviation & Transport +/– –0.48062 0.37010 –4.17692 3.83793 Property +/– 0.10271 0.20981 –1.69110 1.73354 Liability +/– 0.08506 0.22940 –4.45426 3.94135 Financial_Loss +/– –0.02264 0.26252 –2.97813 2.71263 Motor +/– 0.20678 0.33875 6.81309 6.08133 Business_Concentration +/– –0.14244 0.27575 2.63448 2.54510 Marginal_Tax_Rate + –0.00011 0.00008 0.00358 0.00303 Tax_Convexity – –0.02068 0.03133 –0.00520 0.00447 Liquidity + 1.05043 1.46551 1.63315 1.77643 Underwriting_Risk – 0.00849 0.04404 –0.01127 0.00964 Organizational_Form + 0.10259 0.14430 –4.73693 4.07257
Year Dummies Yes Yes
Adjusted R-squared 0.06726 0.06716 F-value 1.65* 1.95**
Notes:
a
The heteroskedasticity-consistent estimates are derived by using a heteroskedasticity corrected covariance matrix (White, 1980).
b
*** indicates statistical significance at the 1 per cent level; ** indicates statistical significance at the 5 per cent level; and * indicates statistical significance at the 10 per cent level.
科技部補助專題研究計畫出席國際學術會議心得報告
日期:104 年 1 月 16 日計畫編號
MOST 102-2410-H-004-029
計畫名稱
再 保 險 多 還 是 少 比 較 好 ?
出國人員
姓名
許永明
服務機構
及職稱
政治大學風險管理與保險
學系教授
會議時間
103 年 7 月 27 日
至 103 年 7 月 30
日
會議地點
俄羅斯莫斯科
會議名稱
(中文) 亞太風險與保險學會 2014 年會
(英文) Asia-Pacific Risk and Insurance Association 2014 Annual
Meeting
發表題目
(中文) 使用再保險與衍生性商品對績效的影響
(英文) How Does the Use of Reinsurance and Derivatives Affect
Insurer Performance?
一、參加會議經過
On 26 July 2014 I started my journal from Taipei and arrived at Moscow, Russia on the 27th. The purpose of this journal is to attend Asia-Pacific Risk and Insurance Association 2012 Annual Meeting. This meeting began from 27 to 30 July, 2014.
The conference was held at the Moscow State University (MSU). The first day of the conference started with a welcome reception at Atrium of the MSU Faculty of Economics. From the 28the onwards to the last day of the conference, there were seven concurrent sessions in total, including Sessions A to G.
I presented my paper entitled “How Does the Use of Reinsurance and Derivatives Affect Insurer Performance?”on 28 August. My paper is scheduled under the session of “Reinsurance”, chaired by Professor Tim Jeffrey Query from New Mexico State University. We had four papers in this session. The conference did not assign a discussant for each paper. However, conference attendants offered a number of suggestions for further improving and enriching my paper.
二、與會心得
The Asia-Pacific Risk and Insurance Association Annual Meeting is one of the largest academic conferences in the field of risk management and insurance in the world. To my knowledge, many risk and insurance professionals including scholars and researchers in this field attend this conference every year. This conference provides a chance for attendants to know and converse with each other.
paper presented. However, the presenter can know his or her paper better by simply preparing for the presentation. This would be one of the benefits of attending conferences. Besides, attending conferences also provides an opportunity to know the latest research topics in the relevant field. Maybe good research ideas can be generated from listening to other conference attendants’ presentations.
三、發表論文全文或摘要
It is the public’s perception that insurers which use reinsurance and derivative hedging have better
performance. Using regulatory returns data on UK non-life insurers from 1994 to 2011, this paper
empirically examines whether insurer performance is related to the use of reinsurance and
derivatives and how this relation varies across different size classes and time periods. We find that
small insurers that use more reinsurance and engage in derivative transactions are more difficult to
improve their market share. This is particularly the case during crisis periods. However, we do not
find any such evidence for large insurers or during non-crisis times. Our analysis sheds some light
on the effect of reinsurance and derivative use by small insurers on their performance.
四、建議
五、攜回資料名稱及內容
A copy of conference brochure.
六、其他
科技部補助計畫衍生研發成果推廣資料表
日期:2015/01/16科技部補助計畫
計畫名稱: 再保險多還是少比較好? 計畫主持人: 許永明 計畫編號: 102-2410-H-004-029- 學門領域: 財務無研發成果推廣資料
102 年度專題研究計畫研究成果彙整表
計畫主持人:許永明 計畫編號: 102-2410-H-004-029-計畫名稱:再保險多還是少比較好? 量化 成果項目 實際已達成 數(被接受 或已發表) 預期總達成 數(含實際 已達成數) 本計畫 實際貢 獻百分 比 單位 備註(質 化 說 明:如 數 個 計 畫 共 同 成 果 、 成 果 列 為 該 期 刊 之 封 面 故 事 ... 等) 期刊論文 0 0 100% 研究報告/技術報告 0 0 100% 研討會論文 1 1 100% 篇 已經以''''How Does Reinsurance and Derivative Hedging Affect Insurer Performance?''''投稿 Geneva Papers on Risk and Insurance: Issues and Practice, 也 已經得到主編回覆,目 前正在依據評審委員 意見進行第一次修改。 論文著作 專書 0 0 100% 申請中件數 0 0 100% 專利 已獲得件數 0 0 100% 件 件數 0 0 100% 件 技術移轉 權利金 0 0 100% 千元 碩士生 0 0 100% 博士生 2 2 100% 另有大專生兩名兼任 助理協助計畫行政相 關事宜。 博士後研究員 0 0 100% 國內 參與計畫人力 (本國籍) 專任助理 0 0 100% 人次 期刊論文 0 0 100% 研究報告/技術報告 0 0 100% 研討會論文 0 0 100% 篇 論文著作 專書 0 0 100% 章/本 申請中件數 0 0 100% 專利 已獲得件數 0 0 100% 件 件數 0 0 100% 件 技術移轉 權利金 0 0 100% 千元 碩士生 0 0 100% 博士生 0 0 100% 國外 參與計畫人力 (外國籍) 人次
專任助理 0 0 100% 其他成果