行政院國家科學委員會專題研究計畫 成果報告
庫藏股制度實施前後證券相關稅收的影響:家計單位投資行
為與公司股利政策之分析(2/2)
計畫類別: 個別型計畫 計畫編號: NSC94-2416-H-004-005- 執行期間: 94 年 08 月 01 日至 95 年 07 月 31 日 執行單位: 國立政治大學財務管理學系 計畫主持人: 劉玉珍 報告類型: 完整報告 報告附件: 出席國際會議研究心得報告及發表論文 處理方式: 本計畫涉及專利或其他智慧財產權,2 年後可公開查詢中 華 民 國 95 年 7 月 31 日
Taxes and Dividend Clientele:
Evidence from Trading and Ownership Structure
Yi-Tsung Lee* Yu-Jane Liu* Richard Roll** Avanidhar Subrahmanyam** July 8, 2006 JEL Classifications: G12, G35 Keywords: Dividends, clientele effect
Abstract
Previous support for a dividend clientele effect has been inferred mainly from asset pricing models, market price behavior on ex-dividend days, and other indirect phenomena. Although dividend clientele have been studied over several decades, their existence remains controversial. In this paper, we study the interaction of dividends and taxes by exploiting a unique dataset from Taiwan, where the capital gains tax is zero, and which categorizes individual investors by their likely tax bracket. We report how investors respond to changes in dividend payout policy and to what extent they hold heterogeneous portfolios. There is strong evidence of a clientele effect. Agents subject to high rates of taxation on dividends (and zero taxation on capital gains) tend to hold stocks with lower dividends and sell (buy) stocks that raise (lower) dividends. Agents in lower tax brackets behave in the opposite manner. When share repurchases became legal in Taiwan in 2000, many firms responded. Firms with higher concentrations of more heavily taxed shareholders were more apt to begin repurchase programs.
Lee Liu Roll Subrahmanyam
Address
National Chengchi University 64, Chi Nan Road., Sec. 2
Mucha, Taipei 11623 Taiwan, R.O.C.
The Anderson School at UCLA 110 Westwood Plaza Los Angeles, CA 90095-1481
U.S.A.
E-mail [email protected] [email protected] [email protected] [email protected]
Voice 886-2-2939-3091 1-310-825-6118 1-310-825-5355
Taxes and Dividend Clientele:
Evidence from Trading and Ownership Structure
Abstract
Previous support for a dividend clientele effect has been inferred mainly from asset pricing models, market price behavior on ex-dividend days, and other indirect phenomena. Although dividend clientele have been studied over several decades, their existence remains controversial. In this paper, we study the interaction of dividends and taxes by exploiting a unique dataset from Taiwan, where the capital gains tax is zero, and which categorizes individual investors by their likely tax bracket. We report how investors respond to changes in dividend payout policy and to what extent they hold heterogeneous portfolios. There is strong evidence of a clientele effect. Agents subject to high rates of taxation on dividends (and zero taxation on capital gains) tend to hold stocks with lower dividends and sell (buy) stocks that raise (lower) dividends. Agents in lower tax brackets behave in the opposite manner. When share repurchases became legal in Taiwan in 2000, many firms responded. Firms with higher concentrations of more heavily taxed shareholders were more apt to begin repurchase programs.
I. Dividends, Taxes, Asset Pricing and Clientele.
Whenever dividends and capital gains are differentially taxed, it seems plausible that
equity investors would arrange themselves into heterogeneous classes, or “clientele,” by
their effective tax brackets. In many countries, dividends are more heavily taxed than
capital gains, so highly taxed investors should favor firms with lower dividend payout
ratios, ceteris paribus. Investors subject to lower effective tax rates should behave in a
complementary fashion and thus favor firms with higher payout ratios.
Differential taxation of dividends might impact equilibrium asset prices. Rational
investors should be attracted only by after-tax returns, so it seems possible that firms with
higher dividend payout ratios might have higher pre-tax expected returns, ceteris paribus,
(unless firms can arrange themselves in perfect correspondence with clientele.) Brennan
[1970] was probably the first to derive a formal asset pricing theory that accommodated
the differential taxation of dividends and capital gains. Early empirical papers by Black
and Scholes [1974] and Litzenberger and Ramaswamy [1979], which reached different
conclusions, typify the controversy surrounding dividend taxation and asset pricing that
continues to the present day; see, for example, Litzenberger and Ramaswamy
[1980,1982], Fung [1981], Elton and Gruber [1970], Elton, Gruber, and Rentzler [1983],
Haugen, Senbet, and Talmor [1986], Blose and Martin [1992], Fama and French [1998],
Harris and Kemsley [1999], Naranjo, Nimalendran, and Ryngaert [2000], Demsey [2001],
Whether or not it has an impact on asset pricing, dividend taxation represents a
conundrum with respect to the financial policy of corporations: if firms can distribute
cash through lower-taxed methods such as share repurchase, why are dividends ever paid?
Black [1976] referred to this as the “dividend puzzle.”
Indirect evidence does suggest some sort of connection between dividend policy and
taxes. Firms appear to change payout ratios in response to changes in relative dividend
tax rates; (See Briston and Tomkins [1970], Bolster and Janjigian [1991], Papaioannou
and Savarese [1994], and Casey, et al. [1999].) Fama and French [2001] document a
secular decline in dividend paying American firms accompanied by an increase in the
rate of share repurchases. Although it is technically illegal for American firms to evade
dividend taxes, the tax authorities appear to be winking at the actual evasion. More
recently, the Bush administration succeeded in reducing the tax rate on dividends
dramatically, avowedly to encourage an increase in dividend payouts and also to reduce
any distortion caused by differential taxation.
Dividend clientele have been studied for several decades. They are part of the asset
pricing debate because heterogeneous clientele are implied by a dependence of expected
returns on dividend taxes.1 The opposite is not true; clientele could still exist even with no asset pricing effect of taxation. Without relying on asset pricing, Elton and Gruber
[1970] devised an ingenious test for the existence of clientele by comparing dividends
against price declines on dividend dates. For an investor to hold a stock over the
1
See Allen, Bernardo, and Welch (2000) and Allen and Michaely (2004) for theoretical models of dividend clientele.
dividend date, the ex-dividend price decline must be less than the dividend by an amount
that depends on the relative difference between the marginal effective dividend and
capital gains tax rates. Elton and Gruber find that dividends are generally larger than
ex-dividend date price declines. Booth and Johnston [1984] study the ex-day effect in
Canada, and find the ex-day return generally is smaller than the dividend level, indicating
a market preference for capital gains, which are not subject to tax in Canada. Nonetheless,
the Elton/Gruber test has been challenged on several grounds. 2
First, there is the practice of dividend “capture” and its impact, (see, e.g., Karpoff and
Walkling [1988] and Grammatikos [1989].) In dividend capture, a tax-paying investor
effectively enters into a repurchase agreement with a non tax-paying entity such as a
pension fund, selling a stock before the ex-dividend date and buying it back afterward. If
this practice were unfettered, it would tend to reduce or even eliminate the Elton/Gruber
ex-dividend effect, thereby making it unlikely to detect heterogeneous clientele even
when they actually exist. But there is a fetter: the “wash sale” rule, which dictates that a
sale followed soon by a repurchase of the same asset will be taxed at ordinary rates, not at
capital gains rates. It is unclear whether the wash sale rule is sufficient to materially
mitigate the impact of dividend stripping.
Eades, Hess, and Kim [1994] and Naranjo, Nimalendran, and Ryngaert [2000] find time
variation in the ex-day return behavior, with a regime shift around 1975, the year in
which minimum commissions were eliminated on the NYSE. They suggest the lower
2
Barclay [1987] finds that prior to the enactment of income taxes, prices appear to generally have fallen by the full amount of the dividend, supporting the notion that without taxes, investors view capital gains and dividends as close substitutes.
day return post-1975 is consistent with the notion that dividend capture trades (which are
subject to transaction costs) play a big role in determining the size of the ex-day return.
Michaely and Vila [1995] argue that the ex-day return is determined by the interaction of
multiple classes of investors in different tax brackets. Boyd and Jagannathan [1994]
show that such a multitude of classes along with dividend capturers leads to a
complicated non-linear relationship between the size of the dividend and the ex-day
return.
A second question about Elton and Gruber’s test arises from considerations of market
microstructure and/or information. For example, Bali and Hite [1998], and Frank and
Jagannathan [1998], argue that microstructure effects such as bid-ask bounce and a
minimum tick size will also assure that the dividend exceeds the ex-dividend price
decline on average. Siddiqi [1997] argues that the ex-dividend day return depends not
only on the differential taxes levied on dividends and capital gains, but also on the
transaction costs involved in executing dividend capture trades. Graham, Michaely, and
Roberts [2003] argue that ex-dividend day price drops have increased after
decimalization, suggesting that discreteness-related microstructure effects do not explain
the magnitude of such drops.
Kalay [1982] challenges Elton and Gruber’s original finding based on an argument that
arbitrage motivated trading clouds evidence of a clientele effect. He argues that
transaction cost bounds faced by arbitrageurs determine the extent of the ex-day price
costs are erroneous. Kalay [1984] responds in turn, claiming that the estimation error is
too small to affect his original inference.
In summary, these contributions taken in their entirety reveal the controversial nature of
dividend clientele. This controversy would be resolved by direct observation of either
investor portfolios or trading around dividend policy changes. If investors in higher
(lower) tax brackets hold fewer (more) stocks with high dividend payout ratios, the
existence of clientele would be proved. A corollary would find heavily (lightly) taxed
investors selling (buying) after a firm increases its payout ratio, and vice versa.
Heretofore, such direct observation has been difficult because neither portfolio holdings
nor trading has been available by investor tax bracket. Lewellen, et al. [1978], Scholz
[1992], Dhaliwal, Erickson, and Trezevant [1999], and Graham and Kumar [2003] are the
exceptions of which we are aware. The first paper possessed trading data for several
hundred clients of a single brokerage firm. They estimated taxation rates by a survey
questionnaire sent out to these individuals but were ultimately unable to find any
evidence of dividend clientele based on the survey responses concatenated with the
trading.
In contrast, Scholz [1992] did report evidence of dividend clientele. His data were based
on a sample of about 4,000 households in the 1983 Survey of Consumer Finances and he
was obliged to construct a rather elaborate econometric model to estimate the marginal
ownership by aggregate institutional ownership, which is found to increase after dividend
initiations, suggesting that tax-exempt institutions buy shares from tax-disadvantaged
individuals. In a related paper, Graham and Kumar [2003] use data on accounts at a
discount brokerage firm and find that low-income investors prefer high dividend yield
stocks.3
Conflicting results are reason enough for further research. Our paper uses data from
Taiwan that is comprehensive in its coverage of all individual traders and includes good
estimates of tax rates. Moreover, Taiwan offers an excellent laboratory for studying
clientele because the capital gains tax is zero and share repurchases were prohibited for
most of our sample period. If dividend clientele exist anywhere, Taiwan seems a likely
location.
3
Barclay, Holderness, and Sheehan [2003] observe that dividends are not higher in firms with significant corporate blockholders; which is evidence against dividend clientele. Related work includes Strickland [1996], Jain [1999], and Perez-Gonzalez [2000], who restrict attention to a subset of investors. Unlike Graham and Kumar [2003] and our work, they do not examine multiple classes of individual investors.
II. The Data.
Our data sources are the Taiwan Economic Journal (TEJ) data bank and the Taiwan Stock
Exchange (TWSE).
All orders executed on the TWSE from January 1, 1995 thorough December 31, 1999, a
period of 1,357 trading days, are included. The accompanying information discloses
whether an order is buyer- or seller-initiated and it identifies the initiator. There are no
officially designated market makers on the TWSE. To retain confidentiality, we identify
traders as individuals or institutions and then break down these categories further into
institutions and groups of individuals with different wealth levels (and hence with
different tax incidence).
There are two main types of institutional investors in Taiwan, domestic and foreign.
Domestic institutions include government entities, financial institutions (securities firms
and banks), corporations, tax-exempt institutions, and mutual funds. During our sample
period, individual investors did more than 90% of the trading by dollar volume. Foreign
institutions accounted for only 2% of the trading.
The TEJ data bank contains two kinds of ownership information each year from 1995
through 2003 inclusive. One kind provided the fractions of shares held by different types
of institutions and by individual investors. The other kind gives the number of shares
1-5 lots, 5-10, 10-15, 15-20, 20-30, 30-50, 50-100, 100-200, 200-400, 400-600, 600-800,
800-1,000 lots, 1,000 lots and above. Under the assumption that most institutions
generally hold large positions, at least 1,000 lots, we can estimate the proportion of a
firm’s shares held by “wealthy” individuals as the fraction of shares held in lots above a
given size by all investors, less the fraction held by institutions.
The TEJ data bank also contains supplementary information such as daily trading
volumes, daily prices, cash dividends, dates of dividends announcements, earnings per
share, book values, and the number of shares outstanding.
In Taiwan, the maximum ordinary income tax rate is 40% for individuals, 25% for
domestic tax-paying institutions, 20% for foreigners, and zero for nonprofit organizations.
The highest individual rate, 40%, is the marginal rate for incomes above three million
Taiwan dollars (about US$101,351.4) For all investors, the tax rate on capital gains is zero.
In the early years of our sample, 1995 through August 2000, share repurchases were
prohibited in Taiwan. Consequently, a company that wished to distribute cash was
obliged to do so in the form of taxable dividends. This prohibition was removed in
September 2000, so we are able to study the behavior of firms as they became able to
evade dividend taxes.
4
Based on an average exchange rate during our sample period of $NT29.6/US$. In January 2004, the Taiwan dollar had fallen to $NT33.4/US$, so the highest marginal tax rate became effective at an income level of approximately US$89,820.
To estimate marginal tax rates for individuals, we used both data sources. From the
TWSE, we add together all the buys and sells for a particular individual trader over the
entire sample (i.e., 1995-1999.) An individual trader above the 75th percentile of the aggregate trading distribution is denoted a “wealthy” individual while anyone below the
75th percentile is a “less-wealthy” individual. Admittedly, this does not isolate traders’ marginal tax brackets directly, but it seems likely to be closely related.
Alternatively, we used the ownership structure of each traded company provided annually
by the Taiwan Economic Journal and described above. We used the fraction of total firm
shares owned by institutions of various types and also the fraction of total shares owned
by individuals who own at least 1,000 lots (i.e., 1,000,000 shares), less than 100 lots, and
less than 10 lots. Again, individuals who own a million shares would likely be in higher
tax brackets than individuals who own less than 100,000 or 10,000 shares.5
5
As a justification for our tax proxy based on ownership, we use data for 1998 and 1999 from the Ministry of Finance in Taiwan to relate average share holdings of households with their effective tax brackets. The shareholdings increase monotonically with the tax bracket. Thus, the [effective tax rate range, average shareholdings in lots] pairs for different tax brackets are [0%, 35.6], [0%-13%, 35.6],[13%-21%,66.7], [21%-30%, 200.1], [>30%, 1136.7]. While such categorization is not possible for the trade-based proxy, it appears reasonable to assume that wealthier investors with larger shareholdings will receive larger liquidity shocks (or income flows) and thus will submit larger orders. For details, please see appendix.
III. Empirical Results.
III.A. Dividends, trading behavior and ownership structure.
Summary information about dividend behavior in the no-repurchase period (1995-1999)
is shown in Table 1. Panels A and B list all the dividend announcements by Taiwanese
firms in these five years, Panel A for levels and Panel B for changes in dividends. The
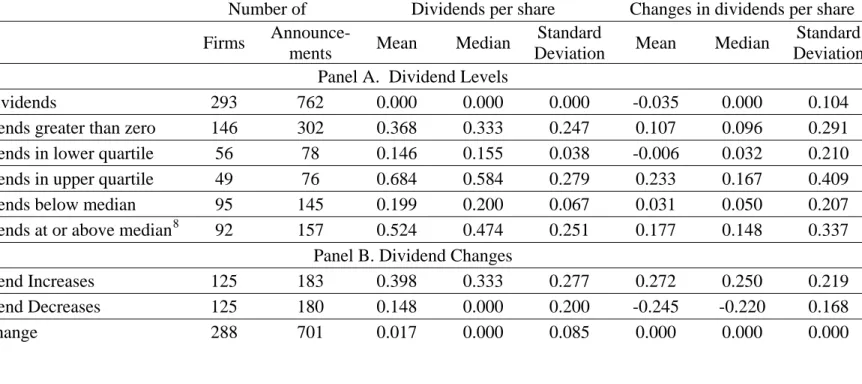
vast majority of announcements are for no change in the dividend, 701 out of 1,064.
Dividend increases and decreases are roughly equal in number, which is probably
unusual and attributable to the overall bear market of this calendar period.
When dividends are not zero, dividend changes are relatively large. The right side of
Panel B shows that mean dividend decreases per share are actually larger in absolute
value than the corresponding mean dividend. Similarly, the standard deviations of
dividend changes are only moderately smaller than the standard deviations of dividends
(for non-zero dividends.)
As shown in Panel A of Table 1, most of the no-change announcements must have been
for firms that paid no dividend at all, for 762 out of 1,064 announced a zero dividend.
This is also indicated by the fact that the median dividend is zero for the no-change
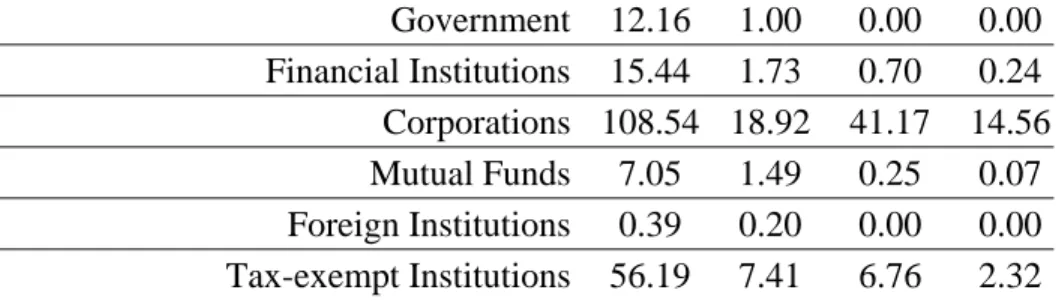
Table 2 presents some summary information about the owners of stocks in Taiwan. It
shows that wealthy individuals own about 35% of the average firm’s outstanding shares
while institutions own about 31%. Individuals with lower wealth levels own the
remainder. Individuals who own less than 100 lots (100,000 shares) own about 20% of
the total. Individuals who have more than 100 lots but less than 1,000 own the rest.
Among institutions, corporations predominate, with almost 19% of the total on average.
Tax-exempt institutions have about seven percent.
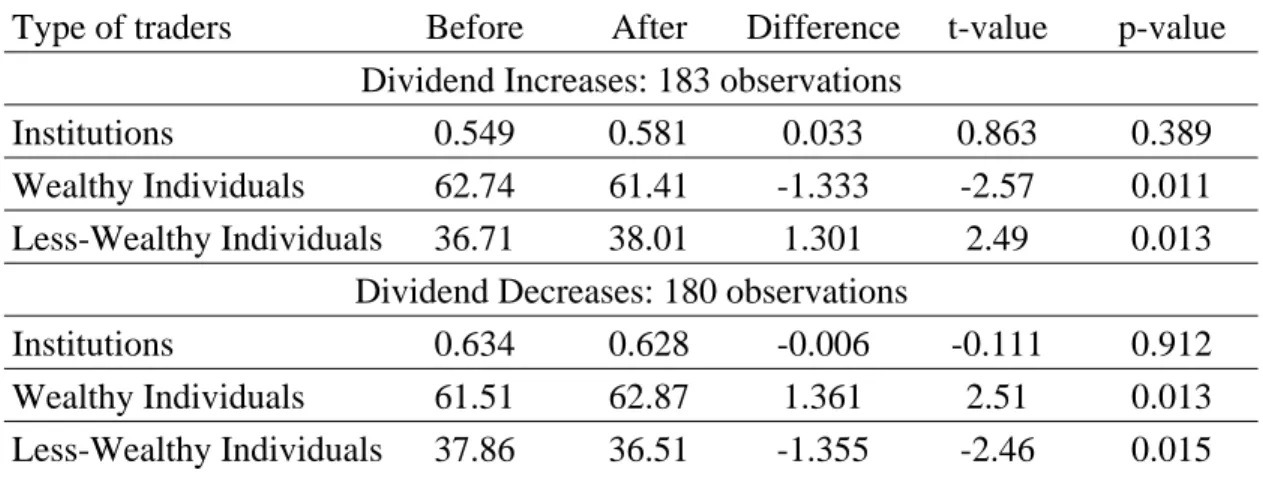
Table 3 provides a first look at how various investor types react to dividend changes. For
institutions, wealthy individuals, and less-wealthy individuals, (based on TWSE trading
data) we compute the total purchases less sales for the firms in question during the 30
days prior to a dividend announcement and in the 30 days subsequent to the
announcement. In each trader class and period, we then tabulate the fraction of traders
who bought more shares than they sold and then divided this by the fraction with positive
net buying for all traders. For example, in the 30-day window before dividend increases,
wealthy individuals who were net buyers constitute 62.74% of all traders who were net
buyers.
Institutions as a group display an insignificant response to dividend changes, but
individuals appear to respond in the direction predicted by the clientele hypothesis.
Wealthy individuals decrease (increase) their net buying after dividend increases
(decreases) while less-wealthy individuals do just the opposite. All four responses are
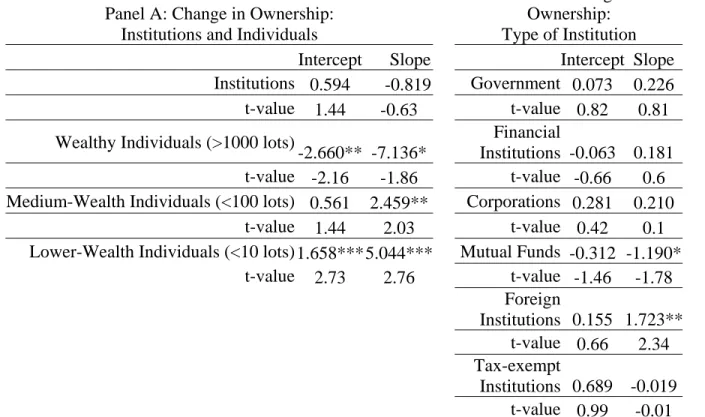
These results are buttressed by the cross-sectional regressions in Table 4, which use the
alternative definition of wealth based on the TEJ ownership data. There is a strong
negative relation between dividend increases and the proportion of shares held by
wealthy individuals. This relation has the opposite sign (positive) for medium- and
lower-wealth individuals and the significance is higher for the former. All these patterns
are completely consistent with the existence of dividend clientele.
In contrast to individuals, institutions do not seem to respond very much to changes in
dividends. In Table 4, institutions as a whole show no significance. When broken into
various institutional types (Panel B) only foreign institutions seem to have a significant
response to dividend increases. Their response is positive. Recall that foreign
institutions are subject to a flat 20% tax rate in Taiwan, half the highest marginal tax rate
for individuals and probably somewhat closer to medium- or lower-wealth individuals.
Surprisingly, even lower-taxed institutions such as government entities and tax-exempt
organizations, which might have been expected to absorb shares sold by wealthy
individuals after dividend increases, display no statistical significance at all.
Table 5 gives further evidence of the relation between dividends and clientele by
tabulating ownership structure by firm dividend categories, zero dividend payers,
dividend payers less than the median level (“small” payers,) and those payers of “large”
based on cash dividends per share while Panel B uses payout ratios (i.e.,
dividends/earnings.)
Institutions as a whole seem to like higher dividends and dislike firms that pay no
dividends at all. Wealthy individuals appear to have the opposite preferences. For
example, wealthy individuals own about 36 percent of the zero dividend paying firms and
only 30% of firms paying relatively “high” dividends. For both institutions and wealthy
individuals, these patterns are statistically significant. For medium- and lower-wealth
individuals, there is no discernible pattern.
Among institutional types, both tax exempts and corporations significantly prefer higher
dividends per share. They also prefer higher payout ratios (Panel B) and are joined in
this preference by financial institutions. Government entities6 and foreign institutions show some preference for lower but positive dividends per share and payout ratios. This
suggests the possibility of several clientele, highly taxed individuals who prefer low or
zero dividends, very low-taxed entities such as tax exempts who prefer firms with high
dividends, and medium-taxed groups such as foreign institutions who eschew both
dividend extremes and concentrate more on medium-level dividend payers.
6
The government is tax exempt but its motivation is not clear. Some of the listed companies were in the process of privatizations during our sample period but the government still owned a modest number of shares. It seems doubtful that the government would sell low dividend payers and buy high payers just to take advantage of its tax exemption.
III.B. Share repurchasing.
Beginning in September 2000, Taiwanese firms were allowed to repurchase shares for
cash. Since the tax rate on capital gains is zero, this relaxation of the rules effectively
allows firms to help their investors evade dividend taxes entirely. We thought that this
might materially alter the payout policies of Taiwanese firms and that firms with more
highly taxed shareholders would be more likely to begin a program of share repurchases.
The legalization of share repurchases appears to have had a material impact on the
behavior of some firms. As shown in Table 6, more than forty percent of all firms (166
out of 394) actually repurchased shares during 2000-2003 once they were allowed to do
so. Of these, 83 firms had been zero dividend payers in the 1995-1999 pre-repurchase
era while 83 had been previous positive dividend payers.
Among the previous positive payers, 43 (23.2%) stopped paying dividends entirely, 38
(20.5%) reduced dividends and repurchased shares, while 45 (24.3%) repurchased shares
even though they also increased dividends. This seems to reveal an inclination by some
previous positive payers to substitute share repurchases for dividends and perhaps to
retard dividend growth in favor of repurchasing.
Taxation is not, of course, the only determinant of dividend policy. For example, we also
see in Table 6 that 65 firms that had been paying dividends (35.1%) both decreased
on hard times or discovered some promising new investment projects. Perhaps for the
opposite reasons, roughly 38% of the previous zero dividend payers (i.e., 79 of 209)
began paying dividends after repurchasing was allowed. Of these, almost 20% both
repurchased and paid positive dividends. Again, if non-tax considerations prompted an
initiation of cash distributions for previous non-payers, the fact that more than half also
made share repurchases seems to reveal an effort to minimize taxes for shareholders.
To test whether a firm’s ownership structure influences the propensity to engage in share
repurchases, we begin by constructing a firm-specific measure of shareholder tax
incidence from the TEJ ownership data. Averaging over the pre-share repurchase period,
1995-1999, this measure is the difference in the proportion of shares owned by wealthy
shareholders (variously defined as those holding at least 1000 lots, 600 lots or 400 lots)
and the proportion owned by less wealthy shareholders (holding less than 10 lots.) This
measure is denoted “tax incidence” in the tables to follow.
Tax incidence is included along with other possible determinants of share repurchasing
behavior (i.e., as control variables) in a logit model whose dependent variable is 1.0 if the
firm actually did make a share repurchase during 2000-2003, and otherwise zero. Since
initial runs suggested nonlinearity in the relation between repurchasing and tax incidence,
both linear and quadratic terms are included for the latter variable.
The results, presented in Table 7, indicate that firms previously paying dividends are
highly taxed, for two of the three tax incidence measures. However, there is no
significant effect of tax incidence among firms that previously did not pay dividends.
The control variables include market/book ratio, returns over the previous six months
(using the previous three- and twelve-month returns made no substantive difference in the
results), and returns one year after the repurchase for firms that did repurchase and one
year after repurchasing was permitted for firms that did not.7
Motivation for the controls comes from previous findings. For example, Vermaelen
[1981] and Stephens and Weisbach [1998] suggest that past returns could matter because
firms may repurchase stocks when managers believe their stock prices have suffered an
unwarranted decline and are now undervalued. But contrary to this idea, past returns are
significantly positive for previous dividend payers, which seems to suggest that some
repurchases are motivated by previous good times.
For a similar reason, the post repurchase return was included because managers might
repurchase shares to exploit undervaluation (e.g., Daniel, Hirshleifer, and Subrahmanyam
[1998]). In fact, post repurchase returns are is consistently significant and positive, thus
supporting the undervaluation hypothesis. The effect is larger and more significant for
previous dividend payers.
7
We also included the dividend payout ratio in some unreported logits. The payout ratio is a direct measure of dividends versus capital gains, so it might control for low dividend-paying firm substituting share repurchasing for dividends (Jagannathan, Stephens and Weisbach [2000]). But the payout ratio might also proxy for the tax incidence of a firm’s shareholders, so we only report results without it. The results are very similar, whether or not the payout ratio is included. Details are available from the authors upon request.
The market to book ratio is included because it should be related to investment
opportunities. One would expect a lower lever of cash disbursements, ceteris paribus,
with better growth opportunities. The sign of M/B is negative as expected, but the
coefficient is not statistically significant.
To provide some further tests of significance for the tax clientele effect while controlling
for cash disbursements, Table 8 examines the impact of shareholder wealth (and thus
their implicit tax bracket) on the propensity to repurchase shares when such activity
became legal in Taiwan. As in Table 7, the main explanatory variable of interest is the
one that measures tax incidence. Separate tests are conducted for firms that increased,
decreased, and maintained the same dividend during the repurchase era.
Table 8 shows there is a tendency to repurchase shares when stockholders are in higher
tax brackets. The coefficients of tax incidence are positive in all cases and are marginally
significant for two of the three measures of tax incidence among dividend decreasing
firms, and for one of the three measures among dividend increasing firms.
Repurchases are very likely to be followed by high returns over the subsequent year,
again an indication that managers tend to engage in share repurchases when they believe
(correctly) that shares are undervalued. This effect is largest for dividend decreasing
firms. One is tempted to think that managers of these firms are particularly adept because
they evidently can judge valuations well but also seem to adopt more tax-advantaged
Previous returns have a significantly positive influence on repurchasing only for firms
that make no change in cash dividends paid. Such firms experienced good times before
the repurchasing era and they responded sensibly with cash disbursements that avoided
taxation.
IV. Conclusion.
Our evidence supports the view that Taiwanese shareholders arrange themselves into
dividend clientele. Highly taxed individuals tend to hold firms that pay low or zero
dividends and they trade out of firms that increase dividends. The opposite is true of
individuals and institutions in lower tax brackets.
When share repurchasing became legal in Taiwan (in September 2000), firms with higher
concentrations of highly taxed shareholders were significantly more likely to commence
repurchase programs. More than forty percent of Taiwan firms actually engaged in share
repurchasing after it became possible. A significant fraction (23%) of firms that had
previously been paying dividends ceased paying them entirely and 21% reduced
dividends and began repurchasing. The tendency to engage in these practices is
significantly related to the proportion of a firm’s shareholders in higher tax brackets.
We have not attempted to ascertain whether the unequivocal existence of dividend
clientele in Taiwan has an influence on asset pricing. This would depend on whether the
arrangement of dividend policies across individual firms is isomorphic to the tax
arrangement of shareholders, a difficult question but one that is certainly worthy of
continuing research.
References
Allen, Franklin, Antonio Bernardo, and Ivo Welch, 2000, “A Theory of Dividends Based on Tax Clientele,” Journal of Finance 55, 2499-2536
Allen, Franklin, and Roni Michaely, 2004, “Payout Policy,” forthcoming in North-Holland Handbook of Economics, edited by George Constantinides, Milton Harris, and René Stulz.
Bali, Rakesh, and Gailen L. Hite, 1998, “Ex Dividend Day Stock Price Behavior: Discreteness or Tax-Induced Clienteles?,” Journal of Financial Economics 47, 127-159.
Barclay, Michael J., 1987, “Dividends, Taxes and Common Stock Prices: The Ex-Dividend Day Behavior of Common Stock Prices Before the Income Tax,” Journal of Financial Economics 47, 127-159.
Barclay, Michael J., Clifford Holderness, and Dennis Sheehan, 2003, “Dividends and Dominant Corporate Shareholders,” working paper, University of Rochester.
Bell, Leonie, and Tim Jenkinson, 2002, “New Evidence of the Impact of Dividend
Taxation and on the Identity of the Marginal Investor,” Journal of Finance 57, 1321-1346.
Black, Fischer, 1976, “The Dividend Puzzle,” Journal of Portfolio Management 2, 5-8.
Black, Fischer, and Myron Scholes, 1974, “The Effects of Dividend Yield and Dividend Policy on Common Stock Prices and Returns,” Journal of Financial Economics 1, 1-22.
Blose, Laurence E., and John D. Martin, 1992, “Capital Gains Preference and the Prices of Dividend Paying Securities: A Test of the Dividend Tax Aversion Hypothesis,” International Review of Economics and Finance 1, 73-87.
Bolster, Paul J., and Vahan Janjigian, 1991, “Dividend Policy and Valuation Effects of the Tax Reform Act of 1986,” National Tax Journal 44, 511-518.
Booth, L. D. and D. J. Johnston, 1984, “The Ex-Dividend Day Behavior of Canadian Stock Prices: Tax Changes and Clientele Effects,” Journal of Finance 39, 457-476.
Boyd, John, and Ravi Jagannathan, 1994, “Ex-dividend Price Behavior of Common Stocks,” Review of Financial Studies 7, 711-741.
Brennan, Michael J., 1970, “Taxes, Market Valuation and Corporate Financial Policy,” National Tax Journal 23, 417-427.
Briston, R. J., and C. R. Tomkins, 1970, “The Impact of the Introduction of Corporation Tax upon the Dividend Policies of United Kingdom Companies,” Economic Journal 80, 617-637.
Casey, K. Mike, Dwight C. Anderson, Hani I. Mesak, and Ross N. Dickens, 1999, “Examining the Impact of the 1986 Tax Reform Act on Corporate Dividend Policy: A New Methodology,” Financial Review 34, 33-46.
Daniel, Kent, David Hirshleifer, and Avanidhar Subrahmanyam, 1998, “Investor Psychology and Security Market Under- and Overreactions,” Journal of Finance 53, 1839-1885.
Demsey, Mike, 2001, “Investor Tax Rationality and the Relationship Between Dividend Yields and Equity Returns: An Explanatory Note,” Journal of Banking and Finance 25, 1681-1686.
Dhaliwal, Dan S., Merle Erickson, and Robert Trezevant, 1999, “A Test of the Theory of Tax Clienteles for Dividend Policies,” National Tax Journal 52, 179-194.
Eades, Ken, Patrick Hess, and E. Han Kim, 1994, “Time-series Variation in Dividend Pricing,” Journal of Finance 49, 1617-1638.
Elton, Edwin J., and Martin J. Gruber, 1970, “Marginal Stockholder Tax Rates and the Clientele Effect,” Review of Economics and Statistics 52, 68-74.
Elton, Edwin J., Martin J. Gruber, and Joel Rentzler, 1984, “The Ex-Dividend Day Behavior of Stock Prices: A Reexamination of the Clientele Effect: A Comment,” Journal of Finance 39, 551-556.
Elton, Edwin, Martin Gruber, and Joel Rentzler, 1983, “A Simple Examination of the Empirical Relationship Between Dividend Yields and Deviations from the CAPM,” Journal of Banking and Finance 7, 135-146.
Fama, Eugene F., and Kenneth R. French, 1998, “Taxes, Financing Decisions, and Firm Value,” Journal of Finance 53, 819-843.
Fama, Eugene F., and Kenneth R. French, 2002, “Testing Trade-Off and Pecking Order Predictions About Dividends and Debt,” Review of Financial Studies 15, 1-33.
Fama, Eugene F., and Kenneth R. French, 2001, “Disappearing Dividends: Changing Firm Characteristics or Lower Propensity to Pay?,” Journal of Financial Economics 60, 3-43.
Frank, Murray, and Ravi Jagannathan, 1998, “Why do Stock Prices drop by Less than the Value of the Dividend? Evidence From a Country Without Taxes,” Journal of Financial Economics 47, 161-188.
Fung, William K. H., 1981, “Taxes, Clientele Effect of Dividend and Risk, Return Linearity,” Journal of Banking and Finance 5, 405-424.
Gentry, William M., Deen Kemsley, and Christopher J. Mayer, 2003, “Dividend Taxes and Share Prices: Evidence from Real Estate Investment Trusts,” Journal of Finance 58, 1 (February), 261-282.
Graham, John, and Alok Kumar, 2003, “Do Dividend Clienteles Exist? Evidence on Dividend Preferences of Retail Investors,” working paper, University of Notre Dame.
Graham, John, Roni Michaely, and Michael Roberts, 2003, “Do Price Discreteness and Transactions Costs Affect Stock Returns? Comparing Ex-Dividend Pricing Before and After Decimalization,” Journal of Finance 58, 2611-2635.
Grammatikos, Theoharry, 1989, “Dividend Stripping, Risk Exposure, and the Effect of the 1984 Tax Reform Act on the Ex-Dividend Day Behavior,” Journal of Business 62, 157-174.
Harris, Trevor, and Deen Kemsley, 1999, “Dividend Taxation in Firm Valuation: New Evidence,” Journal of Accounting Research 37, 275-292.
Haugen, Robert A., Lemma W. Senbet, and Eli Talmor, 1986, “Debt, Dividends, and Taxes: Equilibrium Conditions for Simultaneous Tax Neutrality of Debt and Dividend Policies,” Research in Finance 6, 1-28.
Hubbard, Jeff, and Roni Michaely, 1997, “Do Investors Ignore Dividend Taxation? A Reexamination of the Citizens Utilities Case,” Journal of Financial and Quantitative Analysis 32, 117-135.
Jagannathan, Murali, Clifford P. Stephens, and Michael J. Weisbach, 2000, “Financial Flexibility and the Choice Between Dividends and Stock Repurchases,” Journal of Financial Economics 57, 355-384.
Jain, Ravi, 1999, “Institutional investors do not prefer dividends: Individual investors do,” working Paper, Temple University, Philadelphia, PA.
Kalay, Avner, 1982, “The Ex-Dividend Day Behavior of Stock Prices: A Re-Examination of the Clientele Effect,” Journal of Finance 37, 1059-1070.
Kalay, Avner, 1984, “The Ex-Dividend Day Behavior Of Stock Prices: A Reexamination of the Clientele Effect: A Reply,” Journal of Finance 39, 557-561.
Karpoff, Jonathan, and Ralph A. Walkling, 1988, “Short-term trading around ex-dividend days – Additional Evidence,” Journal of Financial Economics 21, 291-298.
Lewellen, Wilbur G., Kenneth L. Stanley, Ronald C. Lease, and Gary G. Schlarbaum, 1978, “Some Direct Evidence on the Dividend Clientele Phenomenon,” Journal of Finance 33, 1385-1399.
Litzenberger, Robert H., and Krishna Ramaswamy, 1979, “The Effect of Personal Taxes and Dividends on Capital Asset Prices: Theory and Empirical Evidence,” Journal of Financial Economics 7, 163-196.
Litzenberger, Robert H., and Krishna Ramaswamy, 1980, “Dividends, Short Selling Restrictions, Tax-Induced Investor Clienteles and Market Equilibrium,” Journal of Finance 35, 469-482.
Litzenberger, Robert H., and Krishna Ramaswamy, 1982, “The Effects of Dividends on Common Stock Prices: Tax Effects or Information Effects?,” Journal of Finance 37, 429-443.
Michaely, Roni, and Jean-Luc Vila, 1995, “Investors’ Heterogeneity, Prices, and Volume Around the Ex-dividend Day,” Journal of Financial and Quantitative Analysis 30, 171-198.
Naranjo, Andy, M. Nimalendran, and Mike Ryngaert, 1998, “Stock Returns, Dividend Yields, and Taxes,” Journal of Finance 53, 2029-2057.
Naranjo, Andy, M. Nimalendran, and Mike Ryngaert, 2000, “Time Variation of Ex-Dividend Day Stock Returns and Corporate Ex-Dividend Capture: Reexamination,” Journal of Finance 55, 2357-2372.
Papaioannou, George J., and Craig M. Savarese, 1994, “Corporate Dividend Policy Response to the Tax Reform Act Of 1986,” Financial Management 23, 56-63.
Perez-Gonzalez, Francisco, 2001, “Large Shareholders and Dividends: Evidence from U.S. Tax Reforms,” working paper, Columbia University.
Scholz, John Karl, 1992, “A Direct Examination of the Dividend Clientele Hypothesis,” Journal of Public Economics 49, 261-286.
Siddiqi, Mazhar A., 1997, “Using Ex-day Returns to Separate the Tax and Information Effects of Dividend Changes,” Journal of Economics and Finance 21, 83-92.
Stephens, Clifford P., and Michael J. Weisbach, 1998, “Actual Share Reacquisitions in Open-Market Repurchase Programs,” Journal of Finance 53, 313-334.
Strickland, Deon, 1996, “Determinants of Institutional Ownership: Implications for Dividend Clienteles,” working paper, Ohio State University.Vermaelen, Theo, 1981. “Common Stock Repurchases and Market Signaling: An Empirical Study,” Journal of Financial Economics 9, 139-183.
Table 1. Dividends for Taiwan Firms, 1995-1999
Dividend information from the Taiwan Economic Journal (a data bank) is reported for the period January 1995 through December 1999. There is no tax on capital gains in Taiwan and firms were not allowed repurchase shares during this period. In Panel A, sample firms are grouped by the level of dividends on each dividend announcement date; zero or non-zero, less than or equal to first quartile of all dividend-announcements, greater than or equal to the third quartile, less than or greater than the median. Columns four to six report the mean, median and standard deviation of dividends per share within each group of firm-announcements. The means, medians and standard deviation of changes in dividends from the previous announcement are reported in the last three columns. Panel B classifies firms into three announcement categories: dividend increases, dividend decreases and no change. Columns four to six give the dividend levels per share after the change while the last three columns give the corresponding statistics for changes from the previous announcement.
Number of Dividends per share Changes in dividends per share
Firms
Announce-ments Mean Median
Standard
Deviation Mean Median
Standard Deviation Panel A. Dividend Levels
No Dividends 293 762 0.000 0.000 0.000 -0.035 0.000 0.104
Dividends greater than zero 146 302 0.368 0.333 0.247 0.107 0.096 0.291
Dividends in lower quartile 56 78 0.146 0.155 0.038 -0.006 0.032 0.210
Dividends in upper quartile 49 76 0.684 0.584 0.279 0.233 0.167 0.409
Dividends below median 95 145 0.199 0.200 0.067 0.031 0.050 0.207
Dividends at or above median8 92 157 0.524 0.474 0.251 0.177 0.148 0.337
Panel B. Dividend Changes
Dividend Increases 125 183 0.398 0.333 0.277 0.272 0.250 0.219
Dividend Decreases 125 180 0.148 0.000 0.200 -0.245 -0.220 0.168
No Change 288 701 0.017 0.000 0.085 0.000 0.000 0.000
8
There are 39 announcements exactly at the median, which explains the asymmetry in numbers “below” and “at or above” the median.
Table 2. The Ownership Structure of Taiwan Stocks
Panel A presents aggregate ownership by investor type (institutions, wealthy individuals who own at least 1000 lots, medium-wealth individuals who own less than 100 lots, and lower-wealth individuals who own less than 10 lots). One lot is 1000 shares. Panel B reports shares held by classes of institutions. The mean and medians are taken over all individual firm-years, (i.e., all firms over 1995-2003.) The percentages total less than 100% because investors are not included if they own more than 100 but less than 1000 lots.
Panel A: Ownership structure by Institutions and by Individuals with different wealth levels
Means Medians Shares (millions) (% ) Shares (millions) % Institutions 199.77 30.73 69.412 28.37 Wealthy Individuals (>1000 lots) 222.89 35.08 78.848 32.15 Medium-Wealth Individuals (<100 lots) 108.15 20.33 43.892 17.22 Lower-Wealth Individuals (<10 lots) 47.10 9.06 19.631 7.38
Panel B: Ownership breakdown by type of institution
Government 12.16 1.00 0.00 0.00 Financial Institutions 15.44 1.73 0.70 0.24 Corporations 108.54 18.92 41.17 14.56 Mutual Funds 7.05 1.49 0.25 0.07 Foreign Institutions 0.39 0.20 0.00 0.00 Tax-exempt Institutions 56.19 7.41 6.76 2.32
Table 3. Trading before and after Dividends Increases/Decreases by Investor Category This table reports the relative net share purchasing by three types
of investors around announcements of dividend increases and decreases. Shares purchased and sold by each trader are recorded during two event windows, days –30 to -1 and +1 to +30 on either side of a dividend announcement on day zero. If purchases exceed sales, the trader is counted as a net buyer. Then, the fraction of net buyers within each investor category is taken as a percentage relative to the fraction of net buyers over all categories.
Type of traders Before After Difference t-value p-value
Dividend Increases: 183 observations
Institutions 0.549 0.581 0.033 0.863 0.389
Wealthy Individuals 62.74 61.41 -1.333 -2.57 0.011
Less-Wealthy Individuals 36.71 38.01 1.301 2.49 0.013
Dividend Decreases: 180 observations
Institutions 0.634 0.628 -0.006 -0.111 0.912
Wealthy Individuals 61.51 62.87 1.361 2.51 0.013
Table 4. Dividends and Changes in Ownership Structure
For Taiwan during 1995-1999, changes in dividends are related to changes in the ownership of various investor groups. In Panel A, the independent variable is the announced change (first difference) in cash dividends per share, while the separate dependent variables are first differences (from before the announcement until afterward) in the proportions of shares held by Institutions, Wealthy individuals (who own more than 1000 lots), Medium-Wealth individuals (<100 lots), and Lower-Wealth individuals (<10 lots), respectively. A lot is 1,000 shares. Panel B’s dependent variables are changes in the percentages of shares owned by various types of institutions. The .1, .05, and .01 levels of significance are indicated by *, **, and *** respectively. Adjusted R-squares are low, only one to two percent, even in significant regressions.
Panel A: Change in Ownership: Institutions and Individuals
Panel B: Change in Ownership: Type of Institution
Intercept Slope Intercept Slope
Institutions 0.594 -0.819 Government 0.073 0.226
t-value 1.44 -0.63 t-value 0.82 0.81
Wealthy Individuals (>1000 lots)
-2.660** -7.136*
Financial
Institutions -0.063 0.181
t-value -2.16 -1.86 t-value -0.66 0.6
Medium-Wealth Individuals (<100 lots) 0.561 2.459** Corporations 0.281 0.210
t-value 1.44 2.03 t-value 0.42 0.1
Lower-Wealth Individuals (<10 lots)1.658***5.044*** Mutual Funds -0.312 -1.190*
t-value 2.73 2.76 t-value -1.46 -1.78 Foreign Institutions 0.155 1.723** t-value 0.66 2.34 Tax-exempt Institutions 0.689 -0.019 t-value 0.99 -0.01
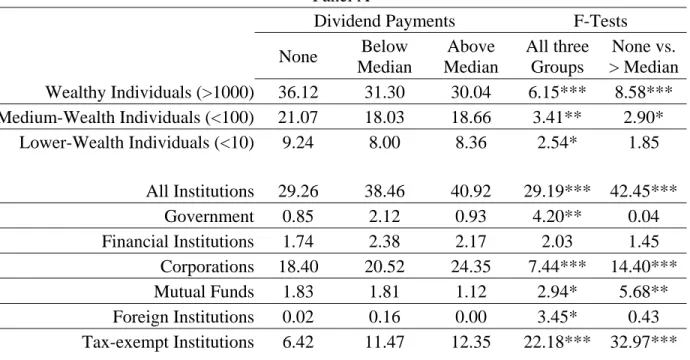
Table 5. Dividends and Ownership structure for Taiwan, 1995-1999 inclusive
Using dividends (Panel A) and payout ratios (Panel B), Taiwan companies are classified into non-paying firms, and, among firms paying dividends, those paying less than the median and those paying greater than or equal to the median. The payout ratio is the total dividend divided by net income. The proportion of shares held by each type of investor is tabulated after dividend announcements in each year, then averaged across the five sample years. Investor types include institutions (as a whole and broken down into type), wealthy individuals (who own at least 1000 lots), medium wealth individuals (<100 lots), and lower wealth individuals (<10 lots.) One lot is 1,000 shares. Column five gives an F- test that the same proportions are held in all firms regardless of dividend policy, while column six gives an F-test for the proportions held in non-paying firms and firms whose payouts are greater than the median. The 0.1, 0.05, and 0.01 significance levels are denoted by *, **, and *** respectively.
Panel A
Dividend Payments F-Tests
None Below Median Above Median All three Groups None vs. > Median Wealthy Individuals (>1000) 36.12 31.30 30.04 6.15*** 8.58*** Medium-Wealth Individuals (<100) 21.07 18.03 18.66 3.41** 2.90* Lower-Wealth Individuals (<10) 9.24 8.00 8.36 2.54* 1.85 All Institutions 29.26 38.46 40.92 29.19*** 42.45*** Government 0.85 2.12 0.93 4.20** 0.04 Financial Institutions 1.74 2.38 2.17 2.03 1.45 Corporations 18.40 20.52 24.35 7.44*** 14.40*** Mutual Funds 1.83 1.81 1.12 2.94* 5.68** Foreign Institutions 0.02 0.16 0.00 3.45* 0.43 Tax-exempt Institutions 6.42 11.47 12.35 22.18*** 32.97***
Table 5. Dividends and Ownership structure for Taiwan, 1995-1999 inclusive, (continued)
Panel B
Payout Ratios F-Tests
Zero Below Median Above Median All three Groups Zero vs. > Median Wealthy Individuals (1000) 36.12 32.03 28.64 7.56*** 13.04*** Lower-Wealth Individuals (10) 9.24 7.38 8.84 3.49* 0.38 Medium-Wealth Individuals (100) 21.07 16.40 20.45 5.73** 0.19* All Institutions 29.26 40.37 39.40 29.91*** 31.13*** Government 0.85 2.15 0.91 4.42** 0.03 Financial Institutions 1.74 1.87 2.73 3.74** 6.91*** Corporations 18.40 21.46 23.57 6.40*** 10.99*** Mutual Funds 1.83 1.96 0.98 4.50** 8.18*** Foreign Institutions 0.02 0.16 0.00 3.44** 0.42 Tax-exempt Institutions 6.42 12.77 11.20 23.24*** 20.89***
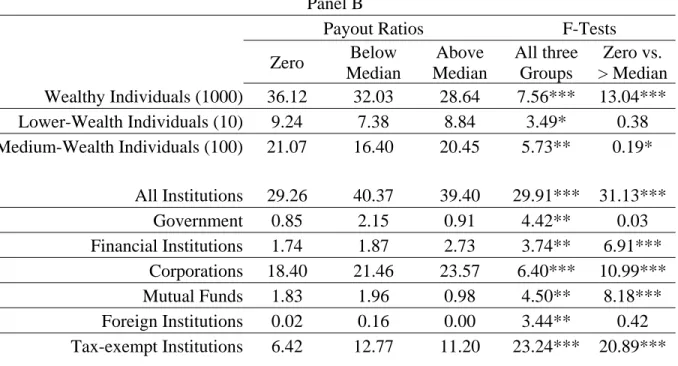
Table 6. Dividends and the Legalization of Stock Repurchases
The table examines firm dividend policies after Taiwan legalized stock repurchases in September, 2000. Firms are classified as non-paying and paying based on actual dividends during 1995-1999, before stock repurchases were allowed. Panels A reports whether dividends were zero or positive during the repurchase period and gives the mean dividend per share. Panel B provides the mean change in dividends per share before and after stock repurchasing was allowed. Some firms that were part of the sample in previous tables were delisted during after 2000.
Panel A. Dividend levels after September 2000 Dividends before Repurchase Period
Zero Positive Dividends during Repurchase Period N 9 (%) Mean Dividend N (%) Mean Dividend Zero 130 62.20 0 43 23.24 0 Positive 79 37.80 0.292 142 76.76 0.528
Panel B. Dividend changes after September 2000
Dividends before Repurchase Period
Zero Positive Shares Repurchased Dividends during Repurchase Period N (%) Dividend Change N (%) Dividend Change Increase 41 19.62 0.219 45 24.32 0.297 Yes Decrease/NC10 42 20.10 0 38 20.54 -0.267 Increase 38 18.18 0.370 37 20.00 0.466 No Decrease/NC 88 42.11 0 65 35.14 -0.299 9 Number of firms. 10
Table 7. Ownership Structure, Prior Dividend Policy, and the Propensity to Repurchase Shares
Share repurchases were allowed in Taiwan beginning in September 2000. This table examines whether the repurchase policies of individual firms depend on their ownership structure. The sample is divided into non-paying and dividend-paying firms for the five years prior to September 2000. A logit model is estimated with dependent variable equal 1.0 or zero depending on whether a firm did or did not engage in at least one share repurchase during 2000 to 2003. The main explanatory variable is a proxy for the tax incidence of firm shareholders. It is the difference of the proportion of shares held by wealthy individual shareholders (those holding at least 1000 lots, 600 lots or 400 lots in three separate logit models) and the proportion held by less wealthy shareholders (holding less than 10 lots in all three reported logits.) Control variables include (1) M/B, the market value of equity on August 31, 2000 divided by the book value of equity; (2) Pre-ret, the six-month holding period return before repurchasing was permitted, and (3) Post-ret, the one-year return after repurchase for repurchasing firms or the one-year return after repurchasing was permitted (September 2000) for non-repurchasing firms. The 0.1, 0.05, and 0.01 significance levels are denoted by *, **, and *** respectively.
(Table continued on next page)
Prior Dividends N 11 Intercept Tax Incidence Square of Tax
Incidence*100 M/B Pre-ret Post-ret LRT
12
Panel A: In tax incidence variable, wealthy individuals hold more than 1000 lots.
Positive 164 0.271 0.0305 -0.083**
-52.78 -1.569 13.31*** 83.27***
11
Number of observations (firms.) 12
s.e. 0.688 0.0207 0.034 179.6 1.375 2.188 Zero 1.128* 0.0311 -0.041 -154.0 2.261** 5.683*** s.e. 163 0.604 0.0218 0.034 119.5 1.04 1.141 43.51***
Panel B: In tax incidence variable, wealthy individuals hold more than 600 lots.
Positive 0.081 0.0409* -0.089*** -56.18 -1.647 13.45*** s.e. 166 0.687 0.0220 0.034 177.8 1.367 2.188 84.50*** Zero 164 1.019* 0.0359 -0.040 -157.8 2.366** 5.765*** s.e. 0.611 0.0239 0.034 120.2 1.040 1.151 44.87***
Panel C: In tax incidence variable, wealthy individuals hold more than 400 lots.
Positive -0.005 0.0457** -0.092*** -55.51 -1.633 13.45*** s.e. 167 0.694 0.0226 0.034 177 1.376 2.182 85.10*** Zero 0.919 0.0389 -0.040 -160.2 2.383** 5.780*** s.e. 164 0.619 0.0257 0.035 120.9 1.042 1.155 45.17***
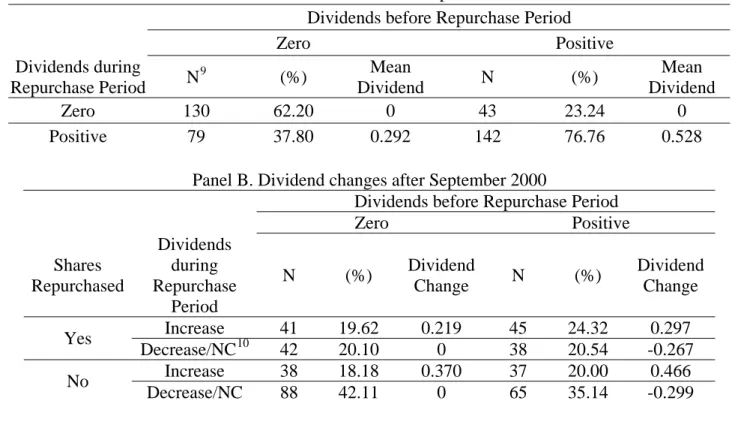
Table 8. Dividend Increases, Share Repurchases, and Tax Incidence
Share repurchases were allowed in Taiwan beginning in September 2000. This table examines whether the repurchase policies of individual firms depend on their ownership structure. A logit model is estimated with dependent variable equal 1.0 if the firm repurchases stock after September 2000 and zero if the firm does not repurchase stock. We divide the sample into three groups based on the change in dividend before and after September 2000: dividend increase, dividend decrease and no change in dividend. The main explanatory variable is a proxy for the tax incidence of firm shareholders. It is the difference of the proportion of shares held by wealthy individual shareholders (those holding at least 1000 lots, 600 lots or 400 lots in three separate logit models) and that of less wealthy shareholders (holding less than 10 lots in all three logits.) Control variables include (1) M/B, the market value of equity on August 31, 2000 divided by the book value of equity; (2) Pre-ret, the six-month holding period return before repurchasing was permitted, and (3) Post-Pre-ret, the one-year return after repurchase for repurchasing firms or the one-year return after repurchasing was permitted (September 2000) for non-repurchasing firms. The 0.1, 0.05, and 0.01 significance levels are denoted by *, **, and *** respectively.
(Table continued on next page)
Table 8. Dividend Increases, Share Repurchases, and Tax Incidence (continued) Dividends N13 Intercept Tax
Incidence
Square of Tax
Incidence*100 M/B Pre-ret Post-ret LRT
14
Panel A: In tax incidence variable, wealthy individuals hold more than 1000 lots. Dividend Increase 0.169 0.0282 -0.051 -60.02 -1.156 8.245*** s.e. 128 0.555 0.0221 0.033 125.4 1.248 1.827 34.88*** Dividend 90 -0.009 0.0442 -0.131** 7.685 -1.940 10.97*** 38.55*** 13
Number of observations (firms.) 14
Decrease s.e. 1.099 0.0282 0.0602 264.1 2.073 2.663 No Change 1.810* 0.0197 -0.027 -269.9 3.323** 6.310*** s.e. 106 0.978 0.0307 0.050 218.4 1.448 1.589 29.06***
Panel B: In tax incidence variable, wealthy individuals hold more than 600 lots. Dividend Increase 0.055 0.0386 -0.056* -72.89 -0.946 8.158*** s.e. 129 0.566 0.0236 0.033 123.9 1.243 1.818 34.70*** Dividend Decrease -0.157 0.054* -0.138** -5.368 -2.084 11.40*** s.e. 92 1.087 0.0299 0.060 246.2 2.059 2.673 40.10*** No Change 1.679* 0.0200 -0.021 -263.2 3.257** 6.383*** s.e. 106 0.994 0.0339 0.051 218 1.437 1.592 29.14***
Panel C: In tax incidence variable, wealthy individuals hold more than 400 lots. Dividend Increase -0.072 0.046* -0.061* -76.87 -0.872 8.233*** s.e. 130 0.578 0.024 0.033 124.1 1.244 1.826 35.93*** Dividend Decrease -0.153 0.057* -0.140** -21.49 -2.009 11.20*** s.e. 92 1.099 0.031 0.062 266.6 2.078 2.645 40.19*** No Change 1.593 0.022 -0.021 -262.6 3.231** 6.390*** s.e. 106 1.022 0.037 0.052 218.5 1.429 1.593 29.21***
Appendix
In the appendix, we calculate the effective tax rate for each household and get the numbers and holding shares of households in six tax brackets(>=30%, <30% and >=21%, <21% and >=13%, <13% and >=6%, <6% and >0%, 0%). The data are from the data center, and sample period covers from 1998-1999. Wealthy and Unwealthy are defined as follows:
1. Wealthy Households I (effective tax rate >= 30%) 2. Wealthy Households II (effective tax rate >= 21%) 3. Medium-Wealth Households II (effective tax rate < 13%) 4. Medium-Wealth Households I (effective tax rate < 6%) 5. Lower-Wealth Households (effective tax rate=0%)
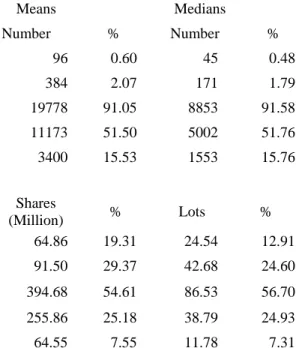
Table 1 presents summary stat6istics about the owners of stocks in Taiwan stock exchange. We measure the number of households and the shares owned by various classifications of wealthy/ unwealthy households.
The results of Table1 show that wealthy households I (tax rate >=30%) contribute to only 0.6% (0.48%) of number of firm's outstanding on average. However, in terms of shares, wealthy households (tax rate >=30%) own 64.86% (24.54%) of the total outstanding shares. In contrast, lower wealth households (tax rate =0%) own less than 7% of total outstanding shares.
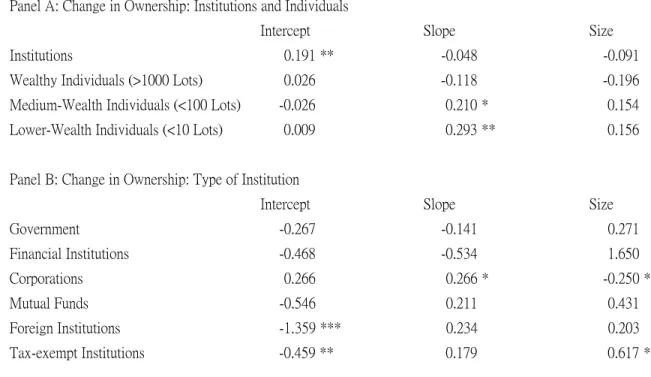
Table 2 replicates the Table 4 in the main context, in that we de-trend the ownership and add firm size as a Control in the independent variable. The finding of this table is basically similar, yet weaker, to what we have found in Table 2, in the main context.
Table 1 Ownership structure: household-based
Means Medians
Number % Number %
Wealthy Households I (effective tax rate >= 30%) 96 0.60 45 0.48
Wealthy Households II (effective tax rate >= 21%) 384 2.07 171 1.79
Medium-Wealth Households II (effective tax rate < 13%) 19778 91.05 8853 91.58
Medium-Wealth Households I (effective tax rate < 6%) 11173 51.50 5002 51.76
Lower-Wealth Households (effective tax rate=0%) 3400 15.53 1553 15.76
Shares
(Million) % Lots %
Wealthy Households I (effective tax rate >= 30%) 64.86 19.31 24.54 12.91
Wealthy Households II (effective tax rate >= 21%) 91.50 29.37 42.68 24.60
Medium-Wealth Households II (effective tax rate < 13%) 394.68 54.61 86.53 56.70
Medium-Wealth Households I (effective tax rate < 6%) 255.86 25.18 38.79 24.93
Table 2 Dividends and Changes in ownership Structure: De-trend and size control Panel A: Change in Ownership: Institutions and Individuals
Intercept Slope Size
Institutions 0.191 ** -0.048 -0.091
Wealthy Individuals (>1000 Lots) 0.026 -0.118 -0.196
Medium-Wealth Individuals (<100 Lots) -0.026 0.210 * 0.154
Lower-Wealth Individuals (<10 Lots) 0.009 0.293 ** 0.156
Panel B: Change in Ownership: Type of Institution
Intercept Slope Size
Government -0.267 -0.141 0.271 Financial Institutions -0.468 -0.534 1.650 Corporations 0.266 0.266 * -0.250 * Mutual Funds -0.546 0.211 0.431 Foreign Institutions -1.359 *** 0.234 0.203 Tax-exempt Institutions -0.459 ** 0.179 0.617 **