1997 Elsevier Science l.td. All rights reserved Printed in Great Britain PII: S0009-2509(97)00259-5 c ~ 2509:97 $17oo * ooo
Morphology and growth rate of calcium
carbonate crystals in a gas-liquid-solid
reactive crystallizer
Pao-Chi Chen,*'* Clifford Y. Tai:
and K. C.
Lee:
* Department of Chemical Engineering, Lunghwa Junior College of Technology and Commerce, Kuei-Shan, Tao-Yuan, No 300 Sec 1, Wan Sou Road, Tao-Yuan, Taiwan:
: Department of Chemical Engineering, National Taiwan University, Taipei, Taiwan (Accepted 1 July 1997)
Abstract--The polymorphism of calcium carbonate crystal was studied by introducing CO2 gas through a gas sparger or a double-tube gas injection nozzle into a pH-stat crystallizer containing calcium chloride solution. Several operating variables were investigated and the pH of solution and calcium ion concentration were the important factors that affect the formation of polymorphs of calcium carbonate. At ambient temperature either calcite or vaterite was the major product, depending on the pH and calcium ion concentration. Then the same crystalliza- tion system was employed to study the growth kinetics of calcite crystals, using a double-tube gas injection nozzle instead of a gas sparger, which cannot be used to suppress nucleation, to introduce the CO2 gas into the crystallizer. The growth rates of calcite seeds increased with increasing supersaturation and crystal size. As a conclusion, the polymorphs and growth rate of calcium carbonate are controllable in a gas-liquid-solid reactive crystallizer, using a pH-stat operation mode. C 1997 Elsevier Science Ltd
K e y w o r d s : Polymorphism; calcium carbonate; crystal growth: gas-liquid -solid system: two- step growth model; induction period.
I. I N T R O D U C T I O N
Calcium carbonate is a widely used chemical in vari- ous industries and an abundant compound found in the nature. The crystallization phenomena of this sparingly soluble salt are very complicated because it precipitates in three crystalline forms, including calcite, aragonite, and vaterite, and the operating variables, such as the pH of solution, solution com- position, temperature, and ionic strength, are interrelated and interact on each other in a crystalliza- tion process.
The l i q u i d liquid-solid reactive processes are often adopted in a laboratory study because of its simplicity in the operation or its easiness in the control of process variables. For example, Wray and Daniels (1957) investigated the polymorphs of calcium car- bonatc precipitates by mixing soluble carbonate solutions with solutions of calcium ions under condi- tions of controlled temperature, concentration, and aging: Sohnel and Mullin (1982) determined the growth rate of crystals by a desupersaturation method
' Corresponding author. Tel.: 00 886 2 902321 I; fax: 00 886 2 9044650.
and explored the effects of impurities on crystal mor- phology; Hostomsky and Jones (1991) found that the crystal form was dependent on the residence time, pH, and the concentration of reagents in an MSMPR crystallizer; Tai et al. (1993) and Koutsoukos (1993} studied the growth kinetics and morphology using a pH-stat method; Tai et al. (1995) and Wojcik and Jones (1997) investigated the dynamic and kinetic behaviors in the agglomeration process of CaCO3 precipitates: and Isopescu et al. (1996) analyzed the crystallization data based on the size-dependent growth model. However, the precipitated calcium car- bonate are produced commercially by passing carbon dioxide through a milk of lime, i.e. by a gas-liquid .... solid reacting method. Studies on gas liquid-solid systems are rare because the process variables are interrelated and are difficult to control as compared with the liquid-liquid-solid systems. The report by Yagi et al. (1984) was perhaps the first one to system- atically study the three-phase system. However. the crystallizer used was a stirred vessel with a flat gas-liquid interface, which has no practical use. Be- sides, there was no control of the pH of solution during the course of precipitation. Jones and his coworkers (Wachi and Jones, 1991; Jones et al., 1992) continued to perform similar experiments and 4171
4172 P.-C. Chen et al.
modeled the crystal size distribution of CaCO3 pre- cipitates with some degree of success. Kojima et al.
(1992) studied the crystal morphology of calcium car- bonate which was precipitated by outgassing dissolved CO2 in calcium hydrogencarbonate solu- tion. Although the pH of solution was not controlled during the precipitation process, they were able to produce rhombohedral-like calcite, prismoidal-like aragonite, and hexagonal plate-like vaterite with the initial pH of solution varying between 6.2 and 8.0 and the temperature between 20 and 10OC.
In our laboratory a gas-liquid--solid reactive cry- stallizer was employed to study the polymorphs of calcium carbonate and the growth rate of calcite crys- tal, which is the thermodynamically stable form of calcium carbonate at atmospheric pressure and ambi- ent temperature. The CO2 gas was introduced into the crystallizer, in which the concentration of hydrogen ion was maintained at a constant level by using a pH- star apparatus, through a double-tube injection nozzle or a gas sparger. Several process variables, including the pH of solution, concentration of calcium ion, concentration ratio of [ H C O 3 ] / [ C O 3 2 ] , and gas liquid mixing mode were investigated. The results on the polymorphs of calcium carbonate and the crystal growth kinetics of calcite were compared with those obtained from the liquid-liquid-solid systems.
2. EXPERIMENTAL
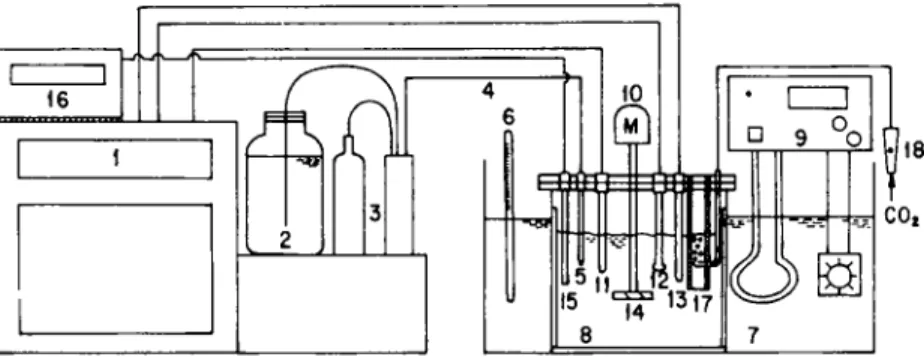
A schematic diagram of the semibatch crystalliza- tion apparatus is shown in Fig. 1. It consists of a pH- stat autotitrator (Kyoto Electronic AT 200), an ion meter (Orion EA 920), a 1.51 acrylic crystallizer, a con- stant-temperature water batch, and a double-tube gas injection nozzle or a gas sparger. The diameter and height of the crystallizer, fitted with four bafl:les at 900 spacing, are 120 and 140 mm, respectively. The con- struction of the double-tube gas injection nozzle followed the design of Kubota et al. (1990) as shown in Fig. 2. The advantage of this design is to avoid nuclea- tion in the outer tube, where CO2 gas contacts with solution bearing a low pH. The pH of solution was measured by means of a pair of glass (Kyoto Elec- tronic H-I t2) and reference (Kyoto Electronic R-116)
electrodes, standardized before each experiment with standard buffers of pH 6.86 and 9.18. Thc CO2 gas dissolved in solution as carbonates was measured by a CO2-electrode (Orion Research), which was calib- rated with a standard solution of sodium carbonate. All the experiments were conducted at 30'C.
The experiments were first performed for the study of crystal morphology. A solution of desired concen- tration was prepared using the calcium chloride crystals as received (Merck, EP Grade) and deionized water. After being filtered, 1 I of solution was transfer- red to the crystallizer with thc impeller running at 600 rpm, which is high enough to suspend CaCO3 crystals in all experiments conducted in this study. Then the pH of solution was adjusted to a desired value by adding drops of 0.1 M KOH solution. After the pH became steady, we opened the regulator of CO2 gas cylinder and let the C O , gas flow through the injection nozzle to contact with the solution. The pH of solution was maintained at a constant level during the operation by constantly adding KOH solution, which was controlled by the autotitrator. The concentration of solution was kept in the labile region, where the supersaturation is so high that the primary nucleation would occur to produce nuclei, of a precipitation diagram which was plotted previously (Chen, 1995) and was shown in Fig. 3. The calcium carbonate was precipitated after an induction period, and the operating time varied from 30 to 100 min, depending on the production rate of precipitates. In the course of reactive precipitation, a solution of 2.5 ml was withdrawn from the crystallizer every 3 min and was filtered with a 0.22 lam membrane to remove solid particles for subsequent analysis of Ca 2 + concentration using the atomic absorption method. Finally, after the precipitated particles were filtered and dried, the morphology of precipitates was exam- ined by a scanning electron microscope and the fraction of polymorphs was determined by a X-ray powder diffractometer.
The experimental procedures in thc crystal growth study were somewhat different from that of morpho- logy study. A certain amount of calcite seeds were added to the crystallizer after the pH of solution became steady. Besides, the flow of CO2 gas was
16
I
'
I
I0 I M I ~ i ~ 14 • t 10 9 ° 0
:I Ir
Fig. I. Schematic diagram of pH-stat crystallization system.
t
l8 COzE
Ht .--_
qp
H z
I
Morphology and growth rate of calcium carbonate crystals
Fig. 2. Detailed structure of double-tube gas injection nozzle. (1) outer tube, (2J gas inlet tube, 13) upper opening, (4)
orifice. (5) lid, D, = 11 mm, D~ = 3mm, ft~ = 100mm, 112 = 18mm. 5.C 4 . 0 ~ . Stable
"~.
(Undersoluration)~
k~etottable'~-~
Lo~
" \ \ \ . , , , J2;~ t t ~ I i i i i t'Ct.0 3.0 4.0p(co)r
i - 3 . 0 2 . 0Fig 3. Precipitation diagram of calcium carbonate.
adjusted to a slower rate so that the concentration of solution fell in the metastable region of Fig. 3, in which the seed crystals grew without nucleation. Four sizes of seeds, i.e. 68, 163, 230, and 328 lam, were prepared by the gel growth technique, which has been
described elsewhere (Tai et al., 1993). The smallest
seed crystals studied in this experiment were 20 lam in size, which was obtained by screening the calcite as received from Nacalai Tseque Company. The mor- phology of all seed crystals is rhombohedron.
3. D E T E R M I N A T I O N O F R E L A T I V E S U P E R S A T U R A T I O N
AND CRYSTAL GROWTH RATE
3.1. Relative super.saturation
The relative supersaturation, a, used in this work was defined by Nielsen and Taft (1984):
a = (FI.:K~p) t'2 - 1 (1)
where Pl is the ionic product and K,~, is the solubility product. When the pH of solution, total calcium ion concentration, total carbonate concentration, and ac-
tivity coefficient equation were known, the
concentrations of ionic species were calculated by the method of successive approximation for the ionic
strength (Nancollas. 1966: Tai et al., 1993).
3.2. Determination of crystal growth rate
The mass growth rate per unit surface area of crys- tal can be expressed as follows:
1 dm p~dV~ 3 p j i d L
- - - - ( 2 )
.4 dt A dt J~ dt
where ,4, V~ and p~ are the surface area, volume, and density of seed crystals, respectively. The linear growth rate is related to the mass growth rate by the following equation,
dL ./~ dm
G - dr -3[i.p~A dt 13)
where mass growth rate, dm/dt, can be estimated from
the depletion of calcium ion.
( d[Ca2" 1~
dm = MV {4)
dt dt ] '
where M is the molecular weight of calcium carbon- ate, V the volume of solution, and [-Ca 2 * ] the molar concentration of calcium ion. Because the crystal form of calcite is rhombohedron, the value ofJ~:'3f,, is close to 2. Substituting this value and eq. (4J into eq. (3). the linear growth rate becomes:
d L _ 2 M V _ ( d [ C a 2 " ] ) (5,
G - dt p~A \. dt '
Equation 15) describes the linear growth rate as a function of calcium ion concentration. Once the concentration profile of calcium ion is available, the linear growth rate can be calculated at any instance of an experiment.
3.3. Growth rate model
Although the crystal growth rates may be in- fluenced simultaneously by two or more mechanisms, the two-step model is commonly used to express a growth process as follows:
G = Kdla - ai) = K~oL"(a - ai) (bulk diffusion) (6)
4174
Combining eqs (6) and (7) by eliminating oi, the resultant equation is
G ( G "~ lr ( 7 - -F
KaoL" \K~oLb] "
P.-C. Chen et al.
4.2. Polymorphs oJcalcium carbonate
Thirty-three runs of experiment were conducted in this work to study the polymorphs of calcium carbon- ate. The percentage of polymorphs produced and the
(8) operating conditions are listed in Table 1. The pH
range investigated was between 7.8 and 9.4. When the pH is lower than 7.8. the amount of precipitates pro- duced was small. On the other hand, the control of the pH was difficult at higher pH. The carbonate ion concentration and bicarbonate ion concentration were calculated at the highest relative supersatura- tion, a,,. Then the ratio of bicarbonate ion
concentration to carbonate ion concentration, Cr,
was plotted against calcium ion concentration for different values ofpH as shown in Fig. 5. It is surpris- ing to see that the Cr value decreases with increasing Ca 2÷ concentration at lower pH values. Under our operating conditions, the pH of solution is the most important factor that influences the formation of polymorphs of calcium carbonate. Nearly, pure prod- ucts of vaterite were produced at pH below 8.0. The concentration of calcium ion seems to be a minor factor in the determination of vaterite. This result is
contradictory to that reported by Yagi et al. (1984).
They found that vaterites were produced at low Ca 2 concentration ( < 0.4 mM). However, the pH of solu- tion was not measured in their experiments. The maximum yield of calcites occurs somewhere around the pH of 8.6 for each series of experiment at a speci- fied range of calcium ion concentration. This result is similar to that reported by Hostomsky and Jones (1991), who found that the maximum yield for calcite appeared at a pH of 8.5. The yield of calcite is also related to calcium ion concentration and gas disper- sion method. The yield is highest for run 24, which has a high Ca 2 ~ concentration (15.9 mM). The results are
consistent with that reported by Yagi et al. (1984) and
Wachi and Jones (1991). When the CO2 gas was introduced into the crystallizer through a gas sparger in the experimental series I and II, the yield of calcite at a similar calcium ion concentration is higher than that of the experiments (series III and V) using the double-tube gas injection nozzle. As for aragonite. a small amount was produced at 30'C for high pH and calcium ion concentration irrespective of the gas- dispersion method.
Parameters a, b, K,,o, and K,0 in eq. (8) can be
evaluated by a nonlinear regression method for a given value of r, when the supersaturation and growth rate data are available.
4. RESULTS AND DISCUSSION
4.1. Supersaturation and induction period
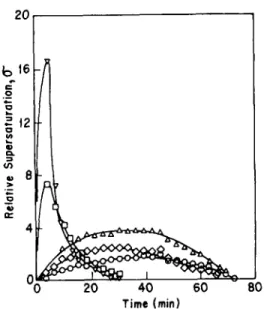
During the course of precipitation the supersatura- tion varied with time due to the accumulation or depletion of constituents. Figure 4 shows the change of relative supersaturation for various levels of pH under a constant flow rate of CO2 gas. All the curves in Fig. 4 exhibit a maximum, which approximately corresponds to the induction period because the de- crease in supersaturation was caused by the commencement of nucleation. Therefore, the induc- tion period of higher pH was shorter than that of lower pH. Besides, two different shapes of super- saturation curves are observed in Fig. 4; the changes in supersaturation for lower pH were moderate as compared with that of higher pH. The possible rea- sons are given below. The absorption rate of CO2 was
higher at higher pH (Sherwood et al., 1975; Butler,
1982) so that the supersaturation increased sharply for higher pH, starting with approximately the same Ca 2" concentration for all levels of pH. Then, high nucleation rate at high supersaturation gave a quick drop in supersaturation. 20
t2r
8o 20 40 60 Time (rain)Fig. 4. Supersaturation profile of various levels of pH. (~1 pH = 9.0. IF) pH = 8.8. (A) pH = 8.4, (~) pH = 8.2, (O)
pH = 8.0.
4.3. Growth rate o[calcite crystals
In the growth rate study, the CO2 gas was intro- duced to the crystallizer through the double-tube injection nozzle. When a gas sparger was used, the suppress of nucleation in the crystallizer was not suc- cessful. Therefore, a comparison of growth-rate data between the two modes of gas dispersion is impos- sible. Growth rate of calcite crystals were estimated by eq. (5) using the slope of Ca 2. concentration profile, which is shown in Fig. 6 for three typical runs. In principle, growth rate of any instance can be obtained from a [Ca 2 . ] - t curve. Actually, the growth rates were calculated at a time interval of 10 or 20 min, depending on the steepness of [Ca 2 * ] - t curve. The
Table I. Crystal polymorphs of calcium carbonate at various operating conditions
Series Run
nO. no.
[Ca" 2], pH [HCO3 ]m [(?03 2],. a,, Crystal polymorphs
(mM) (mM) (mM) V {%) (" 1%l A ('%) I 1 2 3 4 5 6 11 7 8 9 10 11 12 Ill 13 14 15 16 17 18 19 1V 20 21 22 23 24 25 26 27 v 28 29 30 31 32 33 8.44 7.81) 42.86 (I.23 7 I(X) -- 8.64 8.00 63.84 0.56 9 86.5 13.4 8.46 8.20 55.48 0.85 12 84.3 15.8 8.43 8.40 28.61 0.58 11 86.2 13.7 8.00 8.60 44.74 1.45 15 63.9 31.2 4.7 8.56 8.80 26.10 1.33 15 33.7 62.9 3.2 4.44 7.8[) 50.79 0.27 3.5 1 O0 3.61 8.00 24.54 O. 19 4.5 90 9.0 3.61 8.20 26.47 0.35 7 80.2 19.7 4.46 8.40 33.98 0.68 9 30.7 69.2 .- 4.44 8.60 19.16 0.49 10 89.8 10. I .- 4.44 8.80 15.30 0.69 10.5 74.4 8.0 17.6 5 . 0 8 7 . 8 0 2 5 . 5 0 0 . 1 4 3.9 1 O0 - - 5.08 8.20 18.74 0.23 7 100 . . . . 5.08 8.40 44.76 0.94 11 84.6 15.3 - 5.36 8.60 42.49 1.43 13 76.8 23.1 5.30 8.80 30.19 1.49 15 77.1 22.8 5.34 9.(X) 12.32 0.87 14 68.9 8.0 23.1 5.44 9.20 7.24 0.79 12 77.6 .... 22..3 13.50 7.80 11.48 0.05 2.9 100 -- 14.00 8.00 12.22 O. 14 6.5 1 O0 15.30 8.20 20.20 ().41 9 77.8 22.1 13.99 8.40 20.36 0.55 12 42.9 57. I 15.90 8.60 18.80 0.66 17 22.1 77.8 - - 20.00 9.{X) 6.25 0.42 15 71.8 28.1 16.63 9.20 5.64 0.60 22 77.8 • - 22.3 16.69 9.4{) 9. I 8 1.27 22 73.8 26.2 3.03 8.00 23.46 0.18 2.1 95.0 5.0 3.09 8.20 13.99 0.16 2.5 85.6 14.3 3.09 8.40 20.35 {).38 3.8 82.3 17.7 3.18 8.60 11.42 0.32 4.3 74.0 26.{) - 2.96 8.80 6.32 0.26 7.3 81.9 18.1 - - 2.90 9.{)0 8.66 {).60 10.6 81.9 18.1 -
V: Vaterite; C: Calcite: A: Aragonite
crystal g r o w t h d a t a of the seeds of various sizes were plotted against the relative s u p e r s a t u r a t i o n as s h o w n in Fig. 7. The crystal g r o w t h rates increase with in- creasing s u p e r s a t u r a t i o n a n d crystal size. Using the t w o - s t e p g r o w t h model, the p a r a m e t e r s in eq. (8) were estimated by a n o n l i n e a r regression m e t h o d for small- er crystal sizes, including 20, 68 a n d 163 l~m. The g r o w t h - r a t e d a t a of larger sizes were excluded in the analysis because the increase in growth rate was not significant.
The regressed g r o w t h - r a t e e q u a t i o n is presented as follows.
G = 5.54 x 10⁻⁹L°86°(o - - o ' i ) (9) = 4.40 × 10- 11L°'5°30"2"~°. (10) The mass-transfer and surface-integration rates are related to crystal size. This kinetic behaviors are c o m -
monly observed in crystal g r o w t h processes (Tai et ul., 1993). The kinetic o r d e r of surface integration step is 2.9, which is higher than 2 found in a liquid-liquid reacting system (Tai et al., 1993) a n d is close to 3.0 reported by Qiu and R a s m u s o n (1990) for succinic acid.
O n c e the p a r a m e t e r s in the g r o w t h - r a t e model are known, the controlling step of g r o w t h process can be judged by the effectiveness factor p r o p o s e d by G a r s i d e (1971). The surface-integration effectiveness factor for an r t h - o r d e r process is
tl = (l - qDa)" 111)
where
Da = K r o L h - ~ a ' - l:Kao. 112) E q u a t i o n {11) is plotted in Fig. 8. Since r / a p p r o a c h e s 1, the g r o w t h process is controlled by surface
4176 P.-C. Chen et al. 2 0 0 150 0
~ f o o
0 50 / 3 - - 0 I I t J 0 5 t0 t5 20 25 Co Concentration (mM)Fig. 5. Effect of calcium ion concentration on Cr. (A) pH = 8.0, (~) pH = 8.2, (O) pH = 8.6, ( ? ) pH = 8.8, (D} pH = 9.0. 1=
E.
.4= i : 0 i... (,D tO -e 10 -9 io-fO 10-11 t0-12 t0-13 IC////
i i i i l f l l l i i i I I i i i i i i i i 1 1 i0 "ff
Relative Supersaturation ~ G" t0Fig. 7. Calcite crystal-growth rates. (F]) L = 20p.m, (A) L=68p.m, (©) L=163p.m, (O) L=2301am, (V)
L = 328 lam. E G 0 i - q U o 2.0 1.5 f.O 0.5 0 30 60 90 120 f50 Time (rain) 1.0 0.8 0.6 0 0 h ,~ 0.4 C U ~ 0.2 , , , , I J f l l ~ 04 10 .5 tCf 2 10 "1 t t0 t02 t Domkohler Number, Do
Fig. 8. Effectiveness factors of calcite growth.
Fig. 6. Ca -+ concentration profiles. (i-q) Run no. 27, (A) Run no. 2, (O) Run no. 4.
integration. The result is consistent with many reports (Nancollas and Reddy, 1971; Kazmlerczak et al., 1982; Christoffersen and Christoffersen, 1990) for the growth of calcite.
5. CONCLUSIONS
A gas-liquid-solid reactive crystallizer was success- fully operated under the condition of constant pH to study the formation of polymorphs of calcium carbonate and crystal growth of calcite. In the polymorph study the CO2 was introduced into the crystallizer by a gas sparger or a double-tube injection
nozzle; however, the gas sparger cannot be used in the crystal growth study. Among the operating variables investigated in this study, the pH of solution and calcium ion concentration are the important factors that determine the polymorphs of calcium carbonate. When operated at 30~C, nearly pure products of vaterite are produced at pH below 8.0 in spite of the gas-dispersion method. The maximum yield of calcite occurs somewhere around the pH of 8.6. The yield of calcite is also influenced by the calcium ion concentra- tion and gas-dispersion method. High concentration of calcium ion favors the formation of calcite. The aragonite is a minor product at 30=C. The crystal growth rate of calcite seeds increases with increasing supersaturation and crystal size, and the crystal growth process is controlled by surface integration.
Morphology and growth rate of calcium carbonate crystals
Acknowledgment
This work was financially supported by the National Science Council of Republic China.
~3 A b Cr Da L G K, K~t, L M t?!
R~
r [ V [/s N O T A T I O Nexponent of crystal size in eq. (6) specific surface area, m 2
exponent of crystal size in eq. (7)
ratio of [ t l C O f ] to [CO~-] Damkohler number surface shape factor volume shape factor linear growth rate, m/s mass-transfer coefficient, m/s surface-integration coefficient, m.'s solubility product
crystal size, m
molecular weight, kg/kg mole crystal mass, kg
mass growth rate, kg/mZs surface-reaction order time, min volume of solution, m 3 volume of crystal, m 3 Greek letters c~ relative supersaturation
¢r~ interfacial relative supersaturation p.~ density, kgim 3
r/ surface-integration effectiveness factor FI ionic product
REFERENCES
Butler, J. M. (1982) Carbon Dioxide Equilibria and
Their Application, pp. 75-78. Addision-Wesley,
London.
Chen, C.-Y. (1995) Crystal growth kinetics of calcium carbonate in a fluidized bed. Master thesis, Nation- al Taiwan University.
Christoffersen, J. and Christoffersen, M. R. (1990) Kinetics of spiral growth of calcite crystals and determination of the absolute rate constant.
J. Cry.stal Growth 100, 203-211.
Garside, J. (1971) The concept of effectiveness factors in crystal growth, Chem. Enyng Sci. 26, 1425-1430. Hostomsky, J. and Jones, A. G. (1991) Calcium car-
bonate crystallization, agglomeration and form during continuous precipitation from solution. J.
Phys. D 24, 165 170.
lsopescu, R., Mocioi, M., Zahanagiu, F. and Filipescu, L. (1996) Growth rate models and kinetics estima- tion for CaCO3 precipitated in continuous crystallizers..I. Crystal Growth 167, 260 264.
Jones, A. G., Hostomsky, J. and Li, Z. (1992) On the effect of liquid mixing rate on primary crystal size during the Gas-Liquid precipitation of calcium carbonate. Chem. Enyng Sei. 47, 3817-3824. Kazmlerczak, T. F., Tomson, M. B., and Nancollas.
G. H. (1982) Crystal growth of calcium carbonate. A controlled composition kinetic study. J. Phys.
Chem. 86, 103 107.
Kojima, Y.. Sadotomo A., Yasue, T. and Arai, Y. (1992) Control of crystal shape and modification of calcium carbonate prepared by precipitation from Calcium Hydrogencarbonate solution, .I. Ceramic
Sot'. Japan Int. Ed. 100, 1128-I 135.
Koutsoukos. P. G. (1993) Polymorphism in the cal- cium carbonate system. 12th lndu.~trial Crystallization, 2-115-2-121, Warsaw, Poland.
Kubota, N. Sekimoto, T. and Shimizu, K. (1990) Pre- cipitation of BaCO3 in a semibatch reactor with double-tube gas injection nozzle, d. Crystal Growth 102, 434-440.
Nancollas. G. 13. (1966) Interaction in Eleetr,lyte Solu-
tion, pp. 36 43. Elsevier. Amsterdam.
Nancollas, G. H. and Reddy, M. M. (19711 The crys- tallization of calcium carbonate, It. Calcite growth mechanism. J. Colloid Interface Sci. 27, 824-832. Nielsen, A. K. and Toll, J. M. (1984) Electrolyte crys-
tal growth kinetics, J. Crystal Growth 67, 278- 288. Qui, Y. and Rasmuson, C. (19901 Growth and dissolu- tion of succinic acid crystal in a bath stirred crystallizer, A.I.Ch.E.J. 36. 665.-676.
Sherwood, T. K.. Pigford, R. J. and Wilke. C. R. [1975)
Mu,~s Trcm.~/~'r, pp. 336 343. McGrow-Hill, New
York.
Sohnel, O. and Mullin. J. W. (1982) Precipitation of calcium carbonate, d. ('rystal Growth 60. 239 250. Tai. C. Y. and Chen, P. C. (1995) Nucleation, agglom- eration and crystal morphology of calcium carbonate. A.I.Ch.E.J. 41, 68 ..77.
Tai, C. Y.. Chen. P. C. and Shih, S. M. (1993) Size- dependent growth and contact nucleation of calcite crystals. A.I.Ch.E J. 39, 1472-1482.
Wachi, S. and Jones, A. G. (1991l Effect of gas-liquid mass transfer on crystal size distribution during the batch precipitation of calcium carbonate. Chem.
Engng Sei. 46, 3289-3293.
Wojcik, J. A. and Jones, A. G. (1997) Experimental investigation into dynamics and stability of con- tinuous MSMPR agglomerative precipitation of CaCO3 crystals. Trans. Instr. Chem. Emln,q 75. Part A, 113 118.
Wray, J. L. and Daniels, F. (1957) Precipitation of calcite and aragonite. J. Am. Chem. Soc. 79, 2031-2034.
Yagi, H.. lwazawa, A., Sonobe, R., Matsubara, T. and Hikita. H. (1984) Crystallization of calcium carbon- ate accompanying chemical absorption. Ind. Em#7.q