生物學報(2011)46(1):41-55 * 通信作者:陳世煌(Shyh-Hwang Chen);FAX:886-2-29312904;E-mail:[email protected]
台灣中部能高越嶺道五種不同植被類型蜘蛛多樣性之比較
楊典諺 陳世煌*
國立臺灣師範大學生命科學系 (收稿日期:2012.3.15,接受日期:2012.8.8) 摘 要 能高越嶺道橫跨中央山脈,海拔約1600~2900 m,全線具有多樣的植被類型,可作為探 討中、高海拔山區不同植被類型蜘蛛組成與多樣性之比較,及其可能形成原因。本研究選取 松-闊葉樹混淆林(PH)、松林(P)、鐵杉-闊葉樹混淆林(HH)、鐵杉-冷杉混淆林(HF)及 草原(G)五種植被類型作為研究區域。每種植被類型各設置 8 個 5 m × 5 m 的樣區,總共 有40 個樣區,再以掉落式陷阱及掃網兩種方法,分別調查樣區內地表及灌叢活動的蜘蛛。 本研究從2010 年 3 月起至 2011 年 3 月止,除了 2010 年 7 月及 2011 年 2 月因氣象因素外, 每月調查一次,合計共紀錄蜘蛛28 科 159 種 9155 隻,包括成蛛 2847 隻,若蛛 6308 隻。其 中掃網調查共紀錄112 種 6565 隻蜘蛛,掉落式陷阱為 65 種 2590 隻。ANOVA 分析結果顯 示不同植被類型間蜘蛛群落結構有顯著差異:P、PH 及 HH 的 Shannon index 顯著高於 G 及 HF;HF 的 Simpson index 則顯著高於 PH、P 及 HH;HH 的 Evenness index 顯著高於 HF。 各植被類型蜘蛛群落結構的差異似乎可反映彼此間植被結構與覆蓋度的差異。利用兩兩樣區 間之Euclidean distance 進行的群聚分析,顯示所有樣區可區分為三群,分別是森林群(Forest group)、草原群(Grassland group)與混合群(Mixed group),屬於同一群的樣區通常有相似 的環境與蜘蛛物種組成。本研究成果可作為日後環境監測的參考。 關鍵詞:生物多樣性、蜘蛛、植被類型、能高越嶺道、台灣緒 言
蜘蛛是陸域生態系中種類與數量豐富的 掠食性無脊椎動物 (Wise, 1993),全世界目前 約有42000 種 (Platnick, 2012)。蜘蛛主要以昆 蟲和其他節肢動物為食 (Wise, 1993; Foelix, 1996),在塑造陸域節肢動物群落上扮演重要 的角色,因此有學者認為蜘蛛具有控制農田害 蟲族群的潛力 (Marc et al., 1999; Nyffeler and Sunderland, 2003)。此外,蜘蛛種類、數量或 多樣性會受到棲地結構 (Balfour and Rypstra, 1998; Halaj et al., 2000; Borges and Brown, 2001; Jiménez-Valverde and Lobo, 2007; Ziesche and Roth, 2008)或是濕度、雨量、光線 和火 (Churchill, 1998; Langlands et al., 2006; Ziesche and Roth, 2008; Muff et al., 2009)等環 境因子的影響而變動,例如:Churchill (1998) 的研究發現隨著地區年降雨量減少,狼蛛科 (Lycosidae)的蜘蛛數量跟著減少,但擬平腹蛛 科(Zodariidae)的數量卻有增加的趨勢;Halaj et al. (2000) 發 現 Douglas fir (Pseudotsuga menziesii)在移除針葉及減少枝條後樹冠層蜘蛛數量顯著減少,而在捆住兩相鄰枝條的頂端 (1 m 長)後蜘蛛數量則顯著增加。由於蜘蛛易 受外力或環境的影響,因此適合作為指標生物, 可用來評估干擾或環境變動對蜘蛛群落結構 的衝擊 (Maelfait and Hendrickx, 1998; Laeser et al., 2005; Warui et al., 2005; Petillon et al., 2006; Haddad et al., 2009),例如:Laeser et al. (2005)調查四種類型溪流 (未受干擾、溪岸植 被遭移除、溪流截彎取直但已長出植被、以及 溪流截彎取直且植被遭移除) 的溪岸結網蜘 蛛數量,結果發現在受到單一或雙重干擾的棲 地,蜘蛛數量減少了70%以上,蜘蛛科數也減 少。 目前有關蜘蛛多樣性的研究,大多在低海 拔地區進行,其中有許多是研究農田生態系的 蜘 蛛 多 樣 性 (Draney, 1997; Downie et al., 1999; Schmidt et al., 2005; Öberg et al., 2007; Drapela et al., 2008),例如:Öberg et al. (2007)
的研究發現農地邊緣(相較於農地內部)狼蛛
活動密度較高、皿蛛物種數較多,而在較複雜 的地景中皿蛛活動密度較高、狼蛛物種數較多。 中、高海拔地區的研究相對較少,較近期的研
究例如:Muff et al. (2009)發現瑞士高山森林 線交界(海拔 1950 m)有較多樣的蜘蛛群落,可 能與具有較多樣的棲地類型有關;Negro et al. (2010)發現蜘蛛的數量及種數從天然的草地 到阿爾卑斯山的滑雪道(海拔 2500~2900 m)有 顯著的減少,顯示阿爾卑斯山的滑雪道對蜘蛛 群落有明顯的衝擊。國內也有學者研究蜘蛛多 樣性,不過主要在台灣南部低海拔地區,例如: Hsieh et al. (2003)研究墾丁高位珊瑚礁森林不 同干擾程度棲地(原始林、有遊客活動的原始 林、次生林、有遊客活動的草原及廢棄的草原) 的 地 表 蜘 蛛 多 樣 性 , 發 現 Shannon-Weaver function、Simpson index 及 Evenness 在這些棲 地間都沒有顯著差異;Chen and Tso (2004)研 究蘭嶼不同干擾程度棲地(原始林、低度干擾 的耕林地、中度干擾的人造林、森林砍伐殆盡 後形成的草原)的蜘蛛多樣性,發現四種棲地 的Margalef species richness、Shannon-Weaver function 或 Simpson index 都沒有顯著差異,但 原始林的Evenness 顯著較低;Tsai et al. (2006) 亦研究蘭嶼這四種棲地的蜘蛛多樣性,發現耕 林地的蜘蛛密度、Margalef species richness 及 Shannon-Wiener function 都顯著高於其他三種 棲地;相較於原始林,耕林地受到原住民較多 干擾,灌叢植被密度較低,但蜘蛛多樣性較高, 顯示蘭嶼原住民的棲地經營似乎能維持當地 較高的蜘蛛多樣性。 由於國內缺乏中高海拔地區的蜘蛛多樣 性研究,且由前人研究得知蜘蛛對棲地結構或 其他環境因子的變動較敏感,而位於台灣中部、 跨越中央山脈的能高越嶺道,具有多樣的植被 類型,分別具有不同的棲地結構及覆蓋度等可 能影響蜘蛛群落的環境因子,適合作為中高海 拔不同植被類型的蜘蛛多樣性之研究。本研究 主要目的是:1. 了解能高越嶺道不同植被類 型間的蜘蛛組成與多樣性是否有差異;2. 藉 由各植被類型蜘蛛組成的分群,探討棲地結構 等環境因子如何影響其蜘蛛組成;3. 研究結 果將可作為日後環境監測的參考。
材料與方法
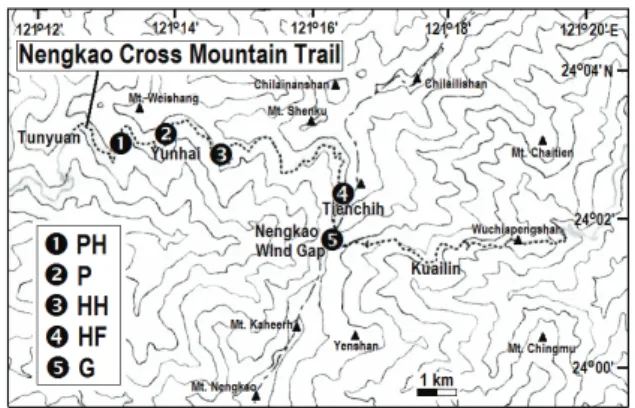
研究地區 一、能高越嶺道環境概況 從南投縣仁愛鄉屯原登山口至花蓮縣秀 林鄉奇萊登山口,全長約26 km。橫跨中央山 脈,沿線海拔約在1600~2900 m 之間 (圖一)。 根據能高越嶺道上雲海保線所氣象站(海拔 圖一、能高越嶺道五種植被類型樣區之位置。 1, 松-闊葉樹混淆林(PH);2,松林(P);3,鐵杉-闊葉樹混淆林(HH);4,鐵杉-冷杉混淆林(HF); 5,草原(G)。Figure 1. The locations of sampling plots of five
vegetation types along the Nengkao Cross Mountain Trail. 1, Mixed pine-hardwood forest (PH); 2, Pine forest (P); 3, Mixed hemlock-hardwood forest (HH); 4, Mixed hemlock-fir forest (HF); 5, Grassland (G). 2360 m)測得 2008 年氣象資料(該氣象站在 2010~2011 年研究期間故障)顯示,該地之年均 溫為12.1℃,最低溫月份為 2 月 5.8℃,最高 溫月份為8 月 16.1℃,年降雨量為 4194 mm, 最高月降雨量為9 月 1978 mm。全線具有多樣 的植被類型,從西部的崩塌地草坡、半落葉林、 松-闊葉樹混淆林、松-鐵杉混淆林、松林、鐵 杉-闊葉樹混淆林、松-鐵杉-芒疏林、鐵杉-冷杉混淆林,到東部的草原、松林、檜木-闊 葉樹混淆林、常綠闊葉林 (王等,2008)。由 於 2008 年 9 月風災的影響,能高越嶺道 18.6 km 附近嚴重坍方,難以通行,故 18.6 km 之 後的路段難以進行研究。因此本研究集中在能 高越嶺道0~18 km 的路段。 二、研究樣區位置及各植被類型概況 根據植被的範圍、樣區設置難易度及地質 穩定度等因素,本研究選擇五種較適合設置樣 區的植被類型,分別是松-闊葉樹混淆林、松 林、鐵杉-闊葉樹混淆林、鐵杉-冷杉混淆林及 草原(王等,2008;圖一、二)。各植被類型概 況(王等,2008)分述如下: 1. 松-闊葉樹混淆林(Mixed pine-hardwood forest; PH)(圖二 A):約位於步道 1.5~3.5 km,海拔 2100~2300 m,主要由台灣二葉 松Pinus taiwanensis、華山松 Pinus armandii var. mastersiana 及闊葉樹組成。樣區位於 步道1.8~3.2 km。
2. 松林(Pine forest; P)(圖二 B):約位於步 道4.5~7.7 km,海拔 2300~2600 m,以台灣 二葉松、華山松及台灣鐵杉Tsuga chinensis
台灣中部能高越嶺道五種不同植被類型蜘蛛多樣性之比較 43 var. formosana 為主,下層草本植物以五節 芒 Miscanthus floridulus 或 玉 山 箭 竹 Yushania niitakayamensis 較為優勢。樣區位 於步道 4.5~5.1 km,植被主要由台灣二葉松 及五節芒組成。 3. 鐵 杉 - 闊 葉 樹 混 淆 林 ( Mixed hemlock- hardwood forest; HH)(圖二 C):約位於步 道 7.7~11 km,海拔 2600~2800 m,以台灣 鐵杉為優勢樹種,約佔森林覆蓋面積 60%, 其餘以闊葉樹為主。樣區位於步道 7.7~9.1 km。
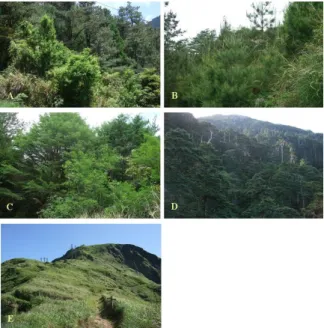
4. 鐵杉-冷杉混淆林(Mixed hemlock-fir forest; HF)(圖二 D):約位於步道 13.2~15.2 km, 海拔 2800~2900 m,上層以台灣鐵杉、台灣 冷杉 Abies kawakamii 為主,下層草本植物 多為玉山箭竹。樣區位於步道 13.4~14.1 km。 5. 草原(Grassland; G)(圖二 E):約位於步 道 15.2~17.4 km,海拔 2600~2900 m,以玉 山箭竹較為優勢,但在向陽裸露草坡主要 為 高 山 芒 , 有 少 數 玉 山 小 蘗 Berberis morrisonensis 或 玉 山 杜 鵑 Rhododendron pseudochrysanthum 等小灌木分布其中。樣 區 1~3 位於步道 15.7~15.8 km,樣區 4~8 位於步道的分支路線(往南華山的小徑)。 三、樣區設置 每種植被類型設置 8 個大小為 5 m × 5 m 的樣區,共 40 個樣區。樣區間距 20 m 以上。 各植被類型樣區的概況如下: 1. 松 - 闊 葉 樹 混 淆 林 樣 區 ( Mixed pine- hardwood forest; PH):樣區 1~8 的灌木層都 有闊葉樹,地表含有二葉松針及闊葉樹枯 葉形成的落葉堆。樣區 3、5、7 的闊葉樹 較茂密;樣區 1 有許多糾纏的枝條;樣區 6 有五節芒且地表植被較豐盛;樣區 7 有許 多低矮的蕨類。 2. 松林樣區(Pine forest; P):樣區 1~8 的灌木 層都有二葉松和茂密的五節芒,地表含有 二葉松針落葉堆,但落葉堆覆蓋度較低。 3. 鐵 杉 - 闊 葉 樹 混 淆 林 樣 區 ( Mixed hemlock-hardwood forest; HH):樣區 1~8 的灌木層都有闊葉樹,但密度較松-闊葉樹 混淆林樣區者為低,地表含有二葉松針和 枯樹枝形成的落葉堆。樣區 1、3、7、8 有 五節芒,但後三者的五節芒較低矮;樣區 5 的植被非常稀疏。 4. 鐵杉-冷杉混淆林樣區(Mixed hemlock-fir forest; HF):樣區 1~8 的灌木層都有玉山箭 圖二、能高越嶺道五種植被類型樣區之生態環境。 A,松-闊葉樹混淆林;B,松林;C,鐵杉-闊葉樹 混淆林;D,鐵杉-冷杉混淆林;E,草原。
Figure 2. Habitats of five representative sampling
areas along the Nengkao Cross Mountain Trail. A, mixed pine-hardwood forest (PH); B, pine forest (P); C, mixed hemlock-hardwood forest (HH); D, mixed hemlock-fir forest (HF); E, grassland (G).
竹,樣區 1~7 的地表有箭竹枯葉形成的落 葉堆,有苔蘚局部分布。樣區 1、2、4、5、 6、7 的箭竹較茂密;樣區 3 較開闊,箭竹 分布在樣區邊緣;樣區 8 的箭竹稀疏,但 有較高的闊葉樹,地表有許多枯樹枝。 5. 草原樣區(Grassland; G):樣區 1~8 都有玉 山箭竹,地表有箭竹枯葉形成的落葉堆。 樣區 1、3、6 分別有 1~3 棵矮灌木在其角 落或邊緣;樣區 2 為長草,有高山芒分布; 樣區 7 為短草。 研究方法
掉落式陷阱(Pitfall trap) (Draney, 1997; Schmidt et al., 2005; Warui et al., 2005; Ziesche and Roth, 2008; Muff et al., 2009)和掃網法 (Sweep-neting) (Chen and Tso, 2004; Warui et al., 2005; Jiménez-Valverde and Lobo, 2007)皆 為研究蜘蛛多樣性和生態監測常用的調查方 法,本研究亦將使用這兩種方法並做若干修正, 以進行蜘蛛採樣調查,調查時間和詳細方法分 述如下: 一、研究時間 掉落式陷阱及掃網調查皆從 2010 年 3 月 至 2011 年 3 月,每個月調查一次。但因當地 氣象因素影響,實際完成陷阱及掃網調查的月
份為 2010 年 3~5 月、8 月、10 月~2011 年 1 月、3 月。2010 年 6 月及 9 月僅完成掃網調查。 2010 年 7 月未調查。2011 年 2 月僅完成松-闊葉樹混淆林、松林、鐵杉-闊葉樹混淆林三 種植被類型的陷阱調查。此外,松林樣區6 的 植被在2010 年 8 月因步道整修被怪手剷除, 只有2010 年 3~6 月的調查資料,將不納入資 料分析。 二、掉落式陷阱(Pitfall trap) 主要採樣地表活動的蜘蛛。在每個樣區設 置一組掉落式陷阱,由5 個 50 ml-塑膠離心管 組成,分別位於四個角落及中央;離心管管口 直徑3 cm,內裝 20 ml 的 3%甘油酒精(配方為 1400 ml 水+ 500 ml 95%酒精+ 60 ml 甘油),埋 入地下使管口與地面齊平;上方有遮蔽的裝置, 由直徑15.8 cm 的塑膠盤及 3 根支撐的鐵絲組 成(圖三)。每月調查期間開啟 7 天收集掉落的 蜘蛛。挑出蜘蛛和其他動物,分別保存在70% 酒精內。非調查期間陷阱管口加蓋,以免動物 掉入。 三、掃網法(Sweep-netting method) 主要採樣灌叢活動或結網的蜘蛛。白天使 用網面直徑 45 cm 的昆蟲網在各樣區的植被 (高度 3 m 以下)不重複地掃動 30 次,每次揮 掃的圓弧長度約1.5 m,收集網內的蜘蛛並保 存在70%酒精內。 四、蜘蛛鑑定 成蛛鑑定至種,若蛛至少鑑定至科。科別 和學名依據Platnick (2011),鑑定主要參考陳 (2001)、Chikuni (1989)、Song et al. (1999)和 Shinkai (2006)等圖鑑。未能鑑定至種者,則以 形態種(Morphospecies)方式處理,並分別給予 物種編碼。除了成蛛,能鑑定至種或形態種的 若蛛亦納入資料分析,因為只使用成蛛會低估 蜘蛛群落,包含若蛛會較接近實際的蜘蛛群落 (Jiménez-Valverde and Lobo, 2006)。本研究所 獲之標本存放於國立台灣師範大學生命科學 系。 資料分析 一、各植被類型蜘蛛群落結構之比較 將地表與灌叢的蜘蛛合併,各植被類型各 樣 區 所 有 月 份 的 資 料 整 合 , 分 別 進 行 Shannon-Wiener index (H’)、Simpson index (D) 及Evenness index (J)等多樣性指數分析。再以 one-way ANOVA 及 Tukey’s post hoc test,比較 各植被類型的蜘蛛多樣性指數是否有差異。分 析軟體為JMP 5 (SAS Institute Inc., 2002)。
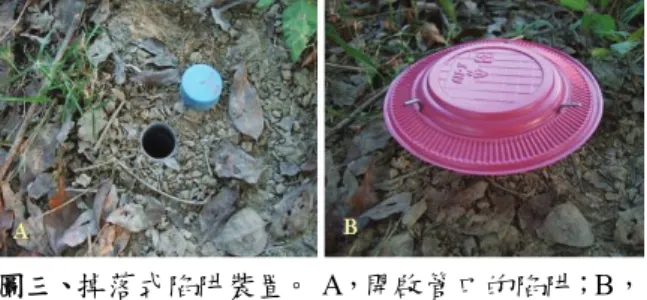
圖三、掉落式陷阱裝置。 A,開啟管口的陷阱;B, 陷阱的遮蔽裝置。
Figure 3. Device of a pitfall trap. A, a trap with open
mouth; B, shelter of the trap. 1. Shannon-Wiener index (H’) H’ = -Σpi lnpi 其中 pi為第 i 物種的個體數佔總個體數的 百分比。 2. Simpson index (D) D =Σni(ni-1) / N(N-1) 其中 ni為第 i 物種的個體數,N 為總個體 數。 3. Evenness index (J) J = H’ / lnS 其中H’為 Shannon-Wiener index,S 為物種 數。 二、各科蜘蛛數量組成之比較 亦可作為檢視不同棲地蜘蛛群落結構的 方法。以Chi-square test of homogeneity 比較各 植被類型間,以及灌叢與地表間的各科蜘蛛數 量比例是否有差異。 三、群聚分析(Cluster analysis) 首先藉由比較兩兩樣區的物種組成及數 量 以 評 估 相 似 度 , 使 用 Euclidean distance (Krebs, 1989): ΔJK = √Σ(Xij-Xik)2 其中ΔJK 為樣區 J 與樣區 K 的相似度;Xij為 物種i 在樣區 J 的數量,而 Xik為物種i 在樣區 K 的數量。
接著利用Ward’s method (Ward, 1963)將 兩兩樣區的相似度進行分群。分析軟體 為 SPSS Statistics 19 (SPSS Inc., 2010)。
結 果
能高越嶺道的蜘蛛相 綜合掃網與掉落式陷阱調查,2010 年 3 月至2011 年 3 月(2010 年 7 月及 2011 年 2 月 除外)能高越嶺道五種植被類型共紀錄蜘蛛 28 科 159 種 9155 隻,其中成蛛 2847 隻,若蛛 6308 隻。掃網捕捉 112 種 6565 隻蜘蛛,掉落 式陷阱捕捉65 種 2590 隻蜘蛛;兩種調查方法台灣中部能高越嶺道五種不同植被類型蜘蛛多樣性之比較
45
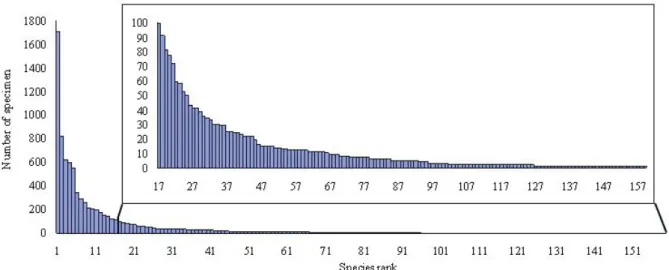
圖四、能高越嶺道樣區內159 種蜘蛛之調查數量排序柱狀圖,其中 33 種蜘蛛(序號 127~159)僅紀錄 1 隻 個體,25 種(序號 102~126)僅紀錄 2 隻個體。
Figure 4. Histogram of all 159 species of spiders ranked by the number collected in the present study. Among
them, a total of 33 species (ranked 127~159) were represented by only one individual and 25 species (ranked 102~126) were by two individuals.
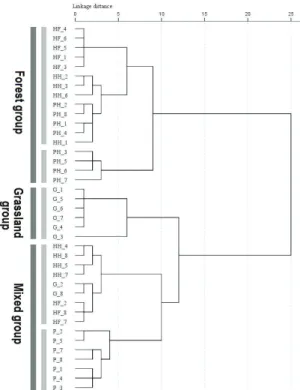
皆捕捉的物種有18 種。在蜘蛛種類方面,皿 蛛科(Linyphiidae)紀錄 37 種最多,其次為姬蛛 科(Theridiidae) 24 種和金蛛科(Araneidae) 21 種,三者佔全部物種數的51.6%;數量方面, 皿蛛科紀錄4307 隻為最多,其次為長腳蛛科 (Tetragnathidae) 1451 隻和姬蛛科 815 隻,三者 佔總數量的 71.8%。結果顯示(圖四)能高越嶺 道的蜘蛛相是由與少數的優勢種與多數的罕 見種組成。在全部159 種蜘蛛中有 33 種僅紀 錄 1 隻個體(20.8%),25 種僅紀錄 2 隻個體 (15.7%)。所有蜘蛛物種及數量在各植被類型 之分布詳見附錄一。 各植被類型蜘蛛群落結構之比較 五種植被類型樣區內調查到蜘蛛之物種 數、數量及多樣性指數如表一。松-闊葉樹混 淆林的蜘蛛物種數及數量皆為最多,而鐵杉-冷 杉 混 淆 林 的 物 種 數 及 數 量 皆 為 最 少 。 Shannon index、Simpson index 及 Evenness index 在五種植被類型間皆有顯著差異。松林、 松-闊葉樹混淆林及鐵杉-闊葉樹混淆林的 Shannon index 顯著高於草原及鐵杉-冷杉混淆 林,顯示前三者的蜘蛛多樣性較高;鐵杉-冷 杉混淆林的 Simpson index 則顯著高於松-闊 葉樹混淆林、松林及鐵杉-闊葉樹混淆林,顯 示鐵杉-冷杉混淆林有明顯的優勢種;鐵杉-闊葉樹混淆林的Evenness index 顯著高於鐵杉 -冷杉混淆林,顯示鐵杉-闊葉樹混淆林的蜘蛛 均勻度較高。草原與鐵杉-冷杉混淆林的三種 多 樣 性 指 數 都 沒 有 顯 著 差 異 , 但 草 原 的 Simpson index 顯著高於松林及鐵杉-闊葉樹混 淆林。 各科蜘蛛數量組成之比較 以χ2 檢測兩兩植被類型間各科蜘蛛數量 組成之差異,結果如表二,顯示各植被類型間 均有顯著差異(p< 0.001)。松-闊葉樹混淆林 的蜘蛛科組成與鐵杉-闊葉樹混淆林的差異最 小(同質性最高),而草原的蜘蛛科組成與松-闊葉樹混淆林的差異最大(同質性最低)。此外, 地表與灌叢的各科蜘蛛數量組成也有顯著差 異(χ2 = 3479.37, p< 0.001)。 樣區群聚分析 能高越嶺道沿線39 個蜘蛛樣區之群聚分 析結果如圖五,若以distance 10 為界可分為三 群 , 分 別 是 森 林 群(Forest group) 、 草 原 群 (Grassland group)與混合群(Mixed group)。森林
群包括5 個鐵杉-冷杉混淆林、4 個鐵杉-闊葉 樹混淆林與8 個松-闊葉樹混淆林樣區;草原 群包括6 個草原樣區;混合群包括鐵杉-闊葉 樹混淆林、鐵杉-冷杉混淆林與草原的其餘樣 區以及7 個松林樣區。
討 論
歷經近一年的調查,能高越嶺道五種植 被類型共紀錄蜘蛛28 科 159 種,在高山環境 屬於非常多樣的蜘蛛資源。不過159 種蜘蛛中 只有48 種(約 30%)能夠鑑定學名,其餘 70%表一、能高越嶺道五種植被類型樣區之蜘蛛物種數、數量、多樣性指數及 ANOVA 檢定之結果。植被類 型:G 草原,HF 鐵杉-冷杉混淆林,HH 鐵杉-闊葉樹混淆林,P 松林,PH 松-闊葉樹混淆林。
Table 1. Spider species richness, abundance and diversity indices (mean ± SD) of five types of vegetation
sampled and results of ANOVA tests for diversity indices among vegetation types in the Nengkao Cross Mountain Trail. Abbreviations for vegetation types: G, grassland; HF, mixed hemlock-fir forest; HH, mixed hemlock-hardwood forest; P, pine forest; PH, mixed pine-hardwood forest.
Vegetation types Species Abundance Shannon Index Simpson Index Evenness Index PH 87 2906 2.64 ± 0.30 0.14 ± 0.06 0.71 ± 0.06 P Note 1 79 1906 2.67 ± 0.18 0.12 ± 0.03 0.76 ± 0.05 HH 71 1954 2.63 ± 0.11 0.11 ± 0.02 0.76 ± 0.03 HF 36 1085 1.79 ± 0.32 0.31 ± 0.11 0.63 ± 0.11 G 55 1216 2.02 ± 0.39 0.24 ± 0.13 0.68 ± 0.13 Significance level Note 2
(ANOVA) *** *** *
Tukey test P a Note 3G , PH b, HF a, HH b a, HF
a, G ab, PH bc, P c, HH c HH
a, P ab, PH ab, G ab, HF b Note 1: The Plot 6 of pine forest was destroyed and its data were not included in the present study.
Note 2: *: 0.05≤ p< 0.01; **:0.01≤ p< 0.001; ***: p≤ 0.001; NS: nonsignificant
Note 3: Vegetation types with different superscripts mean having significant difference, e.g., a is significantly larger than b, b is significantly larger than c, but a is not significantly different from ab, b is not significantly different from ab or bc, and ab is not significantly different from bc.
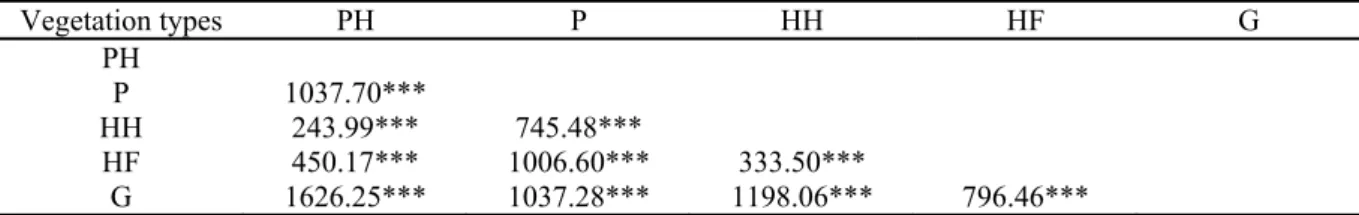
表二、能高越嶺道兩兩植被類型間各科蜘蛛數量組成之同質性。植被類型:G 草原,HF 鐵杉-冷杉混淆 林,HH 鐵杉-闊葉樹混淆林,P 松林,PH 松-闊葉樹混淆林。
Table 2. Homogeneity of spider abundance by family between each pair of vegetation types. Abbreviations for
vegetation types: G, grassland; HF, mixed hemlock-fir forest; HH, mixed hemlock-hardwood forest; P, pine forest; PH, mixed pine-hardwood forest.
Vegetation types PH P HH HF G PH P 1037.70*** HH 243.99*** 745.48*** HF 450.17*** 1006.60*** 333.50*** G 1626.25*** 1037.28*** 1198.06*** 796.46*** Chi-square tests, *: 0.05≤ p< 0.01; **:0.01≤ p< 0.001; ***: p≤ 0.001; NS: nonsignificant
的物種扣除無法鑑定的若蛛,成蛛仍有87 種 尚無法鑑定學名,他們可能是未發表的新種或 新紀錄種,又已鑑定學名者至少有10 種新紀 錄種,顯示能高越嶺道的蜘蛛新種與新紀錄種 可能非常豐富。陳(2002)研究蘭嶼的蜘蛛多樣 性,紀錄150 種蜘蛛,其中 107 種可能是新種 或新紀錄種。Hsieh et al. (2003)研究墾丁高位 珊瑚礁森林的地表蜘蛛多樣性,紀錄110 種地 表型蜘蛛,其中86 種(78.2%)為新種或新紀錄 種。以上結果顯示台灣的蜘蛛多樣性很豐富, 但蜘蛛新種或新紀錄種也很多,有待未來深入 研究、鑑定並發表。 各植被類型蜘蛛群落結構之比較 檢視各植被類型的蜘蛛群落結構,鐵杉-冷杉混淆林的最優勢種 Linyphiidae L 就佔蜘 蛛群落的 55%,其他物種都在 10%以下;草 原 的 最 優 勢 種 Pardosa laura 與 次 優 勢 種 Linyphiidae D 分別佔蜘蛛群落的 43%與 15.9%, 其他物種都在5%以下;松-闊葉樹混淆林的最 優勢種Linyphiidae L 佔蜘蛛群落的 30%,較 優勢種包括Turinyphia yunohamensis 佔 9.6%、 Okileucauge sp. A 佔 9.1%、Linyphiidae A 佔 7%、Leucauge subblanda 佔 6.5%,其他物種 都 在 5%以下 ;松 林的最 優勢種 Leucauge subblanda 佔 22.9%,較優勢種包括 Araneidae C 佔 10.1%、Turinyphia yunohamensis 佔 9.6%、 Yaginumaella striatipes 佔 7.6%、Linyphiidae N
佔7.24%,其他物種都在 5%以下;鐵杉-闊葉
樹混淆林的最優勢種 Linyphiidae L 佔蜘蛛群 落的20%,而佔 5%以上的物種包括 Leucauge subblanda (13.5%)、Linyphiidae A (12.3%)、 Diphya taiwanica (9.7%) 、 Turinyphia yunohamensis (6.6%)、Iwogumoa ensifer (5.7%) 及Neriene sp. A (5.4%)。
台灣中部能高越嶺道五種不同植被類型蜘蛛多樣性之比較 47 差異(表一)。就優勢度而言,鐵杉-冷杉混淆 林與草原的蜘蛛優勢種比例明顯較高,兩者的 Simpson index 明顯高於松-闊葉樹混淆林、松 林與鐵杉-闊葉樹混淆林。就均勻度而言,鐵 杉-闊葉樹混淆林>松林>松-闊葉樹混淆林 >草原>鐵杉-冷杉混淆林,但鐵杉-冷杉混淆 林與草原的Evenness index 變異大,故只有鐵 杉-闊葉樹混淆林的 Evenness index 顯著高於 鐵杉-冷杉混淆林。就物種歧異度而言,松-闊葉樹混淆林、松林及鐵杉-闊葉樹混淆林的 蜘蛛物種數較多且均勻度較高,因此三者的 Shannon index 明顯高於草原及鐵杉-冷杉混淆 林。 影響各植被類型蜘蛛群落的可能原因 五種植被類型的蜘蛛群落差異可能與它 們的植被結構等因子有關。鐵杉-冷杉混淆林 的灌木層主要由玉山箭竹組成,箭竹高度 2.5 m 以上,而較適合蜘蛛結網的枝葉空隙通常位 在高處,箭竹莖佔據2 m 以下大部分範圍,植 被非常單調。因此鐵杉-冷杉混淆林的結網型 蜘蛛種類與數量都不多,只有少數能在箭竹上 結網的物種形成優勢種,造成蜘蛛多樣性偏低。 草原的植被也是以玉山箭竹佔優勢。由於草原 地處風口,風勢經常較強,箭竹高度通常在1 m 以下。雖然結網型蜘蛛可藉由調整網的方位 或大小,以減少強風對網的破壞 (Hieber, 1984; Vollrath et al., 1997),但草原植被低矮,且經 常颳風下雨,對結網型蜘蛛而言可能不是理想 的結網環境,因此蜘蛛數量較少。但開闊的草 原是一些地表徘徊或結網蜘蛛物種偏好的環 境,經常形成明顯的優勢種,例如:Pardosa laura 等。其他研究也發現草原環境的蜘蛛群 落以地表徘徊或結網物種佔優勢 (Hsieh et al., 2003; Tsai et al., 2006)。整體而言,草原環境 的蜘蛛群落由少數明顯的優勢種與多數的罕 見種組成,因此蜘蛛多樣性也較低。 松-闊葉樹混淆林的灌木層植被豐富,闊 葉樹的枝條能提供蜘蛛結網的空間與附著點 (Greenstone, 1984),因此蜘蛛種類與數量都很 豐富。地表被二葉松針落葉堆覆蓋,且環境較 遮蔭,生存的蜘蛛物種與數量較少,但不乏偏 好這種環境的物種形成明顯的優勢種。整體而 言,松-闊葉樹混淆林的蜘蛛種類豐富,優勢 種的優勢度不如鐵杉-冷杉混淆林與草原來的 高,因此其蜘蛛多樣性明顯較後兩者豐富。鐵 杉-闊葉樹混淆林的環境與松-闊葉樹混淆林 相似,但其灌木層植被不如後者豐富,因此蜘 蛛種類與數量較少,但優勢度不如松-闊葉樹 混淆林的蜘蛛群落明顯,換言之均勻度較高, 故鐵杉-闊葉樹混淆林的蜘蛛多樣性較松-闊 葉樹混淆林豐富,雖然兩者的差異並不顯著。 Tsai et al. (2006)在蘭嶼的研究亦發現耕林地 (cultivated woodland)灌木層的植被密度較原 始 林 低 , 但 其 蜘 蛛 多 樣 性 , 包 括 Margalef species richness 與 Shannon-Wiener function, 顯著較原始林高。松林屬於較開闊的環境,灌 木層以五節芒佔優勢,地表亦含有二葉松針落 葉堆。在松林灌木層結網或活動的蜘蛛物種, 通常會利用五節芒的莖葉或二葉松的枝條;地 表活動蜘蛛物種以偏好開闊環境者為主,因此 有些獨特物種,例如:Araneidae C、Enielkenie acaroides 等(附錄一)。整體而言,松林的蜘蛛 群落含有多數的獨特種與罕見種,又物種數僅 次於松-闊葉樹混淆林,因此松林的蜘蛛多樣 性也很高。 群聚分析結果之探討 能高越嶺道39 個樣區依據其物種及數量 相似度可分為森林群(Forest group)、草原群 (Grassland group)和混合群(Mixed group)三群 (圖五)。 森林群 (Forest group)包括 5 個鐵杉-冷杉 混淆林、4 個鐵杉-闊葉樹混淆林與 8 個松-闊 葉樹混淆林樣區。這些樣區的共通性為具有明 顯的樹冠層、環境較遮蔭,其蜘蛛群落以皿蛛 科的 Linyphiidae L 最優勢(45~155 隻)。但森 林群又可分為二亞群(圖五):5 個鐵杉-冷杉混 淆林、4 個鐵杉-闊葉樹混淆林與 4 個松-闊葉 樹混淆林樣區形成一個亞群,另 4 個松-闊葉 樹混淆林樣區則形成另一個亞群。這兩個亞群 的主要差異是後者的4 個松-闊葉樹混淆林樣 區的灌木層植被密度較前者更高,皿蛛科、長 腳蛛科與姬蛛科等結網型蜘蛛的數量更多,且 最優勢種Linyphiidae L (119~155 隻)和次優勢 種Okileucauge sp. A (27~81 隻)的數量明顯較 多,因此可區分這兩個亞群。Borges and Brown (2001)發現在植被結構較複雜的牧場,單位面 積的結網型蜘蛛數量較多。Corcuera et al. (2008)發現葉片及枝條較多的樹種,能支持較 多個體的植被活動蜘蛛。而後者的4 個松-闊 葉樹混淆林樣區所形成的亞群聚有更豐富的 植被,似乎能提供更多結網型蜘蛛個體的棲息, 呼應前人的研究結果。 草原群(Grassland group)包括 6 個草原樣 區。草原屬於開闊的環境,地表被箭竹枯葉落
圖五、以Ward 法連結之樣區群聚分析樹狀圖,顯 示能高越嶺道上之39 個樣區可分為森林群、草原 群和混合群三群。植被類型:G 草原,HF 鐵杉-冷杉混淆林,HH 鐵杉-闊葉樹混淆林,P 松林, PH 松-闊葉樹混淆林。
Figure 5. Dendrogram of cluster analysis using
Ward’s method estimated from 39 sampling plots in the Nengkao Cross Mountain Trail shown three main clusters, the forest group, the grassland group and the mixed group. Abbreviations for the vegetation type of each sampling plot: G, grassland; HF, mixed hemlock-fir forest; HH, mixed hemlock-hardwood forest; P, pine forest; PH, mixed pine-hardwood forest. 葉堆覆蓋。這6 個樣區的蜘蛛群落以地表徘徊 的 Pardosa laura 最為優勢(43~165 隻),地表 結網的Linyphiidae D 次優勢(13~34 隻);其他 結網型蜘蛛的數量則較少(附錄一)。草原中密 生的箭竹與底層的落葉堆可能提供地表活動 蜘蛛棲息和避難的場所,有利於地表活動的蜘 蛛,而低矮的植被和劇烈的天氣變化,可能不 利於蜘蛛結網,因此草原群樣區中地表活動的 蜘蛛數量較多,結網型蜘蛛的數量明顯較少。 混合群(Mixed group)包括 4 個鐵杉-闊葉 樹混淆林、3 個鐵杉-冷杉混淆林、2 個草原與 7 個松林樣區。混合群樣區的環境沒有明顯的 共 通 性 。 相 較 於 森 林 群 , 混 合 群 樣 區 的 Linyphiidae L 較少(0~53 隻),但各樣區的優勢 種並不一致。混合群又可分為二亞群(圖五): 鐵杉-闊葉樹混淆林、鐵杉-冷杉混淆林與部分 草原樣區形成一個亞群,而7 個松林樣區形成 另一亞群。相較於其他三種植被類型,七個松 林 樣 區 的 蜘 蛛 群 落 有 較 多 的 Leucauge subblanda (15~103 隻)、Linyphiidae N (0~63 隻)、Araneidae C (0~48 隻)、Yaginumaella striatipes (9~27 隻)與 Neriene radiata (0~20 隻), 但幾乎無 Linyphiidae L 的分布,因此它們形 成獨立的一個亞群。松林灌木層的五節芒,其 莖葉間或葉片上均能適合上述物種結網或活 動(Linyphiidae L 除外),因此具有較多的數量。 至於另一亞群,四個鐵杉-闊葉樹混淆林樣區 的灌木層植被較稀疏,結網型蜘蛛數量較森林 群 的 樣 區 為 少 , 蜘 蛛 群 落 以 地 表 結 網 的 Linyphiidae A (27~36 隻)與在植被上結網的 Linyphiidae L (11~37 隻)較為優勢。三個鐵杉-冷杉混淆林樣區的蜘蛛群落以 Linyphiidae L 為主(23~53 隻),但明顯少於另 5 個鐵杉-冷杉 混淆林樣區的 75~110 隻,因此兩者可區分。 而在兩個草原樣區方面,草原樣區2 的植被高 約2 m,環境較遮蔭,蜘蛛群落以 Linyphiidae D 較優勢(23 隻);草原樣區 8 則風勢最強,蜘 蛛群落以Linyphiidae A 及 Linyphiidae N 較優 勢,皆為17 隻;但這兩個樣區的 Pardosa laura 都很少,因此可與草原群中的其他草原樣區區 分。上述的三種植被類型9 個樣區的環境與蜘 蛛群落都不甚相似,但被分在同一亞群,可能 是因為這些樣區的蜘蛛群落都可與其他群或 亞群區分,而它們分在同一亞群可使整體的 Error sum of square 最小 (Ward, 1963)。
結 論
能高越嶺道五種植被類型的蜘蛛多樣性 有顯著差異。各植被類型蜘蛛群落結構的差異 似乎可反映彼此間植被結構與覆蓋度的差異。 利用兩兩樣區間之 Euclidean distance 進行的 群聚分析顯示,能高越嶺道所有調查樣區可分 為三群,分別是森林群、草原群與混合群。屬 於同一群的樣區通常有相似的環境與蜘蛛物 種組成。本研究結果也顯示森林與草原的蜘蛛 群落差異很大,而松林則是較特殊的一群,持 續調查蜘蛛群落的變化,可了解植被結構細部 的變遷,將可作為政府單位將來規劃執行能高 越嶺道環境監測時之參考。誌 謝
我們感謝國立台北教育大學陳順其博士台灣中部能高越嶺道五種不同植被類型蜘蛛多樣性之比較 49 和本系王穎博士提供許多寶貴的意見,使本文 能更趨完整與嚴謹。感謝鍾珞璿和林雅惠小姐 與劉錫軒、廖家宏、郭明哲和江政輝先生在野 外工作上提供許多協助;黃文俊先生協助蜘蛛 標本鑑定。感謝林務局李正一先生夫人、李清 雄先生及烏幹先生對第一作者在山上研究期 間的照顧,以及台灣電力公司雲海保線所提供 住宿,方便野外研究工作。第一作者特別感謝 雙親在研究期間經濟上的支持和野外工作的 協助。本研究經費部分來自王穎博士主持的林 務局計畫「能高越嶺道生態環境及遊憩行為監 測計畫」,特別感謝。
參考文獻
Balfour RA and Rypstra AL. 1998. The influence of habitat structure on spider density in a no-till soybean agroecosystem. J. Arachnol. 26: 221-226.
Borges PAV and Brown VK. 2001. Phytophagous insects and web-building spiders in relation to pasture vegetation complexity. Ecography 24: 68-82.
Chen KC. 2002. Spider diversity on Orchid Island, Taiwan: a comparison between habitats receiving different aboriginal activities. Master Thesis, Tunghai University. (In Chinese.)
Chen KC and Tso IM. 2004. Spider diversity on Orchid Island, Taiwan: a comparison between habitats receiving different degrees of human disturbance. Zool. Stud. 43: 598-611.
Chen SH. 2001. A Guide to Common Spiders of Taiwan. Council of Agriculture, Executive Yuan, Taipei City. 318 pp. (In Chinese.) Chikuni Y. 1989. Pictorial Encyclopedia of
Spiders in Japan. Kaisei-Sha Publishing Co., Tokyo. 310 pp.
Churchill TB. 1998. Spiders as ecological indicators in the Australian tropics: family distribution patterns along rainfall and grazing gradients. In: Selden PA (ed.), Proceedings of the 17th European
Colloquium of Arachnology, Edinburgh 1997, pp: 325-330. British Arachnological Society.
Corcuera P, Jiménez ML and Valverde PL. 2008. Does the microarchitecture of Mexican dry forest foliage influence spider distribution? J. Arachnol. 36: 552-556.
Downie IS, Wilson WL, Abernethy VJ,
McCracken DI, Foster GN, Ribera I, Murphy KJ and Waterhouse A. 1999. The impact of different agricultural land-uses on epigeal spider diversity in Scotland. J. Insect Conserv. 3: 273-286.
Draney ML. 1997. Ground layer spiders (Araneae) of a Georgia piedmont floodplain agroecosystem: species list, phenology and habitat selection. J. Arachnol. 25: 333-351. Drapela T, Moser D, Zaller JG and Frank T.
2008. Spider assemblages in winter oilseed rape affected by landscape and site factors. Ecography 31: 254-262.
Foelix RF. 1996. Biology of Spiders, 2nd edition.
Oxford University Press, New York. 330 pp.
Greenstone MH. 1984. Determinants of web spider species diversity: vegetation structural diversity vs. prey availability. Oecologia 62: 299-304.
Halaj J, Ross DW and Moldenke AR. 2000. Importance of habitat structure to the arthropod food-web in Douglas-fir canopies. OIKOS 90: 139-152.
Hieber CS. 1984. Orb-web orientation and modification by the spiders Araneus diadematus and Araneus gemmoides (Araneae: Araneidae) in response to wind and light. Zeitschrift Für Tierpsychologie 65: 250-260.
Hsieh YL, Lin YS and Tso IM. 2003. Ground spider diversity in the Kenting uplifted coral reef forest, Taiwan: a comparison between habitats receiving various disturbances. Biodivers. Conserv. 12: 2173-2194.
Jiménez-Valverde A and Lobo JM. 2006. Establishing reliable spider (Araneae, Araneidae and Thomisidae) assemblage sampling protocols: estimation of species richness, seasonal coverage and contribution of juvenile data to species richness and composition. Acta Oecol. 30: 21-32.
Jiménez-Valverde A and Lobo JM. 2007. Determinants of local spider (Araneidae and Thomisidae) species richness on a regional scale: climate and altitude vs. habitat structure. Ecol. Entomol. 32: 113-122.
Krebs CJ. 1989. Ecological Methodology. Harper and Row Publishers, New York. 654 pp.
Laeser SR, Baxter CV and Fausch KD. 2005. Riparian vegetation loss, stream channelization, and web-weaving spiders in northern Japan. Ecol. Res. 20: 646-651. Langlands PR, Brennan KEC and Pearson DJ.
2006. Spiders, spinifex, rainfall and fire: Long-term changes in an arid spider assemblage. J. Arid Environ. 67: 36-59. Maelfait JP and Hendrickx F. 1998. Spiders as
bio-indicators of anthropogenic stress in natural and semi-natural habitats in Flanders (Belgium): some recent developments. In: Selden PA (ed.), Proceedings of the 17th European
Colloquium of Arachnology, Edinburgh 1997, pp: 293-300. British Arachnological Society.
Marc P, Canard A and Ysnel F. 1999. Spiders (Araneae) useful for pest limitation and bioindication. Agr. Ecosyst. Environ. 74: 229-273.
Muff P, Kropf C, Frick H, Nentwig W and Schmidt-Entling MH. 2009. Co-existence of divergent communities at natural boundaries: spider (Arachnida: Araneae) diversity across an alpine timberline. Insect Conserv. Diver. 2: 36-44.
Negro M, Isaia M, Palestrini C, Schoenhofer A and Rolando A. 2010. The impact of high-altitude ski pistes on ground-dwelling arthropods in the Alps. Biodivers. Conserv. 19: 1853-1870.
Nyffeler M and Sunderland KD. 2003. Composition, abundance and pest control potential of spider communities in agroecosystems: a comparison of European and US studies. Agr. Ecosyst. Environ. 95: 579–612.
Öberg S, Ekbom B and Bommarco R. 2007. Influence of habitat type and surrounding landscape on spider diversity in Swedish agroecosystems. Agr. Ecosyst. Environ. 122: 211-219.
Petillon J, Canard A and Ysnel F. 2006. Spiders as indicators of microbabitat changes after a grass invasion in salt-marshes: synthetic results from a case study in the Mont-Saint-Michel Bay. Cah. Biol. Mar. 47: 11-18.
Platnick NI. 2012. The World Spider Catalog, Version 12.5. American Museum of Natural History.(http://research.amnh.org/iz/spiders / catalog/)
SAS Institute Inc. 2002. JMP 5 for Windows. SAS Institute Inc., Cary, North Carolina. Schmidt MH, Roschewitz I, Thies C and
Tscharntke T. 2005. Differential effects of landscape and management on diversity and density of ground-dwelling farmland spiders. J. Appl. Ecol. 42: 281-287.
Shinkai E. 2006. Spiders of Japan. Bun-ichi Sogo Shuppan Co. Ltd., Tokyo. 336 pp. Song DX, Zhu MS and Chen J. 1999. The
Spiders of China. Hebei Science and Technology Publishing House, Shijiazhuang. 640 pp.
SPSS Inc. 2010. IBM SPSS Statistics 19 for Windows. SPSS Inc., Chicago, Illinois. Tsai ZI, Huang PS and Tso IM. 2006. Habitat
management by aboriginals promotes high spider diversity on an Asian tropical island. Ecography 29: 84-94.
Vollrath F, Downes M and Krackow S. 1997. Design variability in web geometry of an orb-weaving spider. Physiol. Behav. 62: 735-743.
Warui CM, Villet MH, Young TP and Jocqué R. 2005. Influence of grazing by large mammals on the spider community of a Kenyan savanna biome. J. Arachnol. 33: 269-279.
Ward JH, Jr. 1963. Hierarchical grouping to optimize an objective function. J. Am. Stat. Assoc. 58: 236-244.
Wang Y, Wang CC, Chen SH, Hsu YF, Wang CP and Lin SH. 2008. A Monitoring on Ecological Environmental Resources and Recreation Behavior in the Nengkao Cross Mountain Trail. Entrusted Research of Forestry Bureau, Council of Agriculture, Executive Yuan. (In Chinese.)
Wise DH. 1993. Spiders in Ecological Webs. Cambridge University Press, Cambridge. xii+328 pp.
Ziesche TM and Roth M. 2008. Influence of environmental parameters on small-scale distribution of soil-dwelling spiders in forests: What makes the difference, tree species or microhabitat? Forest Ecol. Manag. 255: 738-752.
台灣中部能高越嶺道五種不同植被類型蜘蛛多樣性之比較
51
附錄一、能高越嶺道各植被類型蜘蛛物種名錄與數量(成蛛/若蛛)。植被類型:G 草原,HF 鐵杉-冷杉混 淆林,HH 鐵杉-闊葉樹混淆林,P 松林,PH 松-闊葉樹混淆林。Juvenile 為未能鑑定至種或形態種的若 蛛。
Appendix I. Spider taxa and their abundance (adults/juveniles) investigated in the sampling plots of each
vegetation type along the Nengkao Cross Mountain Trail. Abbreviations for vegetation types: G, grassland; HF, mixed hemlock-fir forest; HH, mixed hemlock-hardwood forest; P, pine forest; PH, mixed pine-hardwood forest. The ‘Juvenile’ indicates any immature spider that cannot be accurately identified to any species or morphospecies.
vegetation types
Taxa PH P HH HF G Total Amaurobiidae Coelotes sp. A 0/0 0/0 18/5 1/0 4/2 30 Coelotes sp. B 0/0 0/0 0/0 2/0 0/0 2 Iwogumoa ensifer 30/9 61/2 76/23 35/12 41/4 293 Pireneitega sp. A 4/0 11/0 0/0 0/0 0/0 15 Juvenile Note 2 6 6 4 5 23 Anapidae Anapidae A 0/0 0/0 0/1 1/3 0/0 5 Enielkenie acaroides 0/0 12/0 0/0 0/0 0/0 12 Anyphaenidae Anyphaena wuyi 1/3 1/0 0/0 0/0 0/0 5 Juvenile 2 0 0 0 0 2 Araneidae Araneidae A 0/2 0/18 0/11 0/0 0/2 33 Araneidae B 0/0 1/0 0/0 0/0 0/1 2 Araneidae C 0/0 27/150 0/0 0/0 0/0 177 Araneidae D 0/5 0/52 0/0 0/1 0/33 91 Araneidae E 0/0 1/0 0/0 0/0 0/0 1 Araneidae F 0/0 0/0 0/1 0/0 0/0 1 Araneidae G 0/0 0/0 0/0 0/1 0/1 2 Araneidae H 0/0 0/0 0/0 0/0 1/0 1 Araneidae I 0/0 0/0 0/1 0/0 0/0 1 Araneus ejusmodi 0/2 0/39 0/0 0/0 0/0 41 Araneus pentagrammicus 0/2 0/0 0/0 0/0 0/0 2 Araneus viperifer 0/2 0/1 0/0 0/0 0/0 3 Araniella sp. A 0/0 0/0 0/0 0/0 0/1 1 Cyclosa argenteoalba 0/0 1/0 0/0 0/0 0/0 1 Cyclosa ginnaga 0/6 0/1 1/6 0/0 0/0 14 Cyclosa shinoharai 3/6 0/0 0/0 0/0 0/0 9 Cyclosa sp. A 2/0 0/0 4/0 0/0 0/0 6 Eriophora sp. A 0/10 0/0 0/7 0/5 0/0 22 Lariniaria sp. A 0/0 0/7 0/0 0/0 0/0 7 Neoscona sp. A 1/1 0/0 1/0 0/0 0/0 3 Pronoides sp. A 1/21 0/13 1/8 0/1 1/12 58 Juvenile 17 39 32 3 13 104 Clubionidae Anaclubiona tanikawai 1/0 0/0 3/0 0/0 0/0 4 Clubiona asrevida 0/0 2/0 0/0 0/0 0/0 2 Clubiona insulana 0/0 0/0 0/0 0/0 1/0 1 Clubiona kurosawai 0/0 1/0 1/0 0/0 0/0 2 Clubiona taiwanica 3/0 0/0 0/0 1/0 2/0 6 Clubiona yangmingensis 0/0 2/0 0/0 0/0 0/0 2 Juvenile 30 42 3 8 7 90 Corinnidae Otacilia sp. A 3/3 2/3 1/0 0/0 0/0 12 Otacilia taiwanica 8/2 2/2 7/9 7/4 10/1 52 Utivarachna taiwanica 0/5 0/0 0/0 0/0 0/0 5 Juvenile 1 1 1 0 1 4Ctenizidae Latouchia formosensis 1/0 0/0 0/0 0/0 0/0 1 Cybaeidae Cybaeus sp. A 1/1 0/0 0/0 0/0 0/0 2 Dictynidae Cicurina sp. A 7/0 1/0 11/0 0/0 3/0 22 Dictyna sp. A 2/2 0/0 2/0 0/0 0/0 6 Dictynidae A 0/0 0/0 1/0 0/0 0/0 1 Dictynidae B 0/0 0/0 0/0 0/0 1/0 1 Dictynidae C 0/0 0/0 0/0 3/0 0/0 3 Juvenile 0 0 0 1 0 1 Gnaphosidae Gnaphosa kompirensis 0/0 0/2 0/0 0/0 0/0 2 Gnaphosidae A 0/0 0/0 0/0 0/0 1/0 1 Zelotes asiaticus 0/0 15/5 0/0 0/0 2/0 22 Zelotes nishikawai 0/0 2/0 0/0 0/0 0/0 2 Zelotes sp. A 1/0 0/0 0/0 0/0 0/0 1 Juvenile 0 2 0 0 0 2 Hahniidae Hahnia corticicola 0/0 2/0 0/0 0/0 0/0 2 Hahnia sp. A 2/0 3/0 1/0 0/0 9/0 15 Hahnia sp. B 0/0 0/0 0/0 2/0 33/0 35 Hahniidae A 0/0 1/0 0/0 0/0 0/0 1 Juvenile 0 0 0 1 1 2 Hexathelidae Macrothele sp. A 0/2 0/0 0/0 0/0 0/0 2 Leptonetidae Leptoneta sp. A 3/0 0/0 0/0 24/3 0/0 30 Leptoneta sp. B 0/0 2/0 0/0 0/0 0/0 2 Juvenile 1 1 0 1 0 3 Linyphiidae Erigone prominens 0/0 1/0 0/0 0/0 0/0 1 Himalaphantes azumiensis 0/18 0/2 4/7 2/27 5/16 81 Lepthyphantes sp. A 5/29 0/1 0/3 0/1 0/2 41 Linyphiidae A 192/0 36/0 212/0 95/0 80/2 617 Linyphiidae B 15/1 0/0 8/0 0/0 0/0 24 Linyphiidae C 2/0 0/0 10/0 0/0 1/0 13 Linyphiidae D 8/0 39/0 14/1 29/0 167/1 259 Linyphiidae E 0/0 2/0 0/0 0/0 0/0 2 Linyphiidae F 0/0 4/0 0/0 0/0 0/0 4 Linyphiidae G 1/0 0/0 1/0 0/0 0/0 2 Linyphiidae H 0/0 0/0 1/0 0/0 0/0 1 Linyphiidae I 0/0 0/0 5/0 2/0 0/0 7 Linyphiidae J 0/0 0/0 0/0 1/0 0/0 1 Linyphiidae K 0/0 0/0 1/1 0/0 2/3 7 Linyphiidae L 138/677 0/1 54/290 61/489 0/2 1712 Linyphiidae M 5/0 0/0 0/0 0/0 0/0 5 Linyphiidae N 0/0 65/71 0/3 5/8 23/28 203 Linyphiidae O 0/0 0/0 3/19 0/0 0/3 25 Linyphiidae P 0/0 0/0 1/2 1/5 2/1 12 Linyphiidae Q 2/0 1/0 0/0 0/0 0/0 3 Linyphiidae R 6/0 1/0 2/0 0/0 0/0 9 Linyphiidae S 0/0 0/0 4/0 3/0 0/0 7 Linyphiidae T 0/0 0/0 1/0 0/0 0/1 2 Linyphiidae U 0/0 1/0 0/0 1/0 0/0 2 Linyphiidae V 0/0 0/0 2/5 0/0 0/0 7 Linyphiidae W 8/0 0/0 0/0 0/0 0/0 8 Linyphiidae X 0/0 0/0 1/0 0/0 0/0 1 Linyphiidae Y 0/0 0/0 1/0 0/0 0/0 1 Linyphiidae Z 0/0 1/0 0/0 0/0 0/0 1
台灣中部能高越嶺道五種不同植被類型蜘蛛多樣性之比較 53 Linyphiidae AA 0/0 0/0 1/0 0/0 0/0 1 Linyphiidae AB 0/0 0/0 0/0 1/0 0/0 1 Linyphiidae AC 0/0 0/0 0/0 0/0 0/8 8 Linyphiidae AD 0/0 1/0 0/0 0/0 0/0 1 Linyphiidae AE 0/0 2/0 4/0 0/0 0/0 6 Neriene radiata 0/0 19/40 0/0 0/0 0/0 59 Neriene sp. A 14/50 0/0 26/67 0/0 0/0 157 Turinyphia yunohamensis 35/228 7/159 17/96 7/53 0/1 603 Juvenile 76 37 136 51 113 413 Lycosidae Pardosa laura 1/0 70/29 0/0 0/0 368/86 554 Pirata clercki 0/0 0/0 0/0 0/0 1/0 1 Mimetidae Ero sp. A 1/0 1/0 0/0 0/0 0/0 2 Mysmenidae Mysmenidae A 2/9 3/15 0/0 0/0 0/0 29 Mysmenidae B 0/0 4/11 0/0 0/0 0/0 15 Mysmenidae C 0/0 0/1 0/0 0/0 0/0 1 Nesticidae Nesticidae A 0/0 0/0 1/0 1/0 0/0 2 Nesticidae B 1/0 0/1 0/0 0/0 0/0 2 Oonopidae Ischnothyreus sp. A 2/0 18/0 7/1 0/0 1/0 29 Oonopidae A 0/1 1/1 5/0 0/0 0/0 8 Oonopidae B 0/0 1/0 0/0 0/0 0/0 1 Juvenile 0 2 2 4 2 10 Philodromidae Philodromus sp. A 0/0 0/5 0/0 0/0 0/0 5 Pholcidae Pholcidae A 1/1 0/0 0/0 0/0 0/0 2 Salticidae Euophrys kataokai 0/0 1/0 0/0 0/0 0/0 1 Myrmarachne sp. A 0/0 3/19 0/0 0/0 1/1 24 Salticidae A 0/0 0/0 0/0 0/0 3/9 12 Salticidae B 2/0 1/0 0/0 0/0 0/0 3 Yaginumaella sp. A 10/1 0/0 0/0 0/0 0/0 11 Yaginumaella striatipes 6/13 22/117 8/18 1/0 8/14 207 Juvenile 27 24 0 1 0 52 Sparassidae Pseudopoda sp. A 0/6 0/0 0/0 0/0 0/0 6 Tetragnathidae Diphya taiwanica 3/40 1/3 44/124 0/1 0/0 216 Leucauge sp. A 0/6 0/3 0/0 0/0 0/0 9 Leucauge subblanda 2/176 3/393 1/232 0/11 0/1 819 Menosira ornata 2/14 0/0 0/0 0/0 0/0 16 Mesida gemmea 1/0 0/0 0/0 0/0 0/0 1 Meta sp. A 0/0 0/0 0/1 0/10 0/0 11 Metleucauge davidi 0/0 0/0 0/2 0/8 0/1 11 Okileucauge sp. A 40/207 2/2 7/41 0/41 0/1 341 Tetragnatha sp. A 1/3 0/2 0/4 0/0 0/0 10 Tetragnatha sp. B 4/1 0/1 0/0 0/0 0/0 6 Juvenile 4 4 2 0 1 11 Theridiidae Chrysso nigra 0/2 0/0 0/1 0/0 0/0 3 Chrysso viridiventris 1/21 0/0 0/0 0/0 0/1 23 Episinus punctisparsus 6/0 2/0 2/0 0/0 1/0 11 Episinus yoshidai 2/16 0/0 5/16 0/0 0/0 39 Moneta spinigera 9/66 0/0 15/9 0/0 0/0 99 Phoroncidia alishanensis 1/1 0/0 3/2 0/0 0/0 7 Phoroncidia ryukyuensis 10/2 0/0 0/0 0/0 0/0 12
Phycosoma japonicum 10/5 0/0 0/0 0/0 0/0 15 Phycosoma mustelinum 2/28 4/15 1/0 3/17 0/2 72 Rhomphaea sp. A 0/1 0/0 0/0 0/0 0/0 1 Takayus sp. A 0/2 7/35 0/4 0/0 1/1 50 Theridiidae A 2/117 1/7 1/16 0/0 0/0 144 Theridiidae B 3/24 0/1 1/13 0/0 0/1 43 Theridiidae C 0/68 0/8 0/26 0/3 0/3 108 Theridiidae D 0/0 1/24 0/0 0/0 0/0 25 Theridiidae E 8/3 0/0 0/0 0/0 1/0 12 Theridiidae F 2/5 0/0 0/5 0/0 0/1 13 Theridiidae G 0/4 0/0 0/4 0/5 0/6 19 Theridiidae H 0/1 3/0 0/0 0/0 0/0 4 Theridiidae I 0/0 0/0 1/0 0/0 0/0 1 Theridiidae J 0/0 0/0 0/0 0/0 2/0 2 Theridiidae K 1/0 0/0 0/0 0/0 0/0 1 Theridiidae L 1/0 0/0 0/0 0/0 0/0 1 Theridiidae M 0/0 0/4 0/1 0/0 0/0 5 Juvenile 15 25 45 12 8 105 Thomisidae Diaea subdola 0/29 1/26 0/13 0/0 0/8 77 Ebelingia sp. A 0/0 0/0 0/1 0/0 0/1 2 Lysiteles silvanus 20/85 0/3 2/10 0/0 0/0 120 Lysiteles sp. A 2/0 0/0 0/0 0/0 0/0 2 Thomisidae A 0/0 0/0 0/0 0/0 0/1 1 Thomisidae B 0/0 0/0 0/0 0/0 0/2 2 Xysticus chui 0/1 4/13 0/0 0/0 11/5 34 Juvenile 3 8 3 1 8 23 Uloboridae Hyptiotes affinis 1/4 0/0 1/8 0/0 0/0 14 Miagrammopes sp. A 0/5 0/0 0/0 0/0 0/0 5 Octonoba sp. A 0/0 0/1 0/0 0/0 0/0 1 Zodariidae Mallinella sp. A 8/0 3/0 0/0 0/0 0/0 11 Mallinella sp. B 0/0 5/0 0/0 0/0 0/0 5 Juvenile 0 1 0 0 0 1 Unidentified Family Juvenile 0 1 0 0 0 1 TOTAL adult 673 492 606 289 787 2847 TOTAL juvenile 2233 1502 1348 796 429 6308 TOTAL 2906 1994 1954 1085 1216 9155
BioFormosa(2011)46(1): 41-55
*Corresponding author: Shyh-Hwang Chen; FAX: 886-2-29312904; E-mail: [email protected]
A Comparison on the Spider Diversity among Five Different Types of
Vegetation along the Nengkao Cross Mountain Trail, Central Taiwan
Tien-Yen Yang, Shyh-Hwang Chen*
Department of Life Science, National Taiwan Normal University Taipei, Taiwan
(Received: 15 March 2012, accepted: 8 August 2012)
ABSTRACT
The Nengkao Cross Mountain Trail (NCMT) is a part of the high mountain hiking trail system of Taiwan that connects Hualien and Nantou Counties by crossing the Central Mountain Range at elevation ranged about 1600-2900 m above the sea level. The environment along the NCMT includes many sorts of vegetation types that provide a chance for us to study the spider biodiversity among different types of vegetation.
We chose five different vegetation types along the NCMT for sampling, including the mixed pine-hardwood forest (PH), pine forest (P), mixed hemlock-hardwood forest (HH), mixed hemlock-fir forest (HF), and grassland (G). Eight 5×5 m sampling plots in each vegetation type were settled, and both the pitfall trap and sweeping net methods were used for sampling spiders from March 2010 to March 2011 (except for July 2010 and February 2011) once per month. A total of 9155 spiders belonging to159 species in 28 families were caught, including 2847 adults and 6308 juveniles. Among them, 6565 spiders belonging to 112 species were captured by sweeping, and 2590 spiders belonging to 65 species were captured by pitfall traps. The structure of spider communities was significantly different among vegetation types. The Shannon index of P, PH and HH are significantly higher than those of G and HF. Contrarily, the Simpson index of HF is significantly higher than those of PH, P and HH. The Evenness index of HH is significantly higher than that of HF. The result of cluster analysis by using the pair-wised Euclidean distance shows that all the sampling plots can be divided into three main clusters, i.e., the forest, grassland and mixed groups. Plots of the same cluster always share a similar environment and the spider composition. Results of the present study can be used for further environmental monitoring in the higher mountains of Taiwan.