In the last 20 years, health care providers and re-searchers have agreed that treatment intervention should be evaluated in part by its impact on health-related quality of life (QOL). Although people have been measuring QOL for many years, there is as yet little agreement on a definition.1,2There is a need to conduct global studies on a wide range of dis-ease groups in a wide range of cultures. Towards this end, the World Health Organization (WHO) has been developing a universal measure of QOL called the WHOQOL Questionnaire,3,4which can be accepted and applied cross-culturally.
The WHO began developing this questionnaire for generic use in 1991 and finished field tests in 1995. The WHOQOL questionnaire contains 24 facets organized into six broad domains: physical, psychological, level of independence, social rela-tionships, environment, and spirituality/religion/ personal beliefs. Each facet contains four items. Four additional items measure “overall QOL and general health” (forming Facet-G). The final
version of the questionnaire (called the WHOQOL-100) contains 100 culturally comparable items. However, each culture may add culture-specific questions, called national items, so that the ques-tionnaire can also reflect cultural attributes.
The purpose of this report is to document adaptation of the WHOQOL questionnaire for Taiwan. Specifically, the procedure for national item selection is presented.
Methods
Questionnaire translation
To adapt the WHOQOL questionnaire to Taiwan, the WHOQOL-Taiwan group composed of diverse backgrounds followed WHO recommendations for translation procedures of health status instru-ments.5,6The Taiwan version is expected to be con-ceptually, semantically and technically equivalent to the standard form.7
Cultural Adaptation of the WHOQOL
Questionnaire for Taiwan
Grace Yao,1* Jung-Der Wang,2,3Chih-Wen Chung2
This brief report describes cultural adaptation of the WHOQOL-100 questionnaire for Taiwan. The standard cultural adaptation procedure was used for questionnaire translation, response scale generation, and national items design. A field test was conducted on 1068 participants randomly selected from 17 hospitals all over Taiwan. Several psychometric criteria were used for selecting 12 out of the 20 national items previously proposed from three focus groups. In terms of reliability and validity, the psychometric properties of the culturally adapted WHOQOL questionnaire are good and the values are comparable with those in studies conducted in 15 countries. [J Formos Med Assoc 2007;106(7):592–597]
Key Words: cultural adaptation, Taiwan, WHOQOL
©2007 Elsevier & Formosan Medical Association . . . .
1Department of Psychology, College of Science, and 2Institute of Occupational Medicine and Industrial Hygiene, College of Public Health,
National Taiwan University, and 3Department of Internal Medicine, National Taiwan University Hospital, Taipei, Taiwan.
Received: April 24, 2006 Revised: December 28, 2006 Accepted: February 6, 2007
*Correspondence to: Dr Grace Yao, Department of Psychology, National Taiwan University, No. 1, Section 4, Roosevelt Road, Taipei 106, Taiwan.
Response scale generation
The items in the standard questionnaire use four types of 5-point Likert response scales (i.e. capacity, frequency, intensity, and evaluation). According to WHOQOL studies, the anchor points should be universally applicable, but the three categories between the anchor points may need to be ad-justed according to the culture.8To obtain cultur-ally appropriate equal-interval scale descriptors, we followed WHOQOL procedures3,5,8 to conduct a study on 156 participants who were randomly selected from 10 hospitals in Taiwan. As a result, three intermediate descriptors for each scale type were selected.9
Design of national items
According to the documents of the WHOQOL,6,10 three focus groups consisting of health profession-als, patients with a variety of diseases and health conditions, and patients’ caregivers met to discuss whether the ordinary six domains/24 facets/100 items were sufficient to describe their personal views with respect to QOL. Appropriate domains/ facets/items were proposed to compensate for in-sufficient areas, resulting in 20 proposed national items (available upon request). Of the 20 items, 11 were classified into two new facets: being re-spected/accepted (guanxi/mianzi) and eating/food. We hypothesized that the two new facets should be classified into the social relationships and envi-ronmental domains, respectively. The other nine were related to dependence on alternative medi-cine (mostly traditional Chinese medimedi-cine) and national health insurance (Taiwan’s nationally subsidized health care program), personal for-tune, fulfillment of personal goals, support from a significant other, and maintaining a good rela-tionship with relatives. These nine items were clas-sified into existing facets and domains. Standard scoring system was applied. A higher score indi-cates a better QOL.
Criteria for selection of national items
According to the WHOQOL Group,5the psycho-metric properties of new items should be compa-rable to the global data and to data collected in the
host country. That is, the psychometric properties of new items should be at least as good as existing items in the same domain and facet. We conducted several analyses to select appropriate national items from the proposed 20. The quantitative method and selection criteria were as follows:
a. Items with means between 2 and 4 were se-lected. Items with larger variance have better discriminative power.
b. A high exploratory factor analysis (EFA) factor loading on the proposed facet or domain indi-cates the item is classified correctly. An EFA was conducted on the items in each new facet and the existing items in the same domain to test whether the newly proposed facets could be extracted. An EFA was also conducted on the 24 ordinary facet scores plus the two new facet scores to see which domains and factors the two new facets belonged to.
c. High correlation coefficients between items and their hypothesized domains/facets indicate that the items are classified correctly.
d. Higher correlation coefficients between the items and the Facet-G score, the individual items in Facet-G, and the Total-QOL score indi-cates that the items make a larger contribution to predicting general QOL.
e. Stepwise regression analysis was conducted to predict the Total-QOL score from items in the same facet. Better items should be included in the regression equation with larger standard-ized regression coefficients (beta) and higher predictive power (larger % of total variance explained).
f. If the Cronbach’s alpha of a facet decreases significantly after deleting an item from the facet, then the item is important and should not be deleted.
g. Independent t tests were conducted on the items to test for ability to distinguish healthy from unhealthy participants.
h. Cluster analysis (CA) was used to investigate the similarity among items. Items with greater similarity are more likely to be clustered to-gether. A good new item should not be hier-archically clustered too early with the original
four items in the same facet, which would in-dicate too much overlap.11However, the item should also not be clustered too late, which would indicate that the item is very different from those in the same facet. In this study, we conducted CA using average linkage. Both dendrogram and horizontal icicle plots of the items in the same facet were examined.
i. Multidimensional scaling (MDS) also identifies similarities among items. Items with greater similarity show smaller geometric distance. We first conducted one dimensional (1-D) non-metric MDS to check the fit of the new item(s) in an existing facet. A model fit index (stress) of less than 0.10 indicated that the items were in the same dimension. A good item should be
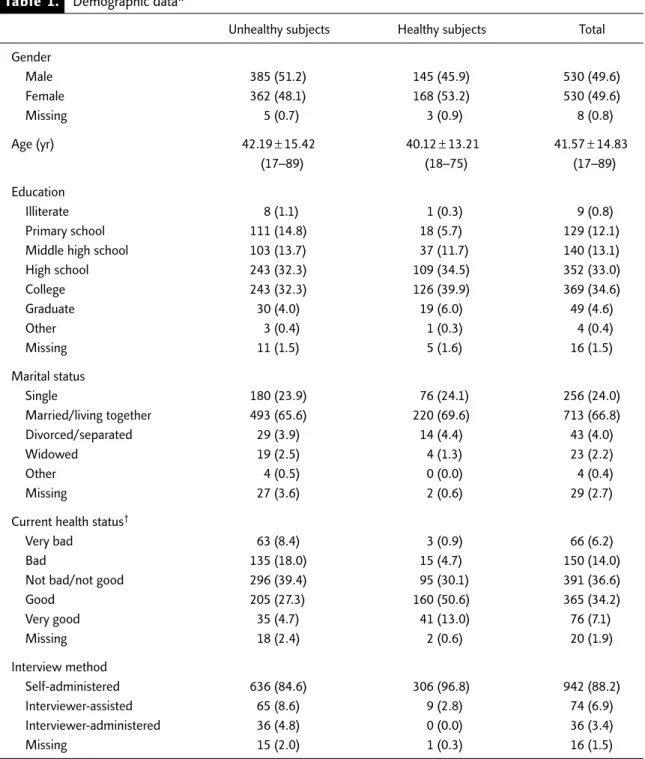
Table 1. Demographic data*
Unhealthy subjects Healthy subjects Total
Gender Male 385 (51.2) 145 (45.9) 530 (49.6) Female 362 (48.1) 168 (53.2) 530 (49.6) Missing 5 (0.7) 3 (0.9) 8 (0.8) Age (yr) 42.19± 15.42 40.12± 13.21 41.57 ± 14.83 (17–89) (18–75) (17–89) Education Illiterate 8 (1.1) 1 (0.3) 9 (0.8) Primary school 111 (14.8) 18 (5.7) 129 (12.1)
Middle high school 103 (13.7) 37 (11.7) 140 (13.1)
High school 243 (32.3) 109 (34.5) 352 (33.0) College 243 (32.3) 126 (39.9) 369 (34.6) Graduate 30 (4.0) 19 (6.0) 49 (4.6) Other 3 (0.4) 1 (0.3) 4 (0.4) Missing 11 (1.5) 5 (1.6) 16 (1.5) Marital status Single 180 (23.9) 76 (24.1) 256 (24.0) Married/living together 493 (65.6) 220 (69.6) 713 (66.8) Divorced/separated 29 (3.9) 14 (4.4) 43 (4.0) Widowed 19 (2.5) 4 (1.3) 23 (2.2) Other 4 (0.5) 0 (0.0) 4 (0.4) Missing 27 (3.6) 2 (0.6) 29 (2.7)
Current health status†
Very bad 63 (8.4) 3 (0.9) 66 (6.2)
Bad 135 (18.0) 15 (4.7) 150 (14.0)
Not bad/not good 296 (39.4) 95 (30.1) 391 (36.6)
Good 205 (27.3) 160 (50.6) 365 (34.2) Very good 35 (4.7) 41 (13.0) 76 (7.1) Missing 18 (2.4) 2 (0.6) 20 (1.9) Interview method Self-administered 636 (84.6) 306 (96.8) 942 (88.2) Interviewer-assisted 65 (8.6) 9 (2.8) 74 (6.9) Interviewer-administered 36 (4.8) 0 (0.0) 36 (3.4) Missing 15 (2.0) 1 (0.3) 16 (1.5)
T
able 2.
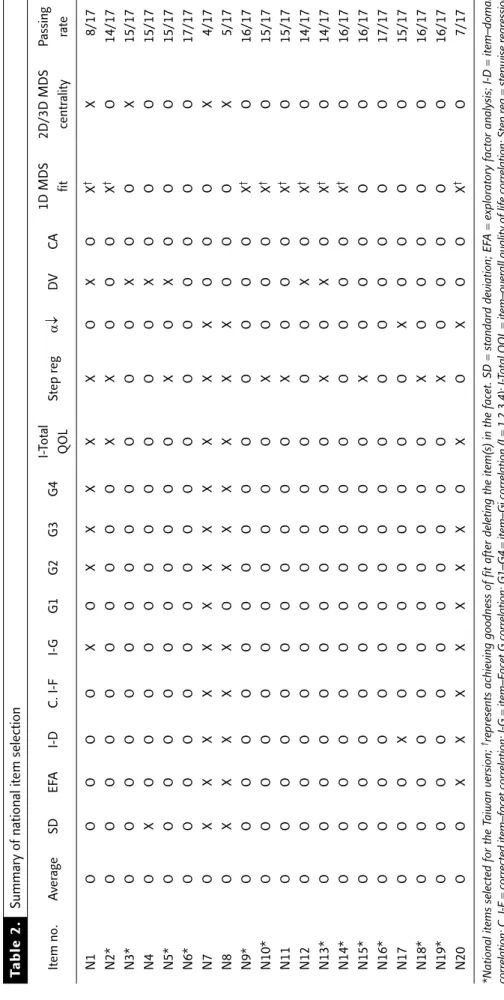
Summary of national item selection
Item no. A ver age SD EF A I-D C. I-F I-G G1 G2 G3 G4 I-Total Step r eg α↓ DV CA 1D MDS 2D/3D MDS P assing QOL fit centr ality rate N1 O O O O O X O X X X X X O X O X † X 8/17 N2* O O O O O O O O O O X X O O O X † O 14/17 N3* O O O O O O O O O O O O O X O O X 15/17 N4 O X O O O O O O O O O O O X O O O 15/17 N5* O O O O O O O O O O O X O X O O O 15/17 N6* O O O O O O O O O O O O O O O O O 17/17 N7 O X X X X X X X X X X X X O O O X 4/17 N8 O X X X X X O X X X X X X O O O X 5/17 N9* O O O O O O O O O O O O O O O X † O 16/17 N10* O O O O O O O O O O O X O O O X † O 15/17 N 1 1 O O O OOO O O O O O X O O O X † O 15/17 N 1 2 O O O OOO O O O O O O O X O X † O 14/17 N13* O O O O O O O O O O O X O X O X † O 14/17 N14* O O O O O O O O O O O O O O O X † O 16/17 N15* O O O O O O O O O O O X O O O O O 16/17 N16* O O O O O O O O O O O O O O O O O 17/17 N17 O O O X O O O O O O O O X O O O O 15/17 N18* O O O O O O O O O O O X O O O O O 16/17 N19* O O O O O O O O O O O X O O O O O 16/17 N 2 0 O O X XXX X X X O X O X O O X † O 7/17
*National items selected for the T
aiwan ver
sion;
†repr
esents achieving goodness of fit after deleting the item(s) in the facet. SD
= standar d deviation; EF A = explor ator
y factor analysis; I-D
= item–domain corr elation; C. I-F = corr
ected item–facet corr
elation; I-G = item–F acet G corr elation; G1–G4 = item–Gi corr elation (I = 1,2,3,4); I-Total QOL = item–over
all quality of life corr
elation; Step r eg = stepwise r egr ession; a ↓= Cr onbach’s a ↓
after deleting the item; D
V = discriminant validity ; C A = cluster analysis; 1D = 1-dimensional; 2D/3D = 2-dimensional/3-dimensional; MDS = multidimensional scaling; O = pass; X = fail.
Table 3. Summary of the psychometric results of the WHOQOL-Taiwan (long) version, including the 12 national items
Reliability
Internal consistency1 At facet level: 0.59–0.92 At domain level: 0.78–0.92 The whole questionnaire: 0.97 Test–retest reliability2(all p< 0.01) At item level: 0.36–0.78
At facet level: 0.68–0.85 At domain level: 0.75–0.91 The whole questionnaire: 0.86 Validity
Content validity3(all p< 0.01) Item & hypothesized facet: 0.57–0.91 Item & hypothesized domain: 0.41–0.85
Facet & hypothesized domain: 0.58–0.84 (excluding F24= D6) Inter-domain: 0.22–0.68
Domains & Total QOL: 0.64–0.85
Discriminant validity4 Significant differences were found between healthy and unhealthy subjects on most of the items, facets, domains, and Total QOL score Concurrent validity5(all p< 0.01) Domain and the corresponding visual analog rating scale: 0.49–0.62 Prediction validity6 64.2% Facet-G score variance was explained by domain scores Construct validity7 EFA: four factors (physical health, psychological, social, environmental)
were extracted, 58.3% of the total variance was explained CFA: four-factor model is the most plausible model, CFI= 0.86
Analytical methods: 1Cronbach’s α at the facet and domain levels and the whole questionnaire. 2The correlations of the items/facets/
domains, and the whole questionnaire at 2–4 week intervals on 158 subjects. 3The correlations between the item and the hypothesized
facet/domain, inter-domain, and facet–Total QOL score. 4t tests to distinguish between healthy and unhealthy subjects. 5Correlations
between domains and their corresponding 100-point visual analog score. For example, psychological domain score was correlated
with the 100-point visual analog item “In general, how satisfied are you with your psychological health”. 6Conducting multiple regression
by using domain scores as the predictor variable and the Facet-G score as the criterion. 7EFA: principal factor analysis+ promax rotation;
CFA: using EQS software, three (one-factor, four-factor, and six-factor) models were analyzed. QOL = quality of life; EFA = exploratory
factor analysis; CFA = confirmatory factor analysis.
geometrically in the center of the original four items in the same facet (centrality), which indi-cates that the item is spatially and conceptually appropriate with the items in the same facet.11,12Multidimensional (2-D or 3-D) non-metric MDS was also conducted to check the centrality of new items in an existing facet. j. When several items matched the described
selection criteria, item selection was based on researchers’ subjective judgment. For example, researchers compared the conceptual and semantic meanings of items to select the most appropriate one.
Field test
We conducted the field test using a question-naire with the 100 standard WHOQOL items
plus the 20 proposed national items on 1068 participants randomly selected from 17 hospi-tals all over Taiwan. Participants included in-patients, outin-patients, health professionals, and volunteers with a good mix of age, gender, social background, and heath status. Table 1 presents the demographic data. The proportions of the demographic data fit the WHOQOL protocol requirements.8
Results
Selection of national items
Table 2 summarizes the results of the 17 criteria (the detailed results are available upon request). The last column is the passing rate. A higher rate
indicates a better item. Twelve items were selected for the WHOQOL-Taiwan version. Four of these were selected for each of the two new facets, and the other four were for existing facets. The two new facets, “Being respected/accepted (guanxi/mianzi)” and “Eating/food” were classified into the social relationships and environmental domains, respec-tively.7These results agreed with our hypothesis. Psychometric properties of the
WHOQOL-Taiwan version
The methods for validating the psychologic prop-erties of the questionnaire are briefly described in Table 3. Table 3 summarizes the results of the standard psychometric analyses for reliability and validity conducted on the WHOQOL-Taiwan ver-sion including the 12 new national items and two new facets. Its psychometric properties are good and the values are comparable to those in other studies.7,13,14As with other studies, the original six domains can be further simplified into four domains: physical health, psychological, social relationships, and environment (see the EFA and CFA results). The WHOQOL-Taiwan version is a reliable and valid assessment instrument for meas-uring QOL in Taiwan.
Conclusion
This brief report describes the cultural adaptation of the standard WHOQOL-100 questionnaire for Taiwan. We followed the standard adaptation pro-cedure on questionnaire translation, response scale generation, and national items design.
The results showed that the WHOQOL-Taiwan version is a reliable and valid QOL measurement for Taiwanese. Readers interested in this question-naire can contact the first author of this report for detailed information.
Acknowledgments
This study was supported by grants from the National Science Council (NSC 87-2312-B-002-001,
NSC 87-2413-H-002-021, NSC 88-2314-B-002-344, NSC 89-2312-B-002-001, NSC 94-2413-H-002-018, NSC 95-2413-H-002-002, NHRI-EX94-9204PP).
References
1. Hunt SM. The problem of quality of life. Qual Life Res 1997;6:205–12.
2. Spitzer B. Quality of Life Assessments in Clinical Trials. New York: Raven Press, 1998.
3. The WHOQOL Group. The development of the World Health Organization Quality of Life assessment instrument (the WHOQOL). In: Orley J, Kuyen W (eds). Quality of Life Assessment: International Perspectives. Berlin: Springer-Verlag, 1994:41–57.
4. The WHOQOL Group. The World Health Organization Quality of Life assessment (WHOQOL): position paper from the World Health Organization. Soc Sci Med 1995;41: 1403–9.
5. World Health Organization. Resources for New WHOQOL Centers. Geneva: WHO (MNH/PSF/95.2), 1995. 6. World Health Organization. WHOQOL Protocol for New
Centers. Geneva: WHO (MNH/PSF/94.4), 1994. 7. The WHOQOL-Taiwan Group. The User’s Manual of the
Development of the WHOQOL-100 Taiwan Version, 2nd
edition. Taipei: WHOQOL-Taiwan Group, 2005. [In Chinese]
8. World Health Organization. WHOQOL Study Protocol. Geneva: WHO (MNH/PSF/93.9), 1993.
9. Lin MR, Yao KP, Hwang JS, Wang JD. Scale descriptor selec-tion for Taiwan-version of quesselec-tionnaire of World Health Organization Quality of Life. Chin J Public Health (Taipei) 1999;18:262–70. [In Chinese]
10. World Health Organization. WHOQOL Focus Group Moderator Training. Geneva: WHO (MNH/PSF/92.9), 1992.
11. Skevington SM, Bradshaw J, Saxena S. Selecting national items for the WHOQOL: conceptual and psychometric con-siderations. Soc Sci Med 1999;48:473–87.
12. Kemmler G, Holzner B. Multidimensional scaling as a tool for uncovering the internal structure of quality of life instru-ments. Qual Life Res 1997;6:435.
13. Power M, Bullinger M, Harper A, The WHOQOL Group. The World Health Organization WHOQOL-100: tests of the universality of quality of life in 15 different cultural groups worldwide. Health Psychol 1999;18: 495–505.
14. The WHOQOL Group. The World Health Organization Quality of Life assessment (WHOQOL): development and general psychometric properties. Soc Sci Med 1998;46: 1569–85.