THE IMPLEMENTATION OF A SUSTAINABLE FRAMEWORK:
Winkler Partners as a case study
研 究 生︰馬竣功
Student: Mark McVicar
指導教授︰陳海鳴 Advisor:
Chen,
Hai
Ming
國立交通大學
經營管理研究所
碩士論文
A Thesis
Submitted to Institute of Business and Management
College of Management
National Chiao Tung University
in Partial Fulfillment of the Requirements
for the Degree of
Master of Business Administration
June 2007
Taipei, Taiwan
THE IMPLEMENTATION OF A SUSTAINABLE FRAMEWORK:
Winkler Partners as a case study
研 究 生︰馬竣功
指導教授︰陳海鳴
Student:
Mark
McVicar
Advisor:
Chen,
Hai
Ming
Institute of Business and Management
National Chiao Tung University
ABSTRACT
Traditionally, environmental and business interests are seen to be at polar odds with each other, with business leaders arguing that introducing environmentally friendly practices will drive up costs and deprive them of their competitive edge. However, events over the last several years (such as the soaring cost of energy, the scientific consensus on global warming and the introduction of strict environmental standards for goods to be imported into the EU) have caused many in the business world to step back and reflect upon the environment-business relationship.
In light of the environmental crisis, this thesis seeks to examine the efforts of a (small) medium-sized Taiwanese business to incorporate sustainability not just into its business model but to infuse it into the very framework of its operations. The business in question is Winkler Partners, a law firm based in Taipei under both Taiwan and American partnership. This thesis serves to both document the implementation of the sustainable framework and assess the firm’s preliminary efforts since the program’s inception in 2004. A survey is conducted to assess whether the framework has brought a bout a change in corporate culture (the cultural sphere), while metrics on energy and resource use are examined to gauge the success of sustainability initiatives (the physical sphere).
Keywords: environment, sustainable business, corporate culture, environmental metrics, Taiwan, small and medium-sized enterprises
ACKNOWLEDGEMENTS
This thesis evolved out of a series of conversations with Robin Winkler and was inspired several works recommended by Robin Winkler, including Paul Hawken’s “The Ecology of Commerce”, Karl-Henrik Robert’s “The Natural Step Story” and Ray Anderson’s “Mid-Course Correction”. The subsequent research and writing of this thesis was an extremely enlightening process and I would like to thank Robin as well as the partners and staff at Winkler Partners for their cooperation and support. Their commitment to both the environment and society is commendable.
I would also like to thank my advisor Chen Hai-Ming for her encouragement, support and patience and as well as those nudges, both subtle and not so subtle, that helped bring this paper into being. Also, thanks to Kathy Yang and Mark Brown for their invaluable help during the review process.
This thesis also brings to a close a rewarding three years at Taiwan’s National Chiao Tung University and I would like to acknowledge the incredible warmth and openness of its staff and students, particularly the graduating classes of 2006, 2006 and 2008. Their encouragement and support helped me through the hours of classes, research and exams and they are certainly a reflection of kindness of the Taiwanese people.
The author alone assumes responsibility for the conclusions of this thesis and any errors it may contain.
Mark McVicar (馬竣功) June 2007
CONTENTS
Page Abstract ……….………. i Acknowledgements……….……… ii Contents……….……..……….……….. iii List of Figures……….……….……….. ivChapter One: Introduction……….…..………….……….. 1
1.1 Where we are: The Environmental Crisis…...……….. 1
1.2 The environmental mega-trend………. 3
1.3 A Taiwan perspective………...………. 7
1.4 Research purpose……….………. 9
Chapter Two: The Sustainable Framework – Literature Review….……….. 12
2.1 Definition of sustainability and overview of issues for SMEs………. 12
2.2 The sustainable framework………..………. 15
2.2.1 The cultural sphere…………...……….. 16
2.2.2 The use of tracking tools………..…….………. 18
2.2.2 The physical sphere……….………….……….. 20
2.3 Introduction of Winkler Partners….………. 24
Chapter Three: Introduction of the Research Method………... 26
3.1 The creation of a sustainable corporate culture……… 26
3.2 The use of tracking tools……….. 28
3.3 The physical sphere: Quantifiable metrics…..………. 29
Chapter Four: Implementation of the Sustainable Framework/Analysis of Results……….… 31
4.1 Building a culture of sustainability……….. 31
4.2 The physical sphere: Quantifiable metrics…...………... 36
4.2.1 Energy conservation and efficiency…….……… 37
4.2.2 Resource conservation and dematerialization………...……….. 41
Chapter Five: Conclusion and Discussion…...……….… 47
5.1 The cultural sphere………...………... 47
5.2 The physical sphere………. 48
5.3 Recommendations……….………. 49
5.3 Difficulties and Limitation……….………. 51
5.4 From “sustainable” to “restorative”…...………. 52
References………..……….. 54
LIST OF FIGURES
Page
Figure 1Per Capita Carbon Dioxide Emissions in Select Asian Countries, 1984-2004…… 7
Figure 2 Survey results – Partners.………. 31
Figure 3 Survey Results – Population….……… 32
Figure 4 Comparison of Electricity Use (2004-2006)…...……….. 39
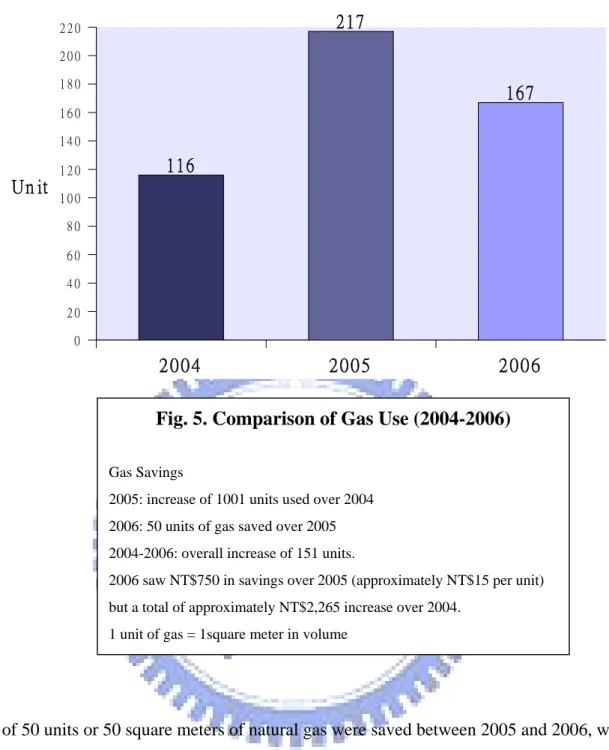
Figure 5
Comparison of Gas Use (2004-2006)
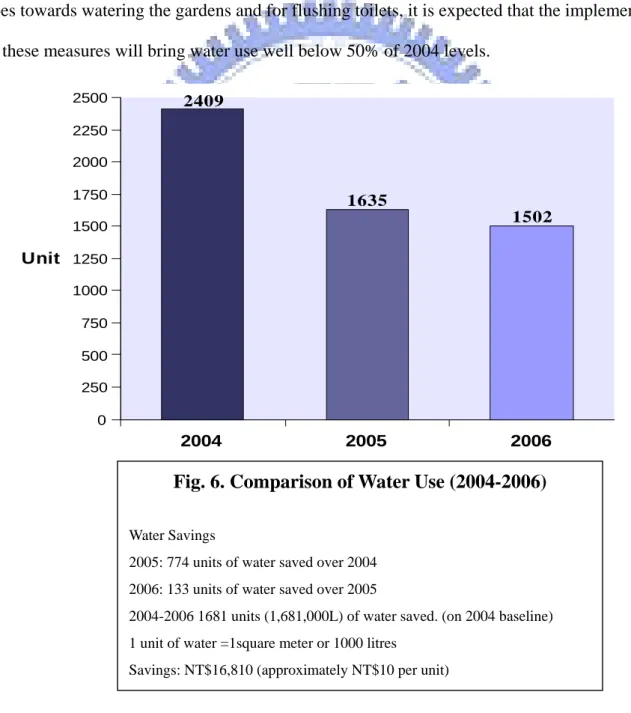
……….. 41Figure 6
Comparison of Water Use (2004-2006)
……….. 42CHAPTER ONE
INTRODUCTIONSECTION ONE: WHERE WE ARE – THE ENVIRONMENTAL CRISIS1
“The inherent resilience of ecological systems allows them to tolerate pressures up to a certain degree, but once a threshold is reached, the resulting impacts can be sudden and severe” (Fiskel, 2006)
The time for ignoring the issues of environmental degradation and climate change is over. Recent years have seen the emergence of a scientific consensus on the environmental crisis and few serious scientists now refute its existence. A recent report issued by the UN’s Intergovernmental Panel on Climate Change (IPCC) confirms that human activity is “very likely” the cause of global warming which will result in a probable rise in global temperatures by 1.8 to 4 degrees Celsius, a rise in sea levels of 28-43cm and an increase in heat waves, tropical storms and other natural disasters. Dr. Susan Solomon, one of the lead authors of the report, indicated that, “we can be very confident that the net effect of human activity since 1750 has been one of
warming”.2
The cumulative impact of human activity has spread to almost every corner of the globe. Another UN study published in March of 2005 reported that as much as 60% of the earth’s ecosystems are being degraded (Hanson, 2005), and other studies have reported obvious signs of damage to our water, atmosphere, forests, land and soil, which have, in turn, led to a historically
1
While this section explains the current environmental crisis, Paul Hawken’s book “The Ecology of Commerce”, provides a more comprehensive accounting of the problem and the causes in our current social/ political/ economic framework.
2
unprecedented loss of biodiversity (Ghadar, 2006). The IPCC’s most recent report, released in April 2007 contains some of the most disturbing predictions to date, this despite efforts by countries like Saudi Arabia and China to weaken the wording. The report indicates that millions of people could die due to hunger, thirst, floods, drought and disease resulting from climate change and that a global temperature rise of 3.6 degrees (within the predicted range) could mean the extinction of up to 1/3 of the Earth’s species.3
For years, business has argued that the implementation of strict environmental standards would negatively impact economic growth and jobs. However, environmental degradation, if left unchecked threatens the very underpinnings of our economy, the costs of which could be enormous. Recently, at a meeting between Taiwan’s Environmental Protection Administration and the British Trade and Cultural Office (“BTCO”), BTCO Director Michael Reilly cited a UK Government review, which estimated that the costs associated with climate change alone could range from 5 to 20 percent of global GDP. In contrast, the investment required to mitigate the most severe impacts of global warming would amount to only 1 % of global GDP.4
However, despite its emergence as a mainstream political and social issue, debate, rhetoric and political promises and will not solve the ecological crisis. The problem requires concrete action, and the degree to which we are able to avoid the most serious repercussions will depend on the action we take today. Regardless, of whether we meet this challenge or continue to ignore the problem, the environmental crisis certainly will be one of the defining trends of the 21st century.
3
<http://www.thestar.com/News/article/200406>
Seth Borenstein. 6 April 2007, “Bleakest Report Ever on Global Warming”, accessed on 7 April 2007.
4
SECTION TWO: THE ENVIRONMENTAL MEGA-TREND AND THE IMPLICTIONS FOR BUSINESS
Mega-trends are defined as “large social, economic, political and technological changes that are slow to form, and once in place, they influence us for some time” (Naisbitt & Aburdene, 1990). An alternative definition states that:
“[A mega-trend is ]commonly used to indicate a widespread (i.e., more than one country) trend of major impact, composed of sub-trends which, in themselves, are capable of major impacts. For example, global climate change will have a major impact, on all the countries of the world, and can be disaggregated into global atmospheric warming, sea-level rise, decrease in stratospheric ozone, etc.”5
A five-year study led by Fariborz Ghadar for Industrial Management magazine examined 12 trends that are changing the world. These “global tectonics” are significant mega-trends that cross political, social, economic and national boundaries. Over half of them are intricately related to the environmental crisis including population pressures, urbanization, disease and
globalization, resource management and environmental degradation.6
As scholars of business, we understand that long-term success and survival depends on a company’s ability to recognize and adapt to these overarching trends. However, to date the environmental crisis has largely been neglected by the business community, perhaps due to the traditional belief that conflicting environmental and corporate interests mean accepting tradeoffs
5
between profit and ecological protection. Business leaders have typically argued that introducing environmentally-friendly practices will drive up costs, stunt growth and deprive them of their competitive edge.
Competitive Advantage
There is evidence, however, that this type of thinking is changing. Jeff Immelt, CEO of General Electric has stated that “we’re at a tipping point where energy efficiency and emissions reduction also equal profitability”7, while DOW Chemical CEO Andrew N. Liveris has said that “there is 100% overlap between our business drivers and social and environmental interests”.8 Research has also shown that businesses can develop a competitive advantage through various green methods. Welford and Gouldson (1993) and Imai (1983) found that, among the various facets of competitive advantage, many can be achieved through the “greening” process, including
improved material efficiency, superior waste management, increased staff commitment,
improved media coverage and community relations, assured present and future compliance, and reduced risk exposure.
Forward-thinking companies are making the connection between sustainable practices and corporate performance, while also realizing that a sustainable approach to business can not only help the bottom line but will also lower costs as well as risks. One of the most impressive
examples is Alcoa, the world's leading producer of aluminum products. In 1998 the company set a goal to reduce greenhouse gasses in connection with its manufacturing by 25 percent by 2010. Not only did the company meet that goal seven years earlier in 2003, but it reduced its emissions
7
Dan R. Anderson, “The Critical Importance of Sustainability Risk Management”, Risk Management, 53(4), p. 74, April 2006.
8
Engardio, Capell, Carey and Kenji. “Beyond the Green Corporation; Imagine a world in which eco-friendly and socially responsible practices actually help a company’s bottom line. It’s closer than you think”, Business Week,
by 25 percent again in 2004.9 Another notable example is the well-known car manufacturer, Toyota, whose leading role in the development of hybrid cars and alternative fuel systems have helped it gain market share over GM and other US automakers, so much so, that Toyota is poised to become the largest automaker in the world.10 Finally, Ray C. Anderson, the founder, chairman and CEO of Interface, Inc., the world's largest producer of commercial floor coverings and other interior products has endeavored to make Interface the world’s first sustainable corporation by leading a company-wide war on waste and pioneering the processes of sustainable development. Andersen feels that the world is on the verge of what he considers is the “second industrial revolution”, one whose driving principle will be sustainability.
“In the 21st Century, as the revolution gathers speed, I believe the winners will be the
resource efficient. At whose expense will they win? At the expense of the resource-inefficient. Technology at its best, emulating nature, will eliminate the inefficient adapters”,11
In only the first year of implementing its sustainability program, Interface increased sales by 20%, or almost $200 million with no increase in raw materials used (Anderson R, 1997).
Risk
As the conflict between profits and ecological protection is being blurred, companies are beginning to realize additional benefits of sustainable practices. Environmental issues are now considered, along with other social issues, to be important risk factors for business. By not acting
9
Klimley A. “Sustainable Development Becoming Integral Part of Business Strategy”, Research Technology Management, 48(5), p. 2, 2005.
10
<http://www.forbes.com/markets/feeds/afx/2006/12/22/afx3277462.html>
now, companies are risking their long-term competitiveness and, in extreme cases, their very viability. Mathiew J . Keirnan, the CEO of Innovest Strategic Value Advisors,12 pointed out that businesses need to begin taking environmental risk assessment seriously. “Nobody has any idea when such events can hit a balance sheet, so companies must stay ahead of the curve” (Anderson D, 2006). An example of this is Wal-Mart whose poor social and environmental practices have cost the company an estimated US$16 billion in market capitalization (Engardio et al., 2007). How companies handle issues like corporate governance, social issues and the environment are increasingly giving insight into the overall management quality of a company. It shows breadth of vision, a focus on long-term management and value creation, and serves as an index for investors.
Socially responsible investing (SRI)13 has been around for some time but has only emerged as a mainstream investment choice in recent years. In fact, over 10% of capital managed by
professional investors is in SRI evaluated companies (Anderson D, 2006). Recent evidence is also showing that the returns for these funds are higher. A 2005 report showed that during the period from August 1996 to August 2001, the Dow Jones Dow Jones Sustainability Index grew by 15.8% while the Dow Jones Global Indexes gained only 12.5% (Anderson D, 2006). A review of 70 research studies by the Alliance for Environmental Innovation found that the stock
performance of more environmentally sound businesses can be up to 2% higher than those companies with poor environmental practices.14 Similar results were found in a study of 300 of the largest corporations in the U.S.15
12
Innovest Strategic Value Advisors was founded in 1995 and provides financial risk assessments and consulting services for corporations and investors that incorporate non-traditional risk factors such as carbon emissions and climate change.
13
SRI includes both social and environmental performance
14
C. Deutsch, “For Wall Street, Increasing Evidence That Green Begets Green”, New York Times, 19 July 1998, A7.
SECTION THREE: A TAIWAN PERSPECTIVE
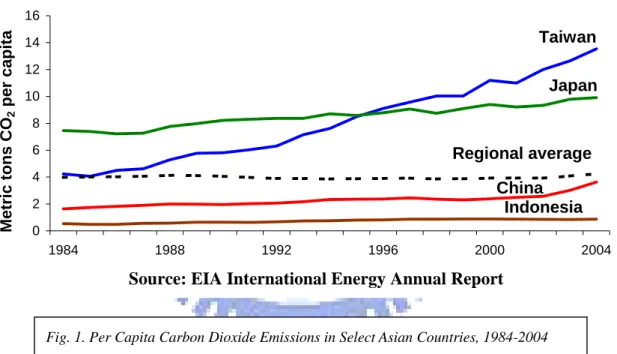
Taiwan has shown a sheer lack of impetus in tackling environmental issues, despite being one of the most developed countries in Asia and having one of the highest population densities in the world. According to the US Energy Information Administration’s International Energy Annual Report, Taiwan has the highest per-capita carbon emissions in Asia.16
0 2 4 6 8 10 12 14 16 1984 1988 1992 1996 2000 2004 Metric tons CO 2 per capita Taiwan Japan Regional average China
Source: EIA International Energy Annual Report
Indonesia
Fig. 1. Per Capita Carbon Dioxide Emissions in Select Asian Countries, 1984-2004
Even more distressing is that this trend shows little sign of abating. Robin Winkler, founding partner of the subject of this study and a member of Taiwan’s Environmental Impact Assessment (EIA) Committee17 notes that while this particular EIA committee is considered to be the most Result in a Higher Stock Price?”, ICF Kaiser International, Inc., 1996.
16
<http://www.eia.doe.gov/emeu/cabs/Taiwan/images/taiwan-emissions_percap.xls>
17
Taiwan’s Environmental Impact Assessment Committee consists of 21 members of and is chaired by the Minister of the Environmental Protection Agency. Representatives from five other government agencies sit on the board with 14 experts and professionals from various backgrounds. The committee reviews all major development projects by
environmentally-conscious since its inception, projects approved under its two year term will increase Taiwan’s greenhouse gas emissions by over 30%.18
In the 2005 “Environmental Sustainability Index” report released jointly by Yale University and Columbia University, Taiwan was ranked second last in the world in terms of “sustainability” just ahead of North Korea19. While some may dispute the way in which the placement was calculated, there is no doubt that Taiwan’s environmental quality has been seriously damaged in its quest for economic prowess. Nowhere in the world should the idea of sustainability be more important than in the heavily populated areas of Asia. These countries have experienced rapid industrial growth over the last decade, but that growth is based on old and inefficient
technologies (coal-fired power plants) and is resulting in sobering environmental costs. With the emerging economies of Asia continuing to expand using this inefficient framework, it is likely that pollution levels will continue to multiply exponentially. Currently, China has seven of the ten most polluted cities in the world and its carbon dioxide emissions are second only to the United States.20
“More than half of China’s rivers are seriously polluted. Widespread soil erosion is impoverishing many villages. This is in turn pushing desperate families into burgeoning cities where apartment buildings are sprouting at amazing rates. Urban poverty is more than matching rural poverty, but they still come”.21
18
Information collected by Taiwan’s Environmental Impact Assessment Committee and provided by Robin Winkler. Also confirmed by Taipei Times article:
<http://www.taipeitimes.com/News/editorials/archives/ 2007/03/17/2003352697>
Chen, Bing-heng. 17 March 2007, pollutants also pose a hazard to the economy, accessed on 17 March 2007.
19
Yale Center for Environmental Law and Policy, Yale University; Center for International Earth Science Information Network, Columbia University, “2005 Environmental Sustainability Index”, 2005.
20
This problem has only been magnified by increasing Taiwan investment in China. Former president Lee Teng-hui once said:
"The strategic mistake of Taiwan's economic development is that it has given up building today's Taiwan for duplicating yesterday's Taiwan in China, while failing to plan for tomorrow's Taiwan. This is a suicidal economic strategy".22
There are many that will argue that this is more of a political statement than an economic or environmental one. However, when examined in the context of sustainability, it touches upon one the key issue facing not only Taiwan, but the entire developed world. As Taiwan develops, it is moving many of its more polluting industries to China, where they are implemented on a much larger scale. These companies not only take advantage of China’s cheap labor but also its lax environmental regime. As China prepares to surpass the U.S. as the world’s biggest polluter, we must realize the contributions of Taiwan and Taiwan-funded businesses to the problem.
SECTION FOUR: RESEARCH PURPOSE
Hoffman and Ocasio (2001) found that future developments in the environmental domain are likely to negatively impact businesses ability to meet its goals and that managers must, in turn, formulate strategies to cope with those developments; this includes a comprehensive and systematic monitoring of environmental issues and adequate responses by management. Therefore, in the context of the impending crisis, this paper looks at the efforts of a small
22
business not just to incorporate sustainable practices into its business model, but to infuse those concepts into the very framework of its operations. The business in question is Winkler Partners (WP), a law firm based in Taipei under both Taiwan and American partnership. A survey is conducted to assess the culture created within the firm (the cultural sphere) and metrics on energy and resource use are examined to gauge the success of sustainability initiatives (the physical sphere).
Specifically, the present paper hopes to:
1. Describe and document the implementation of a sustainable framework and highlight the motivations and barriers for small and medium-sized businesses.
2. Assess WP’s corporate culture and perceptions of employees in response to the new sustainable framework.
3. Describe and assess the implementation of sustainability initiatives at WP using quantitative metrics and analyze whether it has successfully implemented the ideals of the sustainable framework.
4. Highlight the areas of success, provide recommendations for improvement, and propose revisions to the framework to reflect reality and meet sustainable goals.
WP seeks to transform itself into a sustainable and “zero impact” business. While its ideals are admirable, the program is still in its infancy. It is important to note that to date, no radical measures have implemented. With the exception of a rooftop garden (see Appendix I), no major infrastructure changes have been made and, in general, conservation measures have been simple and easy to implement.
sized business in the environmental movement. The sustainable business framework used in this study is then presented, along with a review of extent literature on the various elements of that framework.
CHAPTER TWO:
THE SUSTAINABLE FRAMEWORK - LITERATURE REVIEW
SECTION ONE :
THE DEFINITION OF SUSTAINABILITY AND AN OVERVIEW OF ISSUES PERTAINING TO SMALL AND MEDIUM-SIZED ENTERPRISES
DEFINITION
Sustainability is defined by the UN’s World Commission on Environment and Development as “the ability of current generations to meet their needs without compromising the ability of future generations to meet theirs”. In fact, the Commission’s Brundtland Report (1987) indicated that sustainable development requires the realization that economic development and ecological conservation are mutually interdependent in that our ecological environment provides a foundation for economic development.
Over the last century, however, little thought was put into the needs of the future and humanity has been churning through its natural resources at an alarming rate. In a conversation with Robin Winker, he noted that our economy has long been focused on only the first half of the
sustainability definition, namely, our ability to meet the needs of today. Within the business community, meeting the challenge of sustainability will require a radical change of not only our business models and practices, but also the culture and attitudes that are the root cause of the problem. Scholars of sustainable business often refer to the “triple bottom line” which call for performance in environmental and social as well as financial spheres. While WP does
incorporate socially progressive concepts into its business ethic, for the purposes of this paper, sustainability means achieving environmental and financial sustainability.
Role of Small and medium-sized enterprises (SMEs)
Since the study deals with a small to medium-sized business, the extant literature relating to SME’s and the implementation of sustainable policies is first discussed. The literature shows that, while individually their impact may be small, collectively, SMEs account for a significant
amount of total pollution and waste. Also, the motivations and barriers to the implementation of sustainability programs have characteristics that are quite distinct from those of large
corporations and, therefore, it is important to understand and examine these factors before introducing the sustainable framework used in this paper.
SMEs account for approximately 70% of world production and, while it is obvious that their combined impact on the environment is significant, very few are aware of the potential
advantages of sound environmental strategy and practices (O’Laoire and Welford, 1996). While several studies have shown that good environmental practices provide a wide range of
quantifiable benefits (Hillary 2004; Simpson 2004, Willard, 2005), SME’s have traditionally been slow in their adaptation (Rowe and Hollingsworth, 1996). While this also applies to Taiwan SMEs, there is little research on Taiwan in particular. Studies from other countries around the world, however, may be able to shed some light on the barriers to green business and what incentives could effectively bring about change.
BARRIERS
A study by Studer, Welford and Hills (2006, p. 424) found that 78 percent of SMEs in Hong Kong indicated that they did not engage in more sustainable practices because they were not required to do so under the law, while shortages in money, lack of demand from stakeholders or
customers, and a lack of technical know-how also arose as key barriers. Poor understanding of environmental issues was also found to be a barrier in several other studies (Ammenberg and Hjelm, 2003; Tilley, 1999; Welford, 1994). Furthermore, Simpson et al. found that SMEs
perceived that environmentally friendly practices provided no competitive advantage and were a cost that could not be transferred to customers (Simpson et al., 2004).
In fact, misperception is one of the most significant obstacles to corporate greening. In general, small and medium sized-businesses believe that their activities have little or no impact on the environment (Rowe and Hollingsworth, 1996; Lee, 2000; Hillary 1995; Simpson et al., 2004). The Groundwork studies (Groundwork, 1995/1998) in the UK found that while environmentally friendly practices can actually save costs, create new markets and improve customer satisfaction, very few firms were aware of these advantages. A study by Simpson et al. (2004) also confirmed the perception among UK SMEs that “green” business cannot produce competitive advantage, even though there is documented evidence that these efforts can provide cost savings resulting from greater efficiency, increased compliance with environmental legislation and more effective waste management.
MOTIVATION
In general, SME’s do not consider the environment to be a core issue for business (Rutherfoord et al, 2000). However, studies have shown that among those that do take action, the main motivation is often compliance with regulations (Studer et al, 2006) meaning they are reactive rather than proactive. Research in the UK also shows that regulations are likely to be the most effective method to move businesses towards more sustainable practices and that currently there is an over reliance on voluntary methods (Simspon et al, 2004). Furthermore, even when
impact their business (Stokes A, Rutherfoord R, 2000).
A study by Petts et al (1999), however, indicates that the implementation of environmental measures does not necessarily stem from external pressures such as legislation, but can be initiated by individual leaders and managers with strong personal commitment to environmental issues. This was confirmed by Studer et al (2006) whose study suggests that the beliefs of individual managers in Hong Kong was one of the major drivers for green practices while reputation and brand enhancement were more important for larger companies. Therefore, the large gap between the majority of SMEs that give little or no consideration to environmental issues, and the small minority of proactive SME’s is due to the leadership commitment to the environment (Hillary, 2000). Masuel (2007) also found that the main reasons for initiating “greening” programs among printing companies in the Netherlands were the improvement of working conditions, compliance with anticipated regulations and moral duty.
Larger companies are often much more proactive in their implementation of environmental management systems; however, in contrast with SMEs, the motivation behind these programs is most often a desire to protect the company’s reputation and brand value (Studer et al., 2006). Also, SMEs often face very different issues in terms of the implementation of green programs but current research and systems are generally geared to larger businesses and fail to account for the specific needs of SMEs (Gerstenfeld and Roberts, 2000, Hillary 2004).
SECTION TWO: THE SUSTAINABLE FRAMEWORK
The extant literature presents a wide variety of factors that could be included in a sustainable model. However, for the purposes of this paper five elements under three broad categories have
been selected that apply most to Winkler Partners and its implementation of a sustainable framework. These include, 1) The Cultural Sphere which involves building a culture of
sustainability, 2) the Use of Tracking Tools, which measure quantifiable items such as overall
impact, energy use, waste production etc, and 3) The Physical Sphere which entails improvements in energy conservation and efficiency, resource conservation and
dematerialization, and the use of cleaner and more natural methods. This section gives an
overview of each element and reviews some related literature.
THE CULTURAL SPHERE
“We cannot solve the problems we have created with the same thinking that created them” (Ray and Anderson, 2000, p. 155)
Building a culture of sustainability: This includes a clear vision and focused goals, the raising
and maintenance of environmental awareness (both general and firm-specific), and the
engagement, participation and support from all members of the organization. There is a specific focus on the need for upper management engagement, buy-in and support.
Under a sustainable framework, financial and ecological goals must be aligned, however, traditionally, this has not been the case. Hass (1996) notes that most businesses fail to incorporate environmental factors into corporate strategy and Porter (1991) stresses that corporate strategy must maintain a dynamic balance between company goals and the natural environment. To this end, corporate culture is key. It has been argued that the successful creation of an ecologically sustainable company depends on the institutionalization of environmental beliefs and processes into the very fabric of the organization (Purser, 1994; Jennings and
(Post and Altman, 1994; Welford, 1995).
The creation of an environmental consensus is a significant factor in overcoming obstacles to sustainability. As a company works towards its goals, barriers to further improvement often become more significant as most of the “low hanging fruit” (meaning low cost conservation methods that can be easily implemented) has been picked. It is also suggested by Larsen and Peck (2001) that companies with a focused culture of sustainability are better able to overcome the “green wall”, which refers to significant technical, operational or financial barriers
encountered as firms attempt to implement more ambitious projects and changes.
Kerr (2006) also notes that companies with a strong environmental ethic are more effective at overcoming obstacles encountered in the greening process, and that effective solutions to those obstacles require the backing of leadership, an effective environmental management system and a culture that focuses on continued education on environmental issues and sustainable practices. Stainer and Stainer (1997) also argue that, “corporate culture… must perceive greening, in the long term, as a key business value which should be become an inherent rather than a conscious issue”.
In creating that culture, Kerr specifically notes the importance of leadership:
“the key to organizing an enterprise for sustainable operation is for leadership to establish a culture that is proactive in formulating environmental and social objectives, to pursue a strategy of continuous environmental and social improvement and to resource that strategy”23
23
This is reinforced by research by Fineman (1997), Crane (2000) and Harris and Crane (2002) which all found that one of the most significant barriers to corporate greening is lack of management support.
THE USE OF TRACKING TOOLS
Once goals are set and measurement categories chosen, data must be captured and metrics created to track the process towards those goals. These metrics should be comprehensive in that they reflect the entirety of the company’s activities (and thereby its environmental impact) yet be simple, clear and easily understood.
An important step in implementing a sustainable framework is the selection of specific
environmental performance indicators (EPIs). Henri and Giasson (2006) define environmental performance indicators as:
“measures that are based on observable or determinable quantities and that reflect in various ways the environmental impact of a given activity. The quantities involved may be physical quantities or materials… (energy, water, raw materials etc.) or that result from the process (… emissions in the form of air pollution, liquid effluent, etc.)”
These metrics can be used to track progress on sustainable goals, identify trends and
relationships and should be consistent (ideally universally consistent) with the ability to compare and contrast with other firms. The Global Reporting Initiative recommends a number of EPIs that measure all aspects of environmental performance including materials, energy, and water use,
biodiversity, emissions, suppliers, products and services, compliance, transportation and overall performance (Henri and Giasson, 2006). Among these, materials use and emissions are the most concrete and easily quantifiable, and therefore most often used by companies for reporting (Fiskel, 2006). However, it is important to ensure that the information collected is of good quality and the metrics used are practical and applicable. Beaumont et al (1993) have shown that information on environmental practices can be a strategic resource. Further, Stainer and Stainer (1997) indicate that “benefits and power will be derived from how [environmental metrics are] used rather than just having access to them. More information, greater openness and democracy are vital to the greening of industry”.
While metrics should be comprehensive and attempt to reflect all company activities, the amount of detail should depend on the company and the resources available.24 Henri and Giasson (2006) also warn that simplicity is essential as too many measures can make information unusable and that focus should on simple measures that can be “comprehended, calculated and controlled”. Furthermore, metrics collected should be suited to the particular business or industry and can also be used for competitive advantage. Companies like Philips are even creating benchmarks for their individual products in an effort to create “Green Flagship” that compare favorably with competing products on things such as power consumptions, materials application,
environmentally relevant substances and packaging.25
24
While the metrics used in this study are quite simple, an example of a more detailed and comprehensive set of metrics reflecting a larger and more complex company can be found at Interface Inc.’s sustainability website at http://www.interfacesustainability.com/metrics.html
THE PHYSICAL SPHERE
Energy conservation and efficiency: A sustainable framework should focus on conservation,
improved efficiency, greater energy intensity (less energy required per unit of product), and the introduction of cleaner, more efficient technologies. Conservation and efficiency measures should begin with easy to implement measures that show immediate results.
The use of resources and energy are of particular importance to a sustainable framework. Despite the recent rise in environmental consciousness, the World Energy Outlook 2005 indicated that world energy demand could be up to 50% higher in 2030 than today, with most of the growth coming from Asian economies (Punte et al, 2005, p.42). Punte et al.’s research shows that
companies with management systems in place (such as the sustainable framework detailed in this paper) are likely to experience continued progress in both resource and energy efficiency. The study also recommends amending policies to promote energy efficiency and that efforts should be extended to other resources, in particular, water.
In the latter part of the 20th century, the answer to the problem of sustainable development was often a technological fix (Hay, 2005). However, companies are learning that an effective
sustainable framework begins with simple conservation measures. Many studies have lauded the benefits of beginning a greening program by picking the “low hanging fruit” (Larson and Peck, 2001; Anderson R, 2007). Focusing on these simple measures can bring about quick
environmental and economic gains and help to maintain focus and motivation.26 Research in ASEAN member countries has even found that energy efficiency improvements through simple and cost-effective methods could help lessen foreign debt (Karki et al, 2005).
26
With the growing threat of global warming and the economic pressures to maintain economic growth, energy security will be a major issue in Asia, and to combat that threat, energy efficiency will play an important role.27 For Taiwan specifically, energy security is critical, given that more than 97% of the country’s energy demand is satisfied by foreign imports.28 However, research shows that, despite a number of government action plans aimed at improving energy efficiency and curbing greenhouse gasses, there is no evidence of measurable improvements in Taiwan’s energy efficiency.29
Resource conservation and dematerialization: This entails the reduction of the amount of
materials used through the conservation and redesign of products and/ or processes. Material intensity must be improved and the use of virgin raw materials decreased or avoided. Finally, any waste resulting from business activities should be reused or recycled wherever possible.
Ecological sustainability is threatened in large part by the increasing materials flows used to drive our businesses; however, we face opposing pressures from population growth and economic development that raise demand for materials (Fiskel, 2006). Therefore, to remain viable, the sustainable framework requires a decoupling of economic growth and profit from the amount or intensity of materials used. This decoupling would allow for external environmental costs to be reflected in market prices and allow the market mechanism to determine levels of
27
Karki et al. “Energy and environment in the ASEAN: challenges and opportunities”, Energy Policy, 33, p. 503, 2005.
28
Wu Li-ming et al. “Structure model of energy efficiency indicators and applications” Energy Policy, 35, p. 3768, 2007.
29
use30 However, until now, the overuse and abuse of resources is largely due to the perception th they are free and limitless.
at ved
f
ematerialization means the reduction of materials throughout the entire economic system
Consider the difference between a 1960’s stereo set and today’s iPod. The 1960’s stereo
n.”32
hile the original consideration behind ideas such as the Sony walkman or the iPod were not
31
While there are many examples of companies who have achie commendable results in material conservation, overall material use continues to grow around the world. Research by Huesseman (2003) shows that even within the European Union, which is leading the world in the sustainable movement, there is no absolute decline in the volume o resource requirements and that reductions in material intensity are often obtained through the import of material-intense products, thereby shifting the burden to other regions of the world.
D
and can include a variety of methods such as material efficiency, waste reduction, design for the environment, packaging reductions, recovery programs, and the substitution of services for products (Fiskel, 2006).
“
is bulky, as are the thousand of vinyl albums that required numerous trips to the music store. The iPod is lighter and more energy efficient by far, and the music is usually accessed without travel. This is the very emblem of dematerialization –though desig
W
ecological, the reduction of materials can reap both environmental and financial benefits. One example is Ray Anderson’s Interface flooring company whose waste management programs reduced waste by 50 percent in the first three years, which resulted in savings of over US$125 million (Paehlke, 2006). Zero waste programs at a number of corporations such as Xerox,
30
OECD. “Indicators to measure Decoupling of Environmental Pressure from Economic Growth”, 2002.
31
Hewlett Packard, Bell Canada, Quaker Oats, and the Beer Store of Ontario have lowered co while achieving over 90 percent reductions in waste production.
sts
verall, in adopting a sustainable framework, material use must be examined from a broad the
g
leaner and more natural methods: Current methods and practices should be examined and
ects
ver the last century our economic growth and industrial advancement have created a wide array
ers to
ls, as
33
Intel has saved millions of dollars by using lighter-weight plastics in its manufacturing processes and is also working to develop a closed-loop system for some of its components to ensure zero-waste (Fiskel, 2006).
O
perspective and, where possible, include the entire lifecycle of the materials used, including “sources of materials, their pathways throughout the natural and built environments, and their eventual sinks”.34 The use of virgin materials must be reduced wherever possible, and recyclin rates for waste that is created must be increased.
C
cleaner more natural substitutes adopted where possible. Where not possible, the negative eff of environmentally harmful or toxic practices should be minimized.
O
of chemicals and toxins that have found their way into our ecosystem. However, these materials can have harmful effects not only to our health and but also to our economy through cleanup, waste storage and management costs, rising healthcare costs and environmental damage. Therefore, an important element of the sustainable framework is detoxification, which ref the reduction, removal and replacement of environmentally harmful materials thought measures such as cleaner technologies, elimination of toxic or hazardous materials in products and
subsequent waste streams, alternative fuels and combustion techniques, restricting materia
33
Connett P. “Zero Waste Wins”, Alternatives Journal, 32(1), p. 15, 2006.
34
well as waste containment and treatment (Fiskel, 2006).
While still not yet mainstream practice, there are many large multinational corporations that have
am f
o to the fact that the subject of this paper is a service industry, there are fewer issues regarding
ECTION THREE: INTRODUCTION OF WINKER PARNTERS
inkler Partners is a medium-sized law firm that employs 57 people (including its
wo floors of
e to
seen both ecological and financial benefits of cleaner business practices. Between 1987 and 1993, chemical giant Dupont reduced toxic emissions by 74%, halved its landfill waste and cut its $1 million per year waste treatment bill by $200 million. DuPont has also cut its emissions of cancer-causing chemicals by almost 70% since 1987. 3M’s Pollution Prevention Pays progr eliminated more than 1.5 billion pounds of air, land and water pollution for a total cost savings o $790 million.35
D
the use of environmentally harmful chemicals or materials. However, the materials and processes at WP should be examined and any harmful chemicals or toxins removed wherever possible.
S
W
environmental legal defense association, Wild at Heart) and operates out of the top t
a 13 storey building in downtown Taipei (See Appendix II). While in its current form since 2002, Winkler Partners is a continuation of a consulting practice founded by Robin Winkler in 1989. The firm handles legal matters mostly for international clients, including some of the world’s largest companies. Winkler Partners is a full-service firm, with practice areas in litigation and arbitration, criminal, general commercial and administrative law, tax, intellectual property, general corporate and investment, M&A, insurance, and lobbying. Robin describes his desir
pursue a more sustainable life and work as the implementation of something he had “always felt was right”. His efforts gained momentum when an illness in 1992 caused him to reexamine his life’s goals. The current sustainability drive began in 2004 when the firm moved its offices to its current location. His inspiration came from works by authors such as Daniel Quinn (Beyond Civilization), Paul Hawken (The Ecology of Commerce, Natural Capitalism), E.F. Schumache (Small is Beautiful), Joe Dominguez and Vicki Robin (Your Money or Your Life), and the book “Mid-Course Correction” by Interface Inc. founder Ray Anderson.
r
inkler Partners is a perfect candidate for a small study such as this. It is a relatively small ly, it
obin Winkler’s goal for the firm has always been “zero waste” and “zero impact”. Therefore, W
operation based out of one location, which simplifies the measurement of its efforts. Second is a service industry and therefore naturally employs a less polluting business model. It does not have a significant supply chain, at least as far as actual materials are concerned, although it could be argued that its value chain is rather extensive given that it works with some of the world’s largest corporations.
R
the firm has implemented a system of metrics to assess its actual environmental impact (the use of resources and creation of waste), and then chart its improvement over time.
CHAPTER THREE: INTRODUCTION OF THE RESEARCH METHOD
his section examines how the implementation of the sustainable framework was measured at
s is
ECTION ONE: THE CREATION OF A CORPORATE CULTURE
he literature shows that for sustainable programs to be a success, participation and support of ts
the time
ere
he survey contained twenty questions to determine increased awareness of environmental
(both T
Winkler Partners. Methods include assessing the perceptions of the employees towards this new framework and the examination of energy and resource conservation using concrete metrics. Finally, for sustainable initiatives where metrics are not available a description of WP’s effort provided.
S
T
management and staff is crucial. To this end, we look at the culture created at WP and whether i “green shift” has been successful. This new direction is certainly a radical departure for a law firm and it is important to assess the reaction of employees. Given the importance of culture in implementing a sustainable framework, a survey was conducted to assess the attitude of employees towards the new environmental initiatives. The total number of employees at of the survey was 47, including 20 legal staff (partners, lawyers, associates and paralegals), 22 administrative staff (secretarial, finance, human resources, information systems and general affairs) and 5 translators. Surveys were given to the total population (47) and 44 responses w received, yielding a response rate of 94.6 percent. All the responses received were useable (see Appendix III).
T
issues, general support for the firms efforts, perceived impact on the working environment, participation levels (in the firms efforts), the effect of the program beyond the office, the perceived success or failure of the program and thoughts on communication of the results
internal and external). The survey used a five point scale ranging from 1 (strongly disagree) to 5 (strongly agree), with 3 representing no opinion on the issue/question. Respondents were also encouraged to provide personal comments. The following are detailed descriptions of the question groupings:
1) Awareness of environmental issues was determined by two questions in the survey
) General support for the firms efforts was determined by six questions in the survey (1, 10, 11,
too much
) The perceived impact on the working environment (positive or negative) was measured by e
) Participation levels were measured by four questions (4, 5, 7, 8) including general questions
sess real
ture. (Questions 3, 7) that asked whether working at the firm had increased awareness of
environmental issues and/or caused a reconsideration of consumption patterns.
2
12, 13, 15) and covered issues such as the general importance of environmental issues, support for the firms efforts to become more sustainable, whether environmental considerations should figure into business decisions, and whether the firm devoted time to environmental issues.
3
four questions (2, 9, 16, 17) and asked whether WP’s environmental efforts had improved th working environment, whether adjusting to the new sustainability measures was perceived as difficult or whether these measures had disrupted respondents’ work.
4
such as whether working at WP had caused respondents to live in a more sustainable manner, or specifics such as whether respondents used reusable items such as water bottles,
chopsticks and food containers. Given that such a small study would be unable to as participation, it should be noted that the survey measures perception of participation, reflecting whether or not the sustainable ideas have been ingrained in thinking and cul
5) Conservation beyond the office refers to whether the measures taken at WP were used item
) The perceived success/ failure of the program was covered by two questions (18, 20) that ity.
) Communication and promotion of the firm’s efforts was covered by two questions (14, 19)
s should be
he question groups and specific questions posed in the questionnaire reflect various cultural
ECTION TWO: THE USE OF TRACKING TOOLS
or any assessment of change, a benchmark must be established and metrics created to measure beyond the office, at home and whether employees general behavior was affected. This was measured by three questions (4, 6, 7) and covered the use of reusable items such as water bottles, chopsticks and food containers and general changes in lifestyle and consumption patterns.
6
asked about the general progress and perceived success of WPs efforts towards sustainabil
7
measuring whether the firm’s sustainable activities and results were successfully communicated internally and whether employees believed that these efforts/result
communicated to clients. Only question 19 (internal communication) was included in the statistics reported in Chapter Four. Ideas on external communication were asked for management consideration.
T
factors complied from the literature review for this paper as well as conversations with firm partners regarding information they would like to obtain on the cultural transformation at the firm.
S
F
Environment Programme at Cambridge University, says that businesses are often unaware of exactly the impact they are having and that “ it is the companies that do measure [environmen and social impact] that know and understand that impact and so are best able to mitigate the negative” (Hanson, 2005, p. 48). Barnhizer (2006) admits “to an absolute distrust of cheap an easy proclamations of lofty ideals and commitments to voluntary or unenforceable codes of practice. The only thing that counts is the actor’s actual behavior”. Therefore, our examinatio the sustainable framework implemented at Winkler Partners is not based on rhetoric and stated goals, but on actual measurable data. Various areas are targeted for changes, adjustments and improvements and specific metrics are used with which to measure progress. For this study, th benchmark is the data collected on resource use in Winkler Partners in 2004. The data collected are measurements of electricity, water and gas use as well as the total amount of recycling and waste. Comment will also be provided on the appropriateness of these metrics and whether they accurately reflect the total impact of business activities.
tal
d
n of
e
ECTION THREE: THE PHYSICAL SPHERE – QUANTIFIABLE METRICS
his section assesses WP’s efforts to reduce its environmental impact using specific quantifiable
amine ste and related d S T
metrics. Discussion is also provided on the methods used to that have brought about these measurable changes. To assess WP’s progress in energy conservation and efficiency, we ex metrics for electricity use (with specific discussion on WP’s efforts relating to general efficiency, lighting, and air-conditioning) and gas use. Efforts at resource conservation and
dematerialization are then evaluated using metrics for water use as well as for wa
recyclables (including efforts relating to sorting and recycling, purchasing, reducing food-waste and the use of web-based systems). Finally, there is a brief discussion on how WP has implemented cleaner and more natural methods around the office. These metrics are all poste
on the company’s intranet, so that employees can track progress. Reports are also given to employees once or twice times a year to highlight new initiatives, provide a progress updat to discuss possible further improvements.
CHAPTER FOUR:
THE IMPLEMENTATION OF THE SUSTAINABLE FRAMEWORK/
ANALYSIS OF RESULTS
SECTION ONE: BUILDING A CULTURE OF SUSTAINABILITY
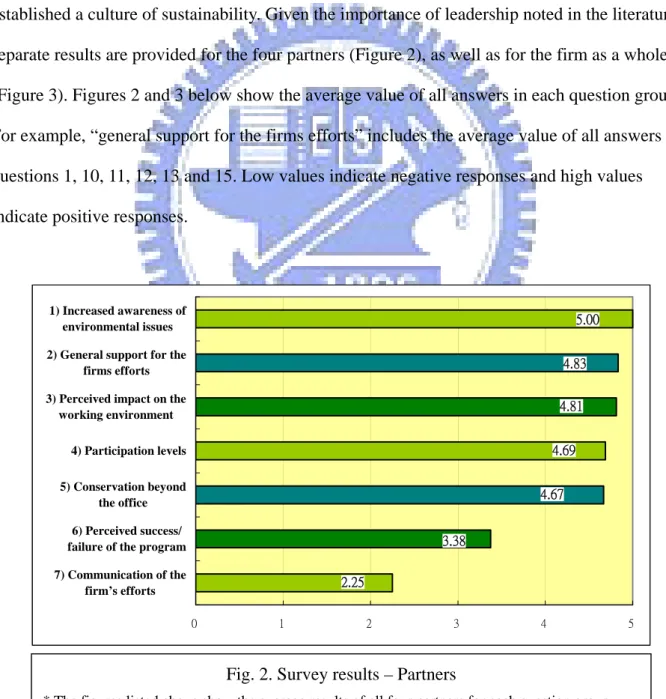
This section examines the results of the survey to understand the degree to which WP has established a culture of sustainability. Given the importance of leadership noted in the literature, separate results are provided for the four partners (Figure 2), as well as for the firm as a whole (Figure 3). Figures 2 and 3 below show the average value of all answers in each question group. For example, “general support for the firms efforts” includes the average value of all answers to questions 1, 10, 11, 12, 13 and 15. Low values indicate negative responses and high values indicate positive responses.
2.25 3.38 4.67 5.00 4.83 4.81 4.69 0 1 2 3 4 5 7) Communication of the firm’s efforts 6) Perceived success/ failure of the program 5) Conservation beyond
the office 4) Participation levels 3) Perceived impact on the
working environment 2) General support for the
firms efforts 1) Increased awareness of
environmental issues
Fig. 2. Survey results – Partners
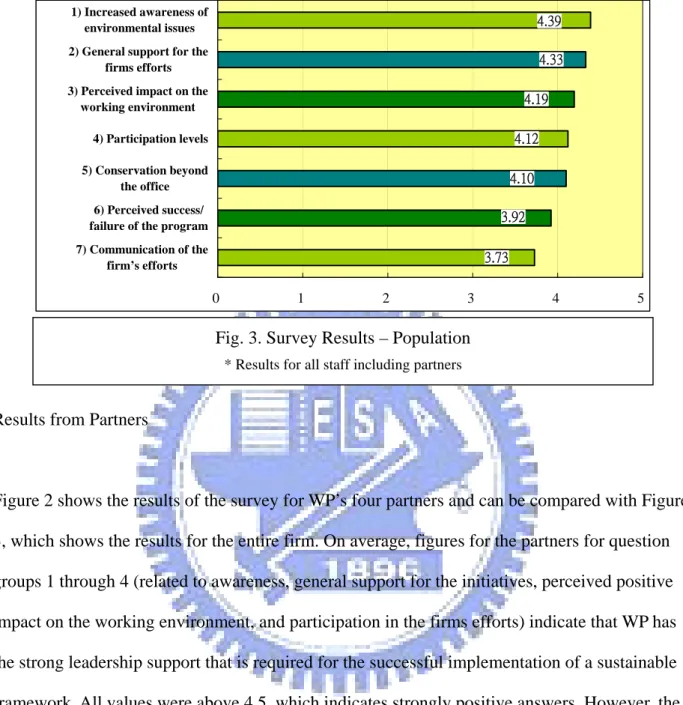
3.73 3.92 4.12 4.39 4.33 4.10 4.19 0 1 2 3 4 5 7) Communication of the firm’s efforts 6) Perceived success/ failure of the program 5) Conservation beyond
the office 4) Participation levels 3) Perceived impact on the working environment 2) General support for the
firms efforts 1) Increased awareness of
environmental issues
Fig. 3. Survey Results – Population * Results for all staff including partners Results from Partners
Figure 2 shows the results of the survey for WP’s four partners and can be compared with Figure 3, which shows the results for the entire firm. On average, figures for the partners for question groups 1 through 4 (related to awareness, general support for the initiatives, perceived positive impact on the working environment, and participation in the firms efforts) indicate that WP has the strong leadership support that is required for the successful implementation of a sustainable framework. All values were above 4.5, which indicates strongly positive answers. However, the partners (average value of 3.38) perceived the program to be less successful than the overall population (3.92). Through conversations with employees and comments provided on the survey, it was found that this discrepancy is due to a more pervasive attitude among the partners that “we can be doing more/better”. The majority of the staff, however, seemed happy with progress and answered higher to indicate “we are doing well” in our efforts. Also, the partners were split on whether they believed that sustainable programs and results were being successfully
while two indicated that they felt internal communication was relatively successful. This explains why the partners average answer to question group 5 is 2.25 compared to 3.73 for the whole firm. One partner’s overall comments included the following, which sums up some of the key points in this section.
“I think that sustainability is key for every entity in every industry. The more we can learn and apply in our daily lives (whether at the office or at home) the better off we will be, and the more we can help others become more sustainable. Lately, I have been a little frustrated by what I perceive as a lack of engagement by more of our colleagues, but that is part of the learning curve, and I think comes back to our need to promote these activities (and changes in behavior) more effectively.”
Overall results
1) Awareness of environmental issues
This area showed the strongest results. All 44 respondents agreed or strongly agreed that the environment is an important issue. All respondents except for two felt that working at the firm had increased their awareness of environmental issues. The two respondents who answered in the negative, indicated that they had always been concerned with and aware of ecological issues and therefore did not agree that working at WP specifically increased their awareness. These results are not surprising considering the atmosphere at WP. Environmental issues and initiatives are often the focal point of firm meetings and retreats, and continued education is promoted using emails on environmental issues, guest speakers, and a wide variety of posters, brochures and other informative material found throughout the office. In recent years, potential employees have been informed of the firm’s goals during interviews and while it is not a critical factor in hiring decisions, WP does attempt to bring in like-minded individuals.
2) General support for WP’s efforts
The findings generally show a great amount of support for the sustainable movement at WP (4.33). This consensus will likely increase the success of the program and help overcome obstacles. The results also seem to show that WP has successfully infused environmental ideas into corporate culture with 84% of respondents agreeing that sustainability should be a key factor in business decisions. The backing of the partners has likely contributed to these results
3) The perceived impact on the working environment (positive or negative)
The data shows that employees generally perceive that measures to improve sustainability also improved their working environment (4.19). Only one colleague felt that the firm was spending too much time on environmental issues and commented that the firm should not lose focus on its core legal business. Some other staff indicated the need to ensure focus on the legal business and two mentioned that increased profits by the firm could help fund more environmental efforts (see Appendix VII on Wild at Heart). Three respondents did comment that at times it was too hot in the summer making it difficult to concentrate, causing more irritability and causing delays in accomplishing tasks.36 Generally, however, the large majority of employees felt that
sustainability initiatives did not disrupt work. Over 60 percent did not perceive adjusting to the new measures as difficult. One respondent noted “To date, I don’t think the adjustments have been difficult at all. They may become more difficult as we become more ambitious” This lends weight to the fact that WP might hit a “green wall” at which point, research tells us that a corporate cultural consensus is even more important.
4) Participation levels
The data also shows a high perception of participation among employees (4.12). It was also
found that in addition to general participation, employees were taking measures to use reusable items such as water bottles, chopsticks and food containers. There seemed to be a general desire to use these items but several people commented that they often forgot to bring chopsticks or food containers when they went out for lunch. Answers in this section, however, do conflict somewhat with comments indicating that cooperation and participation by employees could be improved.
5) Conservation beyond the office
The data shows some success at getting employees to conserve beyond the office (4.10). This is likely due to the general support for the environment and the implementation of sustainable policies at the firm. Overall, 42 of 44 respondents agreed or strongly agreed that working for WP had caused them to live in a more sustainable manner. This shows that WP has achieved some success in promoting sustainability beyond the walls of the office. One colleague comment that she “..hoped our efforts would effect those around us. The more people that get involved, the more things will improve”.
6) The perceived success/ failure of the program
WP’s drive towards sustainability is generally perceived to be successful by most employees (3.92). However, as noted above, the partners were slightly more reserved in expressing their satisfaction with the results. There were some notes of caution as some employees indicated that the firm should not try to “bite off more than it could chew”. One respondent indicated that “we should focus on what we are trying to do at the moment and do it well before pushing ahead further”.
7) Communication of WPs efforts
successful, the results for this section were the weakest in the survey (3.73). There was one strong comment complaining of too much internal communication, “…at times though to the point of distraction. Too many e-mails and too much material in conference rooms, lobby, storage spaces, and such”. As to whether the firm should promote its environmental focus to clients, 40 percent responded either “strongly disagree” “disagree” or “no opinion”. While many did agree with the question, in comparison with other questions, there was not such a strong level of agreement. Perhaps this would indicate that WP should take an indirect approach to promoting its activities externally (such as posting its sustainability metrics on its website), rather than directly and consciously communicating its environmental focus to clients.
Overall, the survey results indicate that WP has achieved a fair measure of success in creating a culture of sustainability. As suggested by Petts et al., these initiatives are driven by leadership with strong personal commitment to environmental issues. Our results also show that a general cohesiveness and consensus has emerged with regard to the firm’s efforts, which will be beneficial as it moves forward. However, it is possible that internal resistance will increase as projects become more ambitious and it is important that WP take appropriate steps to maintain and deepen that culture without provoking a backlash. Comments provided in the survey also point out that, while there is significant support for the program, efforts should be made to strengthen the legal practice and maintain both environmental and financial goals.
SECTION TWO: THE PHYSICAL SPHERE – QUANTIFIABLE METRICS
This section looks at WP’s efforts at energy and resource conservation and examines data
collected on physical metrics. More specifically, figures for electricity, gas and water use, as well as measurements of waste and recyclables are presented. While some preliminary sustainability
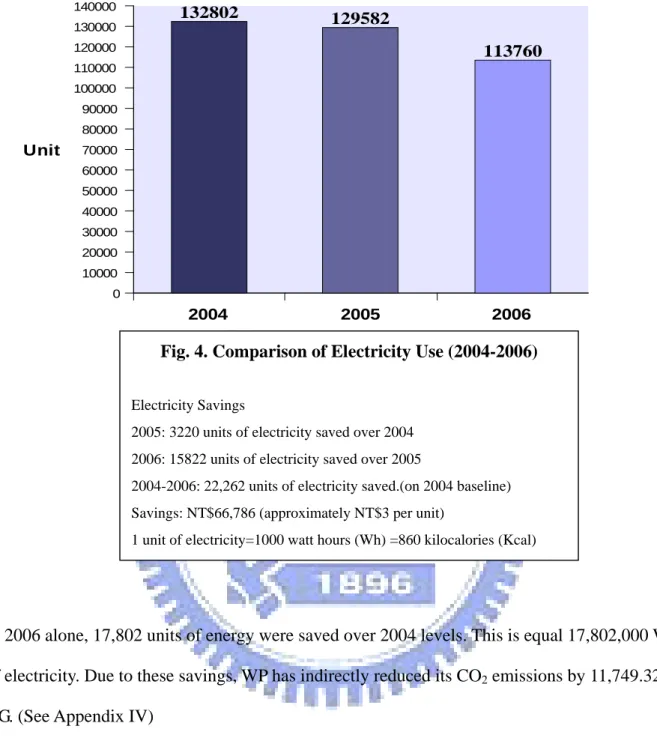
efforts began at the firm as early as 2002 when its offices were moved to its current location, substantial efforts were begun in 2004. Therefore, data collected in 2004 serves as a benchmark for comparison with 2005 and 2006 data. It should be noted that from 2004 -2006 there were no significant changes in office facilities or equipment that would affect energy or resource use. Also during this period the number of staff has fluctuated minimally, from 51 to 46 employees. In contrast, WP’s billed revenue in 2005 was 6% higher than the 2004 figure. Furthermore, the billed revenue for 2006 was a full 45% higher than the 2004, which shows an increasing trend of business volume over the study period. This background information should be considered when examining the results below.
ENERGY CONSERVATION AND EFFICIENCY ELECTRICITY
General
As recommended in the literature review, simple methods for cutting electricity use are
emphasized. Employees have been encouraged to cut down on electricity whenever possible by turning off lights, air conditioners, fans, computers at lunch, after work, or when they are away from their desk for an extended period of time.37 Responsible persons are assigned for each portion of the building to ensure that electrical items are not left on over night. Employees are encouraged to take the stairs instead of the elevator, both to promote exercise and save energy (especially in the cooler weather) and periodic emails provide reminders of ways to save energy. Staff are also encouraged to implement these measures at home as well (in the hopes of
expanding the overall effect).
Lighting
The building itself was chosen for its abundant natural light. All offices have large windows that let in light and walls into the central part of the building are also made of glass to allow as much natural light into the environment as possible. Shades were also installed to keep heat out during times of direct sunlight. As for lighting fixtures, the firm has been replacing any old incandescent light bulbs with new energy-saving bulbs.38 Also, fixtures that are not used, are purely d
or are simply unnecessary, have been removed.
ecorative
Air conditioning
Having a semi-tropical climate, the weather in Taiwan is hot and humid for much of the year. This is complicated by urban heat island effect39 as well as the fact that Taipei lies in a basin, which captures heat. Accordingly, a significant portion of energy use can be attributed to the use of air conditioning. The firm has struggled to find a balance between conservation and providing a comfortable work environment. First, air conditioners have been covered (using wood or bamboo) to avoid direct sunlight and increase efficiency. Second, employees are encouraged to dress appropriately for the weather. Suits and jackets are not required, unless for meetings with clients. Dress casual or even casual attire during the hot summer months is accepted. Because employees are dressed in a more appropriate manner, air conditioning is not activated until 28°C and cools to 26%.40 Employees are also encouraged to open windows on breezy days (the office is up high where the wind is stronger) or use electric fans, which use much less electricity than air conditioning. Air conditioning is also only turned on between 10am and 6pm. It should be noted that the survey found that some respondents found it difficult to work in the higher temperatures.
38
The life of fluorescent light bulbs is up to 6 times as long as that of incandescents, and use only 2/3 of the energy.
39
An Urban Heat Island is a metropolitan area that is significantly warmer than its surroundings. As population centers grow in size, they tend to have a corresponding increase in average temperature;
![TraditionalMLCalgorithmsmainlytacklethebatchMLCproblem,wheretheinputdataarepresentedinabatch[24,28].Nevertheless,inmanyMLCapplicationssuchase-mailcategorization[22],multi-labelexamplesarriveasastream.Onlineanalysisistherefore dimensionreducermotivatedbyma](data:image/gif;base64,R0lGODlhAQABAIAAAP///wAAACH5BAEAAAAALAAAAAABAAEAAAICRAEAOw==)