行政院國家科學委員會專題研究計畫 成果報告
預力建築構造耐震性能研究--子計畫:預力預鑄 RC 牆之耐
震性能研究(III)
研究成果報告(完整版)
計 畫 類 別 : 整合型 計 畫 編 號 : NSC 95-2625-Z-002-036- 執 行 期 間 : 95 年 08 月 01 日至 96 年 07 月 31 日 執 行 單 位 : 國立臺灣大學土木工程學系暨研究所 計 畫 主 持 人 : 黃世建 計畫參與人員: 博士班研究生-兼任助理:李翼安 報 告 附 件 : 出席國際會議研究心得報告及發表論文 處 理 方 式 : 本計畫可公開查詢中 華 民 國 96 年 11 月 05 日
行政院國家科學委員會補助專題研究計畫
█ 成 果 報 告
□期中進度報告
預力建築構造耐震性能研究-
子計畫
:預力預鑄 RC 牆之耐震性能研究(III)
計畫類別:□ 個別型計畫
█
整合型計畫
計畫編號:NSC 95-2625-Z-002-036
執行期間:95 年 8 月 1 日至 96 年 7 月 31 日
計畫主持人:黃世建
共同主持人:
計畫參與人員:李翼安
成果報告類型(依經費核定清單規定繳交):□精簡報告
█
完整報告
本成果報告包括以下應繳交之附件:
□赴國外出差或研習心得報告一份
□赴大陸地區出差或研習心得報告一份
█
出席國際學術會議心得報告及發表之論文各一份
□國際合作研究計畫國外研究報告書一份
處理方式:除產學合作研究計畫、提升產業技術及人才培育研究計畫、
列管計畫及下列情形者外,得立即公開查詢
□ 涉及專利或其他智慧財產權,□一年□二年後可公開查詢
執行單位:國立台灣大學土木工程系
中
華
民
國 96 年 10 月 31 日
預力預鑄
RC 牆之耐震性能研究(Ⅲ)
Seismic Performance of Precast Prestressed Concrete Walls
一
.中文摘要
在台灣預力預鑄工法逐漸的被運用在建築結構上,但卻沒有一套相關地規範或是相關之 研究成果,能使工程師更瞭解其行為,因此,若想對預力預鑄耐震結構系統作充分的瞭解, 先對結構桿件之力學行為作深入研究是必然的,本案文便針對預力預鑄RC 牆做研究,期望 能清楚地預力預鑄RC 牆之耐震性能。 本研究測試兩組試體,第一組試體為清楚地瞭解預力建築系統之鋼筋混凝土結構物中預 力預鑄 RC 牆之力學行為與預力預鑄 RC 牆於預力建築系統所造成的貢獻;第二組試體為利 用預力預鑄RC 牆牆版在界面接合處之變形,加裝位移型消能器-挫屈束制斜撐(BRB), 希望能清楚的瞭解消能器於預力預鑄RC 牆之角色與其所能提供之貢獻。 關鍵詞:預鑄、預力、挫屈束制斜撐Abstract
This study experimentally and analytically evaluates the response of unbounded post-tensioned precast concrete walls with horizontal joints under cyclic lateral load. A set of generalized closed-form expressions is derived to estimate base shear and lateral drift response values that define a tri-linear idealized base shear-lateral drift response curve for these walls under monotonic lateral load.
The experimental program consists of two tests under cyclic lateral load. The first specimen is the unbounded post-tensioned precast concrete wall without energy dissipating device. Test results let us distinctly know the limit states that characterize the lateral load response of the walls occur as anticipated. The second specimen is the unbounded post-tensioned precast concrete wall with energy dissipating device-Buckling Restrained Braced. Test results let us know the contribution in the walls provided by Buckling Restrained Braced.
Key words: precast, post-tensioned, Buckling Restrained Braced
二
.計畫緣由及目的
經歷過921 集集大地震後,我們發現許多的屋舍,無論是校舍或街屋,甚至是高樓都出 現嚴重的毀損,以至於無法修復,此皆因為一般之鋼筋混凝土或鋼結構耐震系統,面臨地震 力來臨時,主要是藉由其被束制接頭間之主要結構桿件產生非彈性變形來提供結構體消散地 震能量,造成結構桿件的受損,伴隨發生的殘餘變形(Residual Deformation)卻是修復時面 臨的嚴重問題;然而,一套有別於一般耐震結構系統缺失之新耐震結構系統,稱為自我復位 耐震結構系統(Self-Centering Earthquake Resistance Structural System)[1],此結構系統在設 計地震力下,擁有可消除地震力對耐震結構系統主要桿件損傷之能力,此套耐震系統運用其 主要桿件在界面接合處,有界面開口(gap opening)之行為,利用此項特性在界面接合處加 裝消能元件,提供此系統有足夠之韌性與消能能力,以利此系統之主要結構桿件不產生殘餘 變形及相關的損傷;此外,於結構系統上運用後拉預力(Post-tensioning)之技術,在地震力 消除時,預力桿件便將整體結構系統拉回原位,擁有自我復位的能力,因而得名;自我復位耐震結構系統在國外已有相當多的研究與實際興建案例,然而,自我復位耐震結構系統之主 要結構桿件,可為鋼結構或鋼筋混凝土結構,而本計畫將針對鋼筋混凝土桿件作研究,再加 上原本經常運用在橋梁的預力施工技術,形成一套新的營建工法-預力預鑄工法[2]。 預力預鑄工法乃所有營建工法中,最具自動化內涵的工法,在這科技日新月異的時代, 此一自動化的工法必能提升營建業的競爭力,然而,預力預鑄工法其優點在於,人力節省、 工期縮短、安全保障、產能提升等[3,4],這些預力預鑄工法的基本經濟效益,仍是我們今 日追求的目標。但隨著社會的轉變及技術的進步,今日的預力預鑄工法,不僅只有經濟的誘 因,在環境之保育和技術之必須性上,預力預鑄工法也是必然的趨勢。 預力預鑄工法在美國已行之有年,且廣泛地應用在一般建築物如停車場、醫院、圖書館、 高樓大廈、高科技廠房、辦公大樓、商業大樓等大跨度之結構體,更對預鑄耐震系統(PREcast Seismic Structural System;PRESSS)[5]做了許多的研究,根據這些研究成果也訂立相關的規 範,在台灣預力預鑄工法也逐漸的被運用在建築結構上,但卻沒有一套相關地規範或是相關 地研究成果,能使工程師更瞭解其行為,因此在訂立相關規範前,對預鑄耐震系統之行為作 研究,是相當迫切地;因此,若想對預力預鑄耐震結構系統作充分的瞭解,先對結構桿件之 力學行為作深入研究是必然的,預力預鑄梁柱接頭部分已有前人做出研究成果,故我們今年 研究重點為預力預鑄剪力牆,希望對結構桿件作通盤的瞭解,以利日後延續之研究。 在地震來臨時,耐震結構必須提供良好之消能機制,以利消散因地震輸入結構體之能 量,挫曲束制斜撐(Buckling Restrained Braced)[6]在許多主要的建築物中,都擔任結構系統 中重要的消能機制,然而,自我復位耐震結構系統之消能能力,相較於一般耐震結構系統是 較不理想的,故我們將挫曲束制斜撐(BRB)運用在預力預鑄剪力牆上,希望能增加其消能 能力並清楚地瞭解消能器於預力預鑄剪力牆之角色與其所能提供之貢獻。
三
.試驗規劃與結果之討論
本試驗之目的係針對水平接縫之預力預鑄鋼筋混凝土牆作測試,製作兩組試體,以未握 裹後拉式預力(unbonded post-tensioned)鋼棒將牆板接合,瞭解預力預鑄鋼筋混凝土剪力牆 之力學傳遞機制與耐震性能。在PRESSS 5 層樓預力預鑄構架之測試計畫中[7-11],預力預鑄 剪力牆需與梁及樓板作接合,但本試驗為求能清楚的瞭解預力預鑄鋼筋混凝土剪力牆之力學 傳遞機制及耐震性能,故不討論剪力牆、梁與樓板之接合傳力機制及相關問題,單純以剪力 牆為實驗對象。此次實驗準備兩組試體,第一組試體名稱為PTW,為預力預鑄鋼筋混凝土剪 力牆實驗之原型試體,如圖1 所示,第二組試體名稱為 PTWD,此組試體利用預力預鑄鋼筋 混凝土剪力牆之界面開口行為,加裝位移型消能器,挫屈束制斜撐(BRB),驗證消能器提 升牆體消能能力之多寡與貢獻,如圖2 所示。 原型試體(PTW)為不加裝消能器之預力預鑄鋼筋混凝土剪力牆,其試體之主要目的為 PTWD 試體之對照組,透過原型試體之試驗結果,可比較剪力牆與加裝消能器剪力牆之消能 能力,且有助於我們清楚地瞭解預力預鑄剪力牆之耐震行為。 本試體為水平接縫之預力預鑄剪力牆,故 PTW 試體為預鑄牆板沿水平界面組合而成, 組立完成圖,如圖1 所示,混凝土採用高強度混凝土,抗壓強度為 6000psi,預鑄牆板共分三 層,頂層、中層及底層三片牆板,其細部設計圖如圖 3、圖 4 所示,牆板之寬度、高度、厚 度分別為300cm、200cm、20cm,底層牆板因界面開口行為受較大之應力集中,且牆體無邊 界柱,故需於牆體兩側作圍束,底層牆板於牆體兩側以螺箍筋作圍束,圍束區長度為50cm、 寬度 16cm,圍束區內因圍束鋼筋比為 7.3%,採用#4 鋼筋,故共需六根螺箍筋重疊置入, 螺箍筋間距為5cm、長度 190cm、直徑 15cm,牆板內設置雙層雙向鋼筋網,並以#3 鋼筋組 成,間距20cm,且於牆體內部預埋旋楞鋼管,旋楞鋼管直徑 55mm、長度 200cm,於牆體內 之位置,如圖3 所示,而頂層及中層牆板因不易發生界面開口之行為,故不需圍束區來提高 混凝土之效能,因此牆體內只需設置鋼筋網及旋楞鋼管,其位置、尺寸、鋼筋號數皆與底層 牆板雷同,如圖4 所示。試體於牆體底部因預力建築系統有界面開口行為之特性,因此加裝位移型消能器-挫屈 束制斜撐(BRB),欲增加預力預鑄剪力牆之消能能力,因預力建築系統擁有自我復位之能 力,其結構消能能力會比一般建築結構較差,故增加消能器以期能夠增加結構之消能效果, 所以,試驗之第二組測試試體加裝消能器,有利於瞭解增加消能器後,消能器所能提供之貢 獻。PTWD 試體組立完成圖,如圖 2 所示,本試體與原型試體之配筋、混凝土強度、牆體尺 寸、細部設計皆與原型試體相同,唯一相異之處為底層牆板,如圖5 所示,於牆板兩側加裝 槽型鋼,採用 C200×90×8×13.5 之型鋼,加裝槽型鋼之目的為使牆板能與消能器銲接,使消 能器能因牆體受側推力作用之下,發揮消能效果。挫屈束制斜撐細部設計圖,如圖6 所示, 挫屈束制斜撐長度為120cm,主要消能段長度約為 60cm,斷面漸變段之曲率半徑為 30cm, 主受力元件與側撐元件斷面,如圖 6 所示,消能段斷面積為 30.24cm2,鋼材降伏強度為 2.5tonf/cm2。 本試驗之加載程序係由三支油壓千斤頂採同步位移控制,施載程序依Perez 於 2004 年發 表之論文[12]中,採用之加載程序,各階段之層間位移角依序為 0.05%、0.1%、0.25%、0.5 %、0.1%、1%、1.5%、2%、0.1%、3%,各做三個循環,共有 30 個循環,。 試體試驗結果之載重-位移遲滯迴圈關係曲線圖,如圖 7、圖 8 所示,預力鋼棒之初始預 力為 682kN,為 65%的鋼棒極限強度(Pu), 圖 7 為 PTW 試體試驗之載重-位移遲滯迴圈 關係曲線,其中最大之靜態側推力為1381.1kN,且由圖 9 中之實驗包絡線可發現,於層間變 位角為2%之後,試體所承受之側推力有些許下滑,並非如 Perez 之研究[12]所假設之理想狀 況,忽略預力鋼棒之應變硬化,圖 8 為 PTWD 試體試驗之載重-位移遲滯迴圈關係曲線,其 中最大之靜態側推力為1519kN,且由圖 9 中之實驗包絡線可發現,於層間變位角為 1%之後, 試體所承受之側推力已有下滑之現象,其原因來自於底層剪力牆版與消能器連接之槽鋼,因 設計不良,造成槽鋼與牆版分離,如圖10 所示,無法使消能器繼續發揮其消能之功用;PTWD 試體不同於 PTW 試體,試驗進行至層間變位角為 3%時,即發生破壞,PTWD 試體完成反 覆載重 30 個循環,其可能之因素為脫離之消能器,雖已無作用,但在牆體受壓側,牆版仍 會繼續使消能器受壓,分擔混凝土於壓力區所承受之壓力,故混凝土不會發生脆性破壞,完 成實驗程序。 預力預鑄剪力牆之分析模型,我們已於上一年度計畫提及,本年度我們將提出預力預鑄 剪力牆加裝消能器之分析模型,此分析模型共分為五個階段:減壓階段、消能器降伏階段、 軟化階段、預力鋼棒降伏階段、圍束混凝土壓碎階段,根據此一分析模型,針對PTWD 試體 分析而得之分析曲線,如圖11 所示,圖中之綠線為分析獲得之曲線,紅線為試驗之包絡線, 我們可以清楚地發現,PTWD 試體之分析預測曲線與試驗之包絡線,有相當程度的吻合,其 差異來自於連接消能器之槽鋼設計不良,致使實驗並無法完全驗證分析模型,但此分析模型 仍有相當準確度。
四
.結論
本年度之研究主要目的為,提出預力預鑄剪力牆加裝消能器之分析模型,但因試驗試體 設計不良之故,並無法完全驗證分析模型之正確與否,但依目前之實驗數據來看,仍具有相 當的準確度,故預力預鑄剪力牆加裝消能器之分析模型已在本研究得到相當不錯之成果,惟 須再增加實驗數據來驗證分析模型。五
.參考文獻
[1] Sause, R., Pessiki, S. P., Ricles, J. M., “Self-Centering Earthquake-Resistant Structural System,” KEERC International Seminar on Innovative Concepts and Technologies in Seismic Analysis and Design of Building Structures, Seoul, Korea, February, pp.41-51, 2005.
[2] 黃世建,(1997) 「預鑄混凝土在公共公程之現況與展望」,財團法人台灣營建研究院,
[3] 楊錦懷,沈進發,黃世建,「大型預鑄混凝土組件在國內推廣應用之研究」,經濟部工 業局八十年度專案計畫執行成果報告,台北,1991 年 4 月,272 頁。
[4] 億承工程公司,「積層工法」,台北,1990 年。
[5] Priestley, M.J.N.(Editor). Third Meeting of the U.S.- Japan Joint Technical Coordinating Committee on Precast Seismic Structural Systems ( JTCC- PRESS), Report No.92/05, November 1992, 530 pp.
[6] 王錦華,「韌性斜撐構材之力學行為及韌性同心斜撐系統之耐震性能」,國立台灣科技 大學營建研究所,博士論文,台北,民國九十一年。
[7] Nakaki, S. D., Stanton, J. F., and Sritharan, S., “An Overview of the PRESSS Five-Story Precast Test Building,” PCI Journal, V. 44, No. 2, March- April 1999, pp. 26-39.
[8] Priestly, M. J. N., and Tao, J. T., “Seismic Response of Precast Prestressed Concrete Frames with Partially Debonded Tendons,” PCI Journal, V. 38, No. 1, January- February 1993, pp. 58-69.
[9] Conley, J., Priestly, M. J. N., and Sritharan, S., “Wall Direction Modeling of the Five-Story PRESSS Precast Test Building,” Report SSRP 99/19, University of California, San Diego, CA, 1999.
[10] Pampanin, S., Priestly, M. J. N., and Sritharan, S., “Frame Direction Modeling of the Five-Story PRESSS Precast Test Building,” Report SSRP 99/20, University of California, San Diego, CA, 1999.
[11] Priestly, M. J. N., Sritharan, S., J. R. Conley, and S. Pampanin. (1999). “preliminary results and conclusions from the PRESSS Five-Story PRESSS Precast Test Building,” PCI Journal, V. 44, No. 44, pp. 42-67.
[12] Perez, F. J., “Experimental and Analytical Lateral Load Response of Unbonded Post-Tensioned Precast Concrete Walls” Ph.D. Dissertation, Department of Civil and Environmental Engineering, Lehigh University, Bethlehem, PA, 2004.
圖 1 PTW 試體 圖 2 PTWD 試體
21 6 132 60 60 12 圖5 加裝槽型鋼之底層牆版 圖 6 BRB 細部設計圖 Displacement(mm) Lat eral Force( kN ) Drift ratio(%) -180 -120 -60 0 60 120 180 -2000 -1500 -1000 -500 0 500 1000 1500 2000 -3 -2 -1 0 1 2 3 -2000 -1500 -1000 -500 0 500 1000 1500 2000 Lat eral Force (k N ) 圖7 PTW 試體遲滯迴圈 圖 8 PTWD 試體遲滯迴圈 Displacement(mm) Lat eral Force( kN ) Drift ratio(%) -180 -120 -60 0 60 120 180 -2000 -1500 -1000 -500 0 500 1000 1500 2000 -3 -2 -1 0 1 2 3 -2000 -1500 -1000 -500 0 500 1000 1500 2000 Lat eral Force (k N ) 圖 9 PTW 試體實驗包絡線 圖 10 PTWD 試體實驗包絡線 圖10 PTWD 試體消能器與牆版分離圖 圖 11 PTWD 試體試驗結果與分析模型之比較
出席國際學術會議心得報告
計畫編號 NSC 95-2625-Z-002-036 計畫名稱 預力建築構造耐震性能研究-子計畫:預力預鑄 RC 牆之耐震性能研究(III) 出國人員姓名 服務機關及職稱 國立台灣大學土木工程系 黃世建教授 會議時間地點 時間:2006 年 12 月 4 日至 5 日;地點:日本名古屋 會議名稱 第八屆台灣-韓國-日本建築結構地震工程聯合研討會發表論文題目 Prediction of Ultimate Strength and Deflection of Double-Curvature Low Rise Shear Walls
一、 會議簡介與參加會議經過
台灣-韓國-日本建築結構地震工程聯合研討會(Taiwan-Korea-Japan Joint
Seminar on Earthquake Engineering for Building Structures)創始國家為韓國與日
本,主要想增加從事建築地震工程方面研究之年輕學者,彼此間之學術交流。
因而本研討會之特色有二,一是研討議題皆為有關建築結構耐震工程研究及技
術;二是所有論文發表者皆為受邀講員,且大部分都是年輕之學者專家。首屆
於
1999 年在韓國舉行,第二屆於 2000 年在日本舉行,此兩屆規模大概都是每
個國家有
10 篇邀請論文發表。此外,在第二屆會議中,除了日、韓共 20 篇文
章發表外,國內台大土木系蔡克銓教授及報告人並受邀發表特邀演講(Keynote
lecture)。同時於該屆會議中,台灣也正式受邀加入此一聯合研討會,而第三屆
即由我國主辦。此會議預訂每年舉辦一次,輪流在日本、韓國及台灣舉行。本
屆(第八屆)則輪到日本舉行。
本 次 會 議 為 第 八 屆 台 灣
- 韓 國 - 日 本 建 築 結 構 地 震 工 程 聯 合 研 討 會
(
Taiwan-Korea-Japan Joint Seminar on Earthquake Engineering for Building
Structures),在日本名古屋舉行,時間為 2006 年 12 月 4 日至 5 日。共有來自 3
個國家的參與,舉辦了
6 場發表會;論文集收錄 30 篇論文,全部皆為現場發表
的文章。
12 月 4 號早上於簡單的開幕式後,隨即進行論文發表與討論。每篇文章報
告時間為
15 分鐘,問題討論時間為 5 分鐘。報告人發表論文的題目為 Prediction
of Ultimate Strength and Deflection of Double-Curvature Low Rise Shear Walls,其
被分配於主題為
Columns and Shear Wall 之 C 時段中,約在 12 月 4 日下午 3 時
左右。所發表之論文如附錄所示。
二、 與會心得
所有的報告都非常精彩,而更難能可貴的是問題討論也非常熱絡,幾乎時
間上都不敷使用。此外,全部與會者都共聚一室,有充分討論的機會,得以增
進不少友誼。
另一方面,藉由三國聯合學術研討會之舉行,可以提升我國在建築結構地
震工程方面之研究水準,促進防震科技的進步與交流。再者,此研討會提供年
輕學者間一絕佳切磋之機會,往後並可建立彼此研究單位間之合作關係,對學
術研究成果之提昇,足以有相當之影響。
三、 誌謝與建議
本次會議承蒙國科會經費贊助,才得以順利成行。
本研討會基本上是定位於交流研討,而確實也達到此目標。然而討論踴躍,
問題討論時間常常不夠,建議應可延長此部分時間。
四、 攜回資料名稱及內容
本次攜回資料主要為論文集。
附錄:
發表之論文:
Prediction of ultimate strength and deflection of
double-curvature low rise shear walls
Ika Bali1 and Shyh-Jiann Hwang2
Abstract
This study elucidates the prediction of ultimate strength and corresponding deflection of low rise shear walls subjected to lateral load. The scope of the study is limited to low-rise shear walls with height to length ratios not exceeding two, and walls due to lateral load are deformed in a shape of double-curvature. This study is based on limited knowledge of the shear behavior of low-rise shear walls subjected to double-curvature bending. In this study, the wall shear behavior as the ultimate shear strength and corresponding deflection of walls is predicted according to the softened strut-and-tie model. Moreover, the corresponding lateral deflection of walls is estimated by superposition of its flexibility sources such as flexural, shear and slip. Theoretical analyses reveal that the calculated results of the proposed procedure correlate reasonably with previously reported experimental results.
Keywords: reinforced concrete; double-curvature; low-rise; shear wall; strength; deflection; strut;
tie.
1. Introduction
The seismic-resistant structural systems of reinforced concrete structural buildings generally use either moment resisting space frames, shear walls or a combination of both. However, shear wall systems exhibit better performance than space frame systems do (Fintel 1991).
Shear walls, which are used in lateral force resisting systems, can exhibit either ductile or non-ductile behavior. The ductile shear walls develop a flexural-ductile mode of failure if a severe earthquake occurs, while the non-ductile shear walls exhibit a shear mode of failure.
The non-ductile behavior of shear walls makes them appropriate for low-rise buildings due to
1 Lecturer, Dept. of Civil Eng., Universitas Kristen Indonesia (Christian University of Indonesia), Jakarta, Indonesia
13630.
PhD Candidate, Dept. of Constr. Eng., National Taiwan Univ. of Science and Technology, Taipei, Taiwan 10672, ROC.
2 Professor, Dept. of Civil Eng., National Taiwan University, Taipei, Taiwan 10617, ROC.
their efficiency and economy. Shear walls are thus extensively applied for low-rise buildings in the form of reinforced concrete squat walls, which have height to length ratios not exceeding 2. The predominant action of such walls is shear, and the flexural yielding is practically limited.
Shear behavior of reinforced concrete squat walls subjected to single-curvature bending can be reasonably predicted using the softened strut-and-tie (SST) Model (Hwang et al. 2001, Yu and Hwang 2005, Tu 2005, and Tu et al. 2006). Based on that knowledge, this study elucidates the shear behavior of double-curvature squat walls.
This study considers the potential deformation of squat walls in real structures due to the lateral load is possibly deformed in a double-curvature. This deformation could occur for squat wall with fixed end support and large floor at the top of wall. This study is motivated by limited knowledge of the shear behavior of reinforced concrete squat walls subjected to double-curvature bending.
This study develops a model of double-curvature wall for predicting the shear strength and corresponding deflection of double-curvature reinforced concrete squat walls. The shear strength and corresponding deflection of walls are predicted using the SST model (Hwang et al. 2001, Hwang and Lee 2002, Tu 2005, and Tu et al. 2006). This study estimates the corresponding lateral deflection of walls using superposition of its flexibility sources such as flexural, shear and slip (Sozen et al. 1992).
2. Research Significance
This study provides a feasible model for determining the shear strength and corresponding deflection for reinforced concrete squat walls subjected to double-curvature bending. The proposed method gives important insight into the behavior of double-curvature walls that exhibit shear failure.
3. Double curvature wall
Walls in real condition of low-rise buildings may deform in a double-curvature shape if the wall stiffness is relatively lower than the base and floor stiffness.
Hidalgo et al. (2002) and Lopes (1991) simulated a double-curvature bending by testing wall specimens in experimental conditions designed to prevent the rotation of both the top and bottom ends of the specimen. Based on this condition, analytical modeling of the double-curvature wall is described as follows.
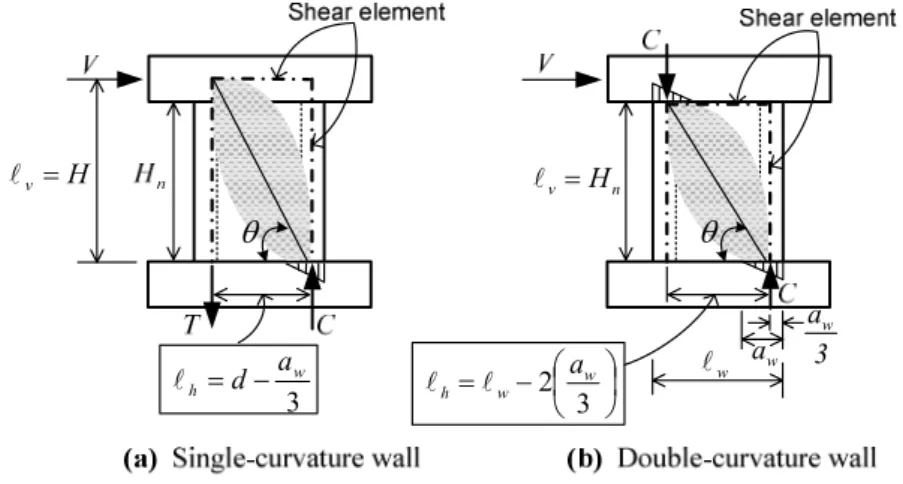
It is different in modeling the shear behaviors of single and double-curvature walls. The major difference in modeling the single and double-curvature walls that is proposed in this study is to define shear element of the walls. The shear element of a wall has height l , and length v l h (Fig.1).
et al. 2006), a shear element is proposed has lv = H, where H is the distance measured from the center of top beam to the wall base, and l is defined as the horizontal distance measured from the h point of tension force to the point of compression force of the wall (Fig. 1(a)).
For double-curvature wall specimens, the top beam of walls is large and set up as a fixed support; therefore, it could be assumed as a rigid beam. In this case, instead of
H v= l θ θ n v=H l w a 3 aw w l − = 3 2 w w h a l l 3 w h a d− = l
Fig. 1. Shear element of walls
the center of top beam, which is usually used in single-curvature walls, shear friction between the top beam and the wall panel could be adopted as the ceiling of the shear element of double-curvature walls. Hence, the height of shear element l for a double-curvature wall is v assumed to be the clear height of the wall panel, H . The n l for double-curvature walls could h be estimated as the horizontal distance measured between the points of compressive force at the top and bottom wall (Fig. 1(b)) due to the assumption that the concentrated flow of stresses along the diagonal strut will end at the point of compressive force.
Considering the above assumptions for the shear element, the inclination angle of the diagonal strut for double-curvature squat walls can be defined as:
= − h v l l 1 tan θ (1)
where lv =Hn, lh = lw−2
(
aw 3)
; l denotes the length of the entire wall in direction of shear w force, and aw is the distance from the extreme compression fiber to the neutral axis when the flexural moment reaches the yielding moment (My).For the case of single-curvature walls (Hwang et al. 2001, Yu and Hwang 2005, Tu 2005, and Tu et al. 2006), the angle of inclination of the diagonal strut with respect to the horizontal axis h is defined as tan 1( / )
h H l − =
compression fiber to center of force of all reinforcements in tension.
4. Prediction of strength
The prediction method of strength and corresponding deflection of wall must generally agree with the measured strength and corresponding deflection of wall and fit the observed failure mode. This study defines the ultimate strength of reinforced concrete squat walls as the minimum flexural and shear strength as given by
u
V = min (Vf,Vs) (2)
where Vu is the ultimate strength of the wall, and Vf and Vs denote the flexural and shear strengths of the walls, respectively.
The flexural strength of the wall caused by double curvature bending can be calculated as,
n b t f H M M V = + (3) where Mt and Mb is the flexural moment at the top and bottom of walls, respectively.
Based on the fully cracked assumption of the wall shear element, the shear strength Vs can be predicted using the simplified version of the softened strut-and-tie model (Hwang and Lee 2002). Fig. 2 shows the strut-and-tie modeling for the cracked double-curvature RC squat wall. The forming of the softened strut-and-tie action can be explained as follows.
h r v d θ H h F Dv F θ h l w a a3w n v=H l Fig. 2. Strut-and-tie modeling for cracked wall
After the development of the cracking pattern in the wall, the steel bars are subjected to tension, and the concrete acts as a compressive strut, thus forming a strut-and-tie action. Shear failure of the wall occurs when the concentrated flow of stresses along the diagonal strut surpasses the compressive capacity of the cracked reinforced concrete in the panel. The influence of the softened effect on concrete is thus considered for the concrete strength (Vecchio and Collins 1993, Zhang and Hsu 1998). This model is called the softened strut-and-tie model, since it considers the
softening effect, which weakens the concrete strength. The main procedures of the SST model for predicting the shear strength are described as below.
The shear strength of reinforced concrete squat walls failing in diagonal compressions can be estimated as (Hwang and Lee 2002)
θ ζ ' cos str c s K f A V = (4)
where K is the strut-and-tie index andK =(Kh +Kv −1), Astr is the effective area of the diagonal strut, and the softening coefficient ζ is approximated as (Hwang and Lee 2002)
52 . 0 35 . 3 ≤ ′ ≈ c f ζ (5)
where f ′c is the compressive strength of a standard concrete cylinder in units of MPa. The horizontal tie index Kh is expressed as
h h yh th h h K F f A K K =1+( −1) ≤ (6)
where A is the area of the horizontal tie, th fyh represents the yield strength of horizontal reinforcement, and K is the horizontal tie index with sufficient horizontal reinforcement, and can h
be estimated as ) ( 2 . 0 1 1 2 h h h K γ γ + − ≈ (7)
where γh is the fraction of diagonal compression carried by the horizontal tie in the absence of the vertical tie, and is defined as (CEB-FIP Model Code 1990, 1993)
3 1 tan 2 − = θ γh for 0≤γh ≤1 (8) h
F is the balanced amount of the horizontal tie force, and is given by θ
ζ
γ (K f A ) cos
Fh = h × h c′ str × (9)
The equations relating to the vertical tie index K are the same as Eqs. (6) to (9), except that v each subscript h is replaced by v, and cosθ and sinθ are interchanged.
The effective area of the diagonal strut Astr is defined as
w w
str a t
A = × (10)
5. Prediction of deflection
In this study, the ultimate lateral deflection of wall is defined as the superposition of the flexibility sources of shear, flexure, and slip:
slip f s
u δ δ δ
δ = + + (11)
where δu is the ultimate lateral deflection of the wall along the axis of the horizontal load, and δs, f
δ and δ are the wall deflections due to shear, flexure and slip, respectively. slip
The shear deflection of wall is estimated by assuming that the wall panel is subjected to uniform shear strain (Hsu 1993), and is expressed as
n vh
s γ H
δ = (12)
where γvh is the average shear strain in the wall panel. The estimation of γvh for the cracked reinforced concrete panel is based on the softened strut-and-tie model, and is described as below.
The average strains of a cracked wall panel as postulated by the SST model are assumed to meet the requirements of Mohr’s compatibility (Hsu 1993). To fulfill the requirements, the average shear strain in the v- and h-coordinate system γvh is expressed as
θ θ ε ε
γvh =2( r− d)sin cos (13)
where εr and εd are the average principal strains in the r- and d-directions, respectively (positive for tension).
Since the sum of the normal strains in the perpendicular direction is a constant, this compatibility condition requires
d v h
r ε ε ε
ε = + − (14)
where εh and εv are the average strains in the h- and v-directions, respectively (positive for tension). These strains can be obtained from the tension forces in the horizontal and vertical ties, and suggested not greater than the yielding strain. This limitation should be set to these strains to avoid the overestimation of the softening of the concrete (Vecchio and Collins 1993). So, the εh and εv are defined as
y s th h h E A F ε ε = ≤ (15) y s tv v v E A F ε ε = ≤ (16)
where F and h F are the tension forces of the horizontal and vertical ties, respectively, v A is tv the area of the vertical tie, E is the modulus of elasticity of steel bar, and s ε is the yield strain y of steel bar.
The tension tie forces at ultimate load can be determined according to their relative stiffness ratios (Hwang and Lee 2002).
u h h RV F = (17) θ tan u v v RV F = (18)
where R and h R are the wall shear ratios resisted by the horizontal and vertical mechanisms, v respectively, obtained as v h v h h R γ γ γ γ − − = 1 ) 1 ( (19) v h h v v R γ γ γ γ − − = 1 ) 1 ( (20)
where γv is the fraction of diagonal compression carried by the vertical tie in the absence of the horizontal tie.
The values of εd should be determined from the softened laws of cracked concrete. According to Zhang and Hsu (1998), the maximum strength of the softened concrete ζf ′c occurs at the strain of ζεo . Thus, the value of εd associated with the ultimate deflection δu is approximated as
0 ζε
ε =
− d (21)
where ε0 is the concrete cylinder strain corresponding to the cylinder strength f ′ . c
For the flexural and slip deflections, since the expected failure mode of the walls is shear failure, hence this study assumes the flexural and slip deflections are within elastic range.
The flexural deflection of the wall, resulting from double curvature bending can be described as follows.
Considering the wall with fixed end support at the bottom, and subjected to lateral displacement and rotation at the top of wall, the flexural lateral deflection of the wall in term of M and t M b can be solved as,
) 2 ( 6 2 t b e c n f E I M M H − = δ (22)
where E is the modulus of elasticity of concrete (c = 4700 f ′c ), I is the effective moment of e inertia of the wall section, and assumed as Ie =0.35Ig (ACI 318-05), and Ig is the moment of inertia of the gross concrete section.
From the relationship between clear height H , flexural moment at the top and bottom walls n
t n u t V H M = , (23) b n u b V H M = , (24)
where Hn,t is the distance from inflection point to the bottom of top beam, and can be described as
n b t t t n M M M H
H , =( /( + )) , and Hn,b is the distance from inflection point to the wall base, and can be expressed as Hn,t =(Mb/(Mt +Mb))Hn.
Substituting Eqs. (23) and (24) into Eq. (22), the flexural lateral deflection can be expressed in terms of Hn,t and Hn,b, that is
) 2 ( 6 , , 2 t n b n e c n u f E I H H H V − = δ (25)
Eq. (25) yields the flexural lateral deflection caused by shifting of the bending inflection point in double-curvature walls.
Slip deflection of the wall, resulting from double-curvature bending, is defined as the sum of the slip deflections of the top and bottom wall (Sezen 2000), and can be expressed as
b n b slip t n t slip slip θ ,H , θ , H , δ = + (26)
where θslip,t and θslip,b are the slip rotation at the top and bottom of the walls, respectively.
The slip rotation of the wall within the elastic area where the stresses of steel bars fs ≤ fy can be estimated as (Sezen 2000) u f db s slip 8 φ θ = (27)
where d is the diameter of the outmost of tension steel bar, b f is the stress of steel bar when s V u occurs, u is average bond stress, assumed herein as '
c f
u= , and φ is the curvature of wall section, and calculated as φ =εs (do −c). In this equation, εs denotes the strain of the outmost tension steel bar, d represents the distance from extreme compression fiber to the center of the o outmost tension steel bar, and c is the distance from extreme compression fiber to the neutral axis.
A total of 19 test specimens of shear walls with a height-to-length ratio not exceeding two that available in the technical literature were used to verify the prediction of the model. There are Lopes (1991) and Hidalgo et al. (2002). The specimens were selected to satisfy the following conditions: (1) the test specimen must be a wall with double-curvature bending; (2) the test specimen must fail in the wall panel shear mode; (3) the test specimen must be a one-story isolated wall with a height-to-length ratio of less than two; (4) the specimen must contain both horizontal and vertical reinforcement uniformly distributed through the wall panel.
The specimens used in this study, as reported in the literature, have the shift of bending inflection point from the mid-height to upper beam of walls. The distance from the inflection point to the bottom of the top beam in the specimens of Lopes (1991) was Hn,t =0.42Hn. The shift of bending inflection point in the specimens of Hidalgo et al. (2002) was very small, therefore
t n
H , can be taken as 0.5Hn.
The prediction of failure mode of the specimens is shear failure. This prediction agrees with the experimental failure mode of the specimens in this study.
6.1
Experimental verification for Lopes’ specimens
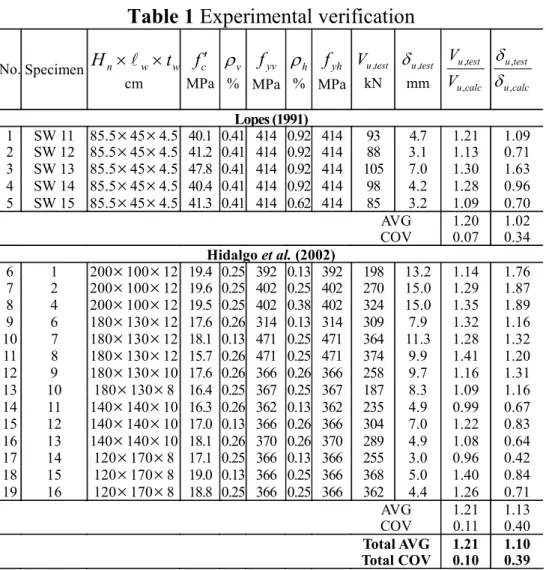
The accuracy of the proposed model was verified as the ratios of the measured to the calculated values. Table 1 shows the reasonable shear strength predictions for the proposed model of walls. For the specimen SW11 to SW15, the average test-to-calculated strength ratio for the specimens was 1.20, and the coefficient of variation (COV) was 0.07 (Table 1). To verify the corresponding deflection at the ultimate shear strength, the average test-to-calculated deflection ratio for the specimens was 1.02, and the COV was 0.34 (Table 1). The above explanation indicates that the calculated results of the proposed method have reasonable correlation with the measured results.
Table 1 Experimental verification
No. Specimen Hn × lw×tw cm c f ′ MPa v ρ % yv f MPa h ρ % yh f MPa test u V , kN test u, δ mm ucalc test u V V , , calc u test u , , δ δ Lopes (1991) 1 SW 11 85.5×45×4.5 40.1 0.41 414 0.92 414 93 4.7 1.21 1.09 2 SW 12 85.5×45×4.5 41.2 0.41 414 0.92 414 88 3.1 1.13 0.71 3 SW 13 85.5×45×4.5 47.8 0.41 414 0.92 414 105 7.0 1.30 1.63 4 SW 14 85.5×45×4.5 40.4 0.41 414 0.92 414 98 4.2 1.28 0.96 5 SW 15 85.5×45×4.5 41.3 0.41 414 0.62 414 85 3.2 1.09 0.70 AVG 1.20 1.02 COV 0.07 0.34 Hidalgo et al. (2002) 6 1 200×100×12 19.4 0.25 392 0.13 392 198 13.2 1.14 1.76 7 2 200×100×12 19.6 0.25 402 0.25 402 270 15.0 1.29 1.87 8 4 200×100×12 19.5 0.25 402 0.38 402 324 15.0 1.35 1.89 9 6 180×130×12 17.6 0.26 314 0.13 314 309 7.9 1.32 1.16 10 7 180×130×12 18.1 0.13 471 0.25 471 364 11.3 1.28 1.32 11 8 180×130×12 15.7 0.26 471 0.25 471 374 9.9 1.41 1.20 12 9 180×130×10 17.6 0.26 366 0.26 366 258 9.7 1.16 1.31 13 10 180×130×8 16.4 0.25 367 0.25 367 187 8.3 1.09 1.16 14 11 140×140×10 16.3 0.26 362 0.13 362 235 4.9 0.99 0.67 15 12 140×140×10 17.0 0.13 366 0.26 366 304 7.0 1.22 0.83 16 13 140×140×10 18.1 0.26 370 0.26 370 289 4.9 1.08 0.64 17 14 120×170×8 17.1 0.25 366 0.13 366 255 3.0 0.96 0.42 18 15 120×170×8 19.0 0.13 366 0.25 366 368 5.0 1.40 0.84 19 16 120×170×8 18.8 0.25 366 0.25 366 362 4.4 1.26 0.71 AVG 1.21 1.13 COV 0.11 0.40 Total AVG 1.21 1.10 Total COV 0.10 0.396.2
Experimental verification for Hidalgo et al.’s specimens
Table 1 shows a reasonable prediction of shear strength for the specimens 1 to 16. For those specimens, the average test-to-calculated strength ratio was 1.21, and the COV was 0.11. The deflection verification indicates that the average test-to-calculated deflection ratio for the specimens was 1.13, and the COV was 0.40. The mean value of deflection ratio is reasonably well, however the value of COV is considerable large.
6.3
Case study of single curvature versus double curvature
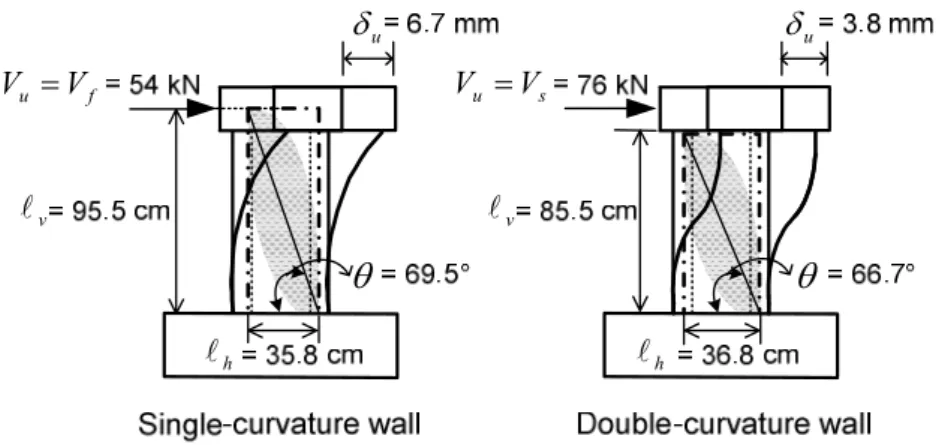
Specimen SW 11 (Lopes 1991) was selected for the case study of comparison of single-curvature and double-curvature walls. In this case study, specimen SW 11 was calculated by using the single and the double-curvature approaches. Comparison of these two approaches is described as follows. Fig. 3 compares the single and double curvatures for the specimen SW11, which had a large Hn /lw ratio of 1.9. As indicated in Fig. 3, the single-curvature wall had a slender shear element, while the double-curvature wall had a slight stocky shear element. Consequently, the inclination angle of the diagonal strut for the double-curvature wall, θ = 66.7°,
was smaller than that of the single-curvature wall, at θ = 69.5°. Because the calculated ultimate shear strength is proportional to the value of cosθ, the calculated ultimate shear strength of double-curvature wall was greater than the calculated shear strength of the single-curvature wall, as shown in Fig. 4. The difference between the calculated shear strengths of the single and double-curvature walls was around 13%. Due to the curvature bending, the calculated flexural strength of the double-curvature wall was 123% of that of the single-curvature wall. In this case study, the failure modes for the single and the double-curvature walls were flexure and shear failures, respectively.
For the contribution of flexibility sources, Fig. 5 indicates the calculated flexural deflection of single-curvature was about four times of the calculated flexural deflection of double curvature. The reason is that deformation is easier to perform in single-curvature bending than in double-curvature bending. In the case of single-curvature bending, the dominant failure mode is flexure. Due to this failure mode, the shear force of single-curvature wall can not reach its maximum value, and its shear deflection contribution is therefore lower than that of the double-curvature wall. As demonstrated in Fig. 5, the shear deflection of single-curvature wall was 23% less than that of the shear deflection of double-curvature wall. For the slip deflection contribution, due to the curvature bending, the slip deflection of the single-curvature wall was 45% of that of the double-curvature wall. The above comparison of the single and double curvatures reveals that the shift from double-curvature to single-curvature approach increases the contribution of flexural deflection, and decreases the contribution of shear deflection.
h l θ θ f u V V = u δ h l v l lv u δ s u V V =
0 50 100 150 Shear Flexure n t n H H /, 0 0.5 SW11 (Lopes 1991) Ca lc ul at ed s tre ng th (k N) Single curvature Double curvature H /n,t Hn
Fig. 4. Comparison of strength Fig. 5. Comparison of deflection
7. Conclusions
This study presents a model of shear strength and corresponding deflection prediction of reinforced concrete squat walls subjected to double-curvature bending. A comparison of the proposed model with the available test results that reported in the literature gives the following conclusions:
1. The ultimate shear strength and the corresponding deflection of low-rise shear walls can be predicted by using the softened strut-and-tie model.
2. The corresponding lateral deflection of walls can be estimated by superposition of its flexibility sources such as shear, flexure and slip.
3. The calculated results of the proposed procedure correlated reasonably with the experimental results in terms of the prediction of failure mode, and the ultimate shear strength and the corresponding deflection.
4. In wall specimens with height to width ratio close to 2, double-curvature bending can enhance the strength but reduce the deflection of the wall as compared to the single-curvature bending values.
Acknowledgments
The authors are grateful to Church Development Service - An Association of the Protestant Churches in Germany (EED) for the scholarship that make this study could be conducted. The authors also gratefully acknowledge the funding supports of the National Center for Research on Earthquake Engineering of the Republic of China and the National Taiwan University of Science and Technology, as well as the valuable contributions of Professor Yaw-Shen Tu of De Lin Institute of Technology, Taipei, Taiwan, Republic of China.
American Concrete Institute (ACI) Committee 318 (2005), Building Code Requirements for Structural Concrete, ACI 318-05, Farmington Hills, Michigan.
Comité Euro-Internation du Beton (CEB)-Fédération International de La Precontrainte (FIP) (1993), Model Code 1990, 1993, (MC90), Thomas Telford, London.
Fintel, M. (1991). “Shearwalls – An Answer for Seismic Resistance?” Concrete International, ACI, 13(7), 48-53.
Hidalgo, P. A., Ledezma, C. A., and Jordan, R. M. (2002), “Seismic Behavior of Squat Reinforced Concrete Shear Walls,” Earthquake Spectra, 18(2), 287-308.
Hsu, T. T. C., (1993), “Unified Theory of Reinforced Concrete,” CRC Press, Inc., Boca Raton, Florida, 313pp.
Hwang, S. J., Fang, W. H., Lee, H. J., and Yu, H. W. (2001), “Analytical Model for Predicting Shear Strengths of Squat Walls,” J. Struct. Eng., ASCE, 127(1), 43-50.
Hwang, S. J., and Lee, H. J. (2002), “Strength Prediction for Discontinuity Regions by Softened Strut-and-Tie Model,” J. Struct. Eng., ASCE, 128(12), 1519-1526.
Lopes, M. M. P. S. (1991), “Seismic Behavior of Reinforced Concrete Walls with Low Shear Ratio,” PhD Thesis, Civil Engineering Department, University of London.
Sezen, H. (2000), “Seismic Behavior and Modeling of Reinforced Concrete Building Columns,” PhD Dissertation, Department of Civil and Environmental Engineering, University of California, Berkeley.
Sozen, M. A., Monteiro, P., Moehle, J. P., and Tang, H. T. (1992), “Effects of Cracking and Age on Stiffness Reinforced Concrete Walls Resisting in-Plane Shear,” A Proceeding of the Fourth Symposium on Nuclear Power Plant Structures, Equipment, and Piping, North Carolina State University, Raleigh, NC, December, pp. 3.1-3.13.
Tu, Y. S. (2005), “An Analytical Study of the Lateral Load-Deflection Responses of Low Rise RC Walls and Frames,” PhD Dissertation, Department of Construction Engineering, National Taiwan University of Science and Technology, Taipei, Taiwan (in Chinese).
Tu, Y. S., Hwang, S. J., and Yu, H. W. (2006), “Prediction of Load Deflection Responses of Low Rise Shear Walls,” The Eight U.S. National Conference on Earthquake Engineering (8NCEE), San Francisco, April.
Vecchio, F. J., and Collins, M. P. (1993) “Compression response of cracked reinforced concrete,” J. Struct. Eng., ASCE, 119(12), 3590-3610.
Yu, H. W. and Hwang, S. J. (2005), “Evaluation of Softened Truss Model for Strength Prediction of Reinforced Concrete Squat Walls,” J. Eng. Mechanics, ASCE, 131(8), 839-846.
Zhang, L. X. B., and Hsu, T. T. C. (1998). “Behavior and Analysis of 100 MPa Concrete Membrane Elements,” J. Struct. Eng., ASCE, 124(1), 24-34.