國 立 交 通 大 學
顯示科技研究所
碩 士 論 文
製作具灰階及低色彩偏移之膽固醇液晶顯示器
Fabrication of the Gray Scale and Low Color Shift
Cholesteric Liquid Crystals Display
研 究 生 : 吳耿睿
指 導 教 授 : 陳皇銘
製作具灰階及低色彩偏移之膽固醇液晶顯示器
Fabrication of the Gray Scale and Low Color Shift
Cholesteric Liquid Crystals Display
研 究 生 : 吳 耿 睿
Student : Keng-Jui Wu
指 導 教 授 : 陳 皇 銘
Advisor : Huang-Ming Philip Chen
國 立 交 通 大 學
顯 示 科 技 研 究 所
碩 士 論 文
A Thesis
Submitted to Display Institute
College of Electrical Engineering and Computer Science National Chiao Tung University
in Partial Fulfillment of the Requirements for the Degree of
Master in
Display Institute June 2007
Hsinchu, Taiwan, Republic of China.
製作具灰階及低色彩偏移之膽固醇液晶顯示器
研究生: 吳耿睿 指導教授: 陳皇銘 博士
國立交通大學顯示科技研究所
摘要
近年來液晶顯示器因為其輕薄便利之優勢,已逐漸取代傳統映像管顯示器。膽固醇 液晶由於省電及反射式特性,非常適合於發展電子書的產業應用,只需依賴環境光即可 使人眼觀察到色彩並閱讀。 當施加一外加能量驅動膽固醇液晶時,其反射環境光的強度因為內部結構不同而有 所差異並得到灰階的效果,但發現色彩偏移會伴隨發生,使得反射光的顏色在驅動前後 不能匹配,造成色彩的失真。本篇論文特別針對此色彩偏移的問題做分析,並藉由參雜 負型液晶改變膽固醇的介電參數,試圖解決驅動時色彩不均勻的問題。利用此方法,當 膽固醇液晶被驅動時,可成功的降低色彩偏移保有單一反射可見光顏色,並同時達到灰 階的效果。Fabrication of the Gray Scale and Low Color Shift Cholesteric
Liquid Crystals Display
Student: Keng-Jui Wu Advisor: Dr. Huang-Ming Philip Chen
Display Institute
National Chiao Tung University
Abstract
Cholesteric Liquid Crystals (CLCs) have great advantages for reflective mode displays because of their lower power consumption and good color visibility. They are suitable for hand held devices or electronic paper.
For CLCs, light is selectively reflected in the planar state and scarred in the focal conic state. The transmittance ratio of these two areas determines the reflective intensity which leads to the gray scale property. The unwanted color shift (or blue shift), however, accompanies with this transition. The reflection color of the CLCs can be turned by varying the voltage leads to a continuous blue shift in the CLCs cell’s appearance color. Here we report a novel method to suppress the color shift by doping negative nematic LCs during the gray scale transition. The color shift (ΔE *ab) was greatly reduced from 49.89 to 10.80.
誌謝
論文即將完成,回想過去這兩年在交大的求學,要感謝相當多的人。首先,我一定 要謝謝我的指導教授陳皇銘老師,在學業上嚴厲細心的指導,使我受益良多,在此非常 謝謝老師兩年來的照顧。其次還要謝謝在工研院的葆如學姐,沒有學姐的教導與支持, 我大概早就半途而廢了,實驗上關鍵的步驟,也是學姊從旁指引,才有往下一步的動力, 非常謝謝學姊的照顧。 在所上,昀諺學長在我一進來時,耐心的教導製程與實驗的方法,使我能適應新環 境,由衷的感謝學長。淇文學長在觀念上的啟發,也讓我對液晶的知識很受用,謝謝學 長。世民學長在生活及課業上,也幫助我很多,讓我在遇到問題時可以獲得解答。宜揚 學長在生活上的互相支持鼓勵,我會銘記在心的。還有泳伴書豪學長,謝謝你在生活及 游泳的照顧,希望之後可以再一起切磋泳技。鴻杰學長跟我一樣是棒球迷,希望以後也 能常聯絡,一起看棒球。當然最重要的是跟我同屆的昆展、威慶、佑儒、俊民、佳恬、 耀慶,沒有你們一起同甘共苦,我想我很難撐過碩二的生活,非常謝謝各位夥伴。實驗 室的學弟妹文孚、彣綺、謹瑋、怡帆、祥志、蓮馨,謝謝你們在生活上的陪伴,為實驗 室增添活力,希望你們能順利畢業,祝福你們。 另外芳正學長的照顧,實驗上的解惑,都讓我銘記在心。鄭博的鼓勵,也讓我受用 很多。還有李柏璁老師實驗室的資岳學長、阿德、佳禾、思元、仲銓、嘉銘,也謝謝你 們,尤其是阿德,帶我進入喜歡游泳的世界,算是我的游泳教練,非常謝謝你,感激。 謝老師實驗室的坤岳,在實驗上也一起互相幫助,謝謝你。陳方中老師實驗室的丁丁、 紓婷,謝謝你們陪我聊天。朱美貞小姐跟謝琇琪小姐,也謝謝妳們的幫忙。 高大的學長及同學佳慧、跑哥、紀伯鹿、健朱、ven、cover、老大、王仔、彭彭、 蓋貓、雍元、休斯、昌哥、小魚、阿朱、士銘、小忍、聖騎士、小誠、飛龍、鳥哥、濃 濃、喜哥、維尼、搞廷、猴子,你們是最值得信賴的夥伴,希望友誼長存,以後在職場 上互相照顧。山野社的咬禾、阿格、小馬、小淫、小亮、屁齊、阿凱、阿碩、鬼、肥儒、 小鹿、jessica、芷葳,讓我在碩班也可以爬山,謝謝你們,尤其是阿格,在清大一起 跟我體驗碩班的甘苦,其中的點滴,你是更明白的。 謝謝國中同學佩瑩、黃杰、陳罐頭、瑋瑋的鼓勵,你們的加油是最有用的,因為一 直以來都是如此。相丞相宇兩兄弟,對我也很照顧,謝謝你們。還有週六上午交大博愛 校區的球友,謝謝你們讓我不忘記對壘球的熱忱,也謝謝 NDL 的阿姨跟工程師。 特別感謝雨潔姐姐跟欣岳哥的照顧,讓我能到台北散心,放鬆心情,謝謝你們。最 後感謝我的家人,是我最重要的精神支柱,在我快放棄時,能給我力量,讓我能堅持下 去。總之,要感謝的人太多太多了,要是不小心沒有提到的在這裡一起說聲謝謝、感激。Table of contents
Abstract (Chinese)………... i
Abstract (English)……….... ii
Acknowledgement……… iii
Table of contents……….. iv
List of Figures……….. vii
List of Tables……… ix
Chapter 1 Introduction and Motivation 1.1 Introduction ……… 1
1.2 Liquid Crystal Mesophases………. 1
1.2.1 Nematic………. 2
1.2.2 Chiral Nematic (Cholesteric)……….... 2
1.2.3 Smectic………. 3
1.2.4 Chiral Smectic C………... 4
1.3 Reflective LC Displays………... 4
1.3.1 Introduction Reflective LC Displays……… 4
1.3.2 No Polarizer Reflective LC Displays... 5
1.3.3 Two Polarizer Reflective LC Displays………. 6
1.4 Motivation……….. 6
1.5 Organization of This Thesis……… 7
Chapter 2 Overview of Cholesteric Liquid Crystals 2.1 Introduction ………... 8
2.3 Optical Properties of Cholesteric Liquid Crystals……….. 9
2.3.1 Textures in Cholesteric Liquid Crystals……….. 9
2.3.2 Bragg Reflection……….. 10
2.3.3 Optical properties in different textures………. 12
2.3.4 Gray Scale property of Cholesteric Liquid crystals………. 14
2.4 Reflective Color for CLCs……….. 15
2.4.1 Controlling Cholesteric Color……….. 15
2.4.2 Blueshift……….. 16
2.5 Proposed Method to Resolve Blueshift………... 17
2.5.1 Effects of Electric Field on CLCs………. 17
2.5.2 Propose Method to Improvement Blueshift……….. 20
2.6 Summary………. 21
Chapter 3 Measurement Systems 3.1 Introduction….………..………. 22
3.2 Spectrometer……… 22
3.2.1 Introduction………... 22
3.2.2 The Method for Cell Gap Measurement……… 23
3.3 Liquid Crystal Analysis System 1………... 25
3.4 ConoScope………... 26
Chapter 4 Experiments and Results 4.1 Introduction………. 29
4.2 Cell Preparation……….. 29
4.2.1 Materials and CLCs Mixtures………... 32
4.3 Measurement of Dielectric Anisotropic (Δε )……… 32
4.4 Measurement form Spectrometer……… 33
4.4.1 Introduction………... 33
4.4.2 Observation from Spectrometer……… 33
4.5 Measurement of Color Shift from Cono-Scope……….. 36
4.5.1 CIE 1976 (L* a* b*) Color Space Model………. 36
4.5.2 Chromaticity………. 38
Chapter 5 Conclusions
5.1 Summary………... 41
5.2 Future Works………... 41
List of Figures
Fig.1.1. The direction order diagram of nematic LC. .………...2
Fig.1.2. Cholesteric LC molecule structure. ………..3
Fig.1.3. A reflective LCD using ambient light for displaying images. ……….5
Fig.1.4. Basic operating mode for the normally black PDLC. ………..6
Fig.2.1. Helical structures formed in chiral liquid crystal. (a) N* is the cholesteric phase, (b) BP is the blue phase, (c) SmC* is the chiral smectic-C, and (d) TGBA is the twist grain boundary phase. ……….9
Fig.2.2. Textures in CLCs: (a) Planar or Grandjean, (b) fringerprint, (c) focal conic, (d) isotropic or homeotropic, and (e) amorphous cholesteric texture. ………...10
Fig.2.3. The reflection spectrum which is in the planar texture for CLCs. ……….11
Fig.2.4. Schematic diagram for different states of the CLCs which the dielectric anisotropy is positive. (a) Planar texture. (b) Focal conic texture. (c) Homeotropic texture. ……12
Fig.2.5. Schematic diagram for different states of the CLCs which the dielectric anisotropy is negative. (a) Initial texture in the planar state. (b) Initial texture in the focal conic state. (c) Planar texture. (d) Homeotropic texture. ………13
Fig.2.6. The POM’s photograph of the planar texture is transferred to the focal conic texture when applied electric field. ………...15
Fig.2.7. The diagram of the gray scale states of the CLCs display. ………15
Fig.2.8. The diagram of the electric susceptibility for LC molecular. ……….21
Fig.3.1. The photograph of the spectrometer. ………..22
Fig.3.2. Two reflecting surfaces separated by a layer causing a light interference. The dotted line indicates the first internal reflection. ……….23
Fig.3.4. The diagram of the conoscopic receiver. ………27
Fig.3.5. The basic system diagram of the ConoScope. ………28
Fig.4.1. (a) The ITO pattern. (b) CLCs cell processes for our experiments. ………...30
Fig.4.2. The chemical structure of chiral dopant material. ………..32
Fig.4.3. The spectrums of cell A (0wt% VA doped) when applied electric field. (a) Transmission mode, and (b) Reflection mode. ……….34
Fig.4.4. The spectrums of cell B (25wt% VA doped) when applied electric field. (a) Transmission mode, and (b) Reflection mode. ………..34
Fig.4.5. The spectrums of cell C (50wt% VA doped) when applied electric field. (a) Transmission mode, and (b) Reflection mode. ………..35
Fig.4.6. The spectrums of cell D (75wt% VA doped) when applied electric field. (a) Transmission mode, and (b) Reflection mode. ………..36
Fig.4.7. Three-dimensional representation of the CIELAB L*, a*, b* coordinates. ………...37
Fig.4.8. The color shift of each CLC cells when applied voltage from 0V to 30V taken by ConoScope. (a) 0wt% VA doped, (b) 25wt% VA doped, (c) 50wt% VA doped, and (d) 75wt% VA doped. ………39
List of Tables
Table.4.1. The process to spin the PI alignment layer which we use in the experiments. …..31
Table.4.2. The values of dielectric anisotropy for the different CLCs cells. ………..32 Table.4.3. The values for color differences ΔE *ab and the shifted wavelength nm. ……...40
Chapter 1
Introduction and Motivation
1.1 Introduction
For liquid crystals, it was observed that the optical properties of these materials changed discontinously with increasing temperatures. In 1888, Friedrich Reinitzer [1] was looking at the melting behavior of an organic substance related to cholesterol. Discussion with Lehmann [2] and others led to the identification of a new phase of matter called the liquid crystal phase. Liquid crystal is widely used for optical devices, especially for flat panel display (FPD). It has many applications such as portable products, televisions, projection, and high definition television (HDTV), etc. With the developments of various applications, liquid crystal display (LCD) technology has become the most important industry in Taiwan.
1.2 Liquid Crystal Mesophases
The various liquid crystal (LC) phases (called mesophases) can be characterized by the type of ordering. The ordering of liquid crystalline phases is extensive on the molecular scale. This order extends up to the entire domain size, which may be on the order of micrometers.
According to the structure of the different LC material, it has many types of mesophases. It can be transferred into another phase by cooling, heating or forcing. Most LC will have an isotropic phase at high temperature. This phase characterized by random and isotropic molecular ordering (little to no long-range order), and fluid-like flow behavior.
Even through the types of molecules are complicated, they are often referred to as rod-like. Discotic-like and Sanidic-like are not our major research in the thesis.
1.2.1 Nematic
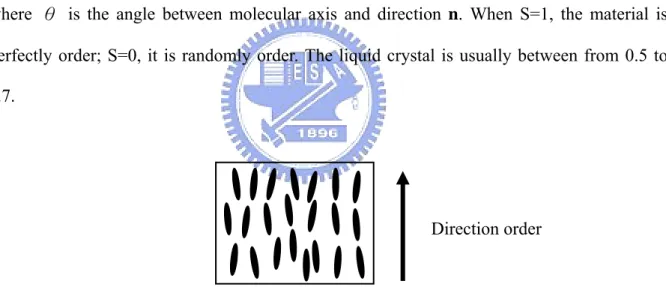
The nematic liquid crystals have no positional order but the molecules tend to point
toward a common axis (toward a same direction n). Nematic liquid crystals have the property of fluidity that is similar to isotropic. But they can be easily aligned by the external field such as electric or magnetic. In nematic phase, only the long axis of the molecules is more or less oriented, therefore it is optically uniaxial. The degree of order in nematic phase (order parameter) is defined by:
[
3cos 1]
2
1 2 −
= θ
S (1.1)
where θ is the angle between molecular axis and direction n. When S=1, the material is perfectly order; S=0, it is randomly order. The liquid crystal is usually between from 0.5 to 0.7.
Fig. 1.1. The direction order diagram of nematic LC.
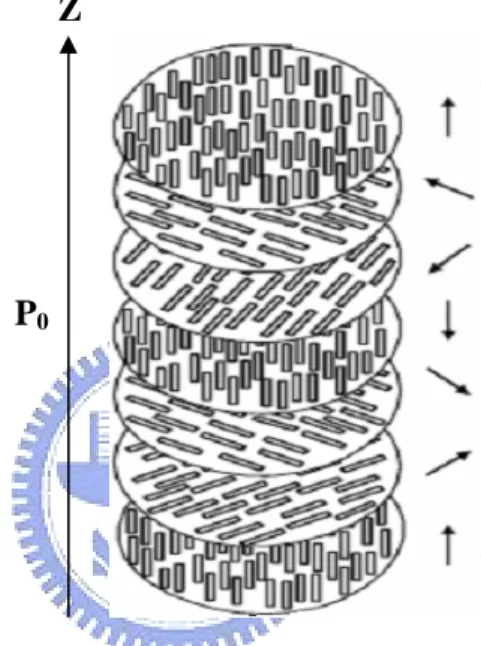
1.2.2 Chiral Nematic (Cholesteric)
The chiral nematic liquid crystal is also called cholesteric liquid crystal (CLC).
Different with the traditional nematic material, CLC contains a chiral center in the nematic mesogenic molecules. If the twisting power is strong enough for chirality, CLC material is completed when the nematic and chiral dopant are mixed. The chirality produces an intermolecular force that leads to a twist between each layer.
In various cholesteric systems, the period of the supermolecular structure (helical pitch) varies by a wide range. For the long pitch (low chirality) P >> λ (where λ is the wavelength of light), the light propagation parallel to the helix axis may be described by a superposition of two eigenwaves having electric field vectors parallel and perpendicular to the director. For short pitch (high chirality), the eigenwaves become elliptical, and in the limiting case circular. The LC molecule structure is shown in Fig. 1.2.
Fig. 1.2. Cholesteric LC molecule structure.
1.2.3 Smectic
Material in the smectic phase shows an additional degree of positional order not present in nematic phase, which means molecules are ordered in layers (smectic layers). Motion of molecules is restricted to within these layers, and adjacent layers are observed to flow past each other. In smectic A phase, the layer spacing approximately equals to the length of molecule. In smectic C phase, molecules are arranged in layers as in smectic A phase, but the directors are tilted in a preferred angle respect to the layer normal. This indicates that the molecule is confined to a conical surface of which layer normal is the axis, and the cone is the so-called smectic cone. Because the molecules tilt when material entering SmC phase from
P0
SmA phase, the layer spacing in SmC phase would be smaller than that in SmA phase. This situation is called layer shrinkage.
1.2.4 Chiral Smectic C
When chiral dopants are mixed with achiral molecules in smectic C phase, the Ferroelectric chiral smectic C phase (SmC*) is formed. When the molecules of mixture become chiral, successive smectic C layer shows a gradual change in the direction of tilt, so that the director processes about the z-axis from layer to layer.
In addition to bring about the helical structure, chirality would also induce a spontaneous polarization (Ps). This polarization vector is perpendicular to the director and lying on the plane of layer. In bulk SmC* material, freely developing helical structure, ferroelectricity does not show up since the polarization of all directions will average to zero over one pitch, resulting in no macroscopic polarization in the system. Application of electric field, of which the direction is normal to helical axis, would accompanies the polarization vector toward the field direction and unwind the helix.
1.3 Reflective LC Displays
1.3.1 Introduction Reflective LC Displays
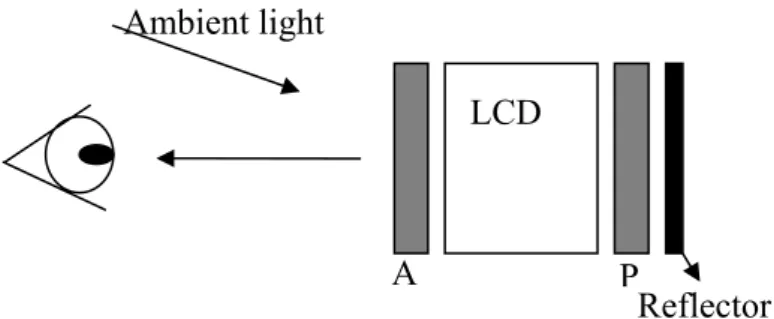
Reflective displays have several advantages, such as lower power consumption and ambient light readability. First, reflective panels do not require the backlight so that the power consumption and the weight are both reduced. Second, the reflective displays are shown in Fig. 1.3 utilize the ambient light to take on the image colors. A reflector is preferably embedded in the inner side of the liquid crystal substrate. Since it is a reflective device, a brighter ambient light would lead to more vivid images. We will present the basic operating principles of some reflective displays in the following sections [3].
Fig. 1.3. A reflective LCD using ambient light for displaying images.
1.3.2 No Polarizer Reflective LC Displays
There are some LC displays do not require a polariser have been developed. They are polymer-dispersed LC display (PDLC) and the cholesteric LC display (Ch-LCD). The Ch-LCD would be discussed in the next chapter more detail.
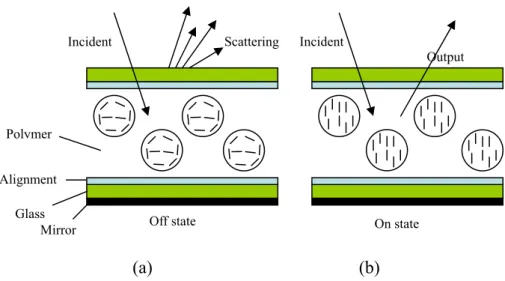
PDLC
PDLC is according to the light scattering induced by the refractive index doesn’t
match. It is consist of liquid crystal droplets that are dispersed in a solid polymer matrix. Both normally black and normally white modes are demonstrated. In the normally black mode, the scatter light is due to the refractive index mismatch at zero electric field and the light is transmitted when electric field is greater than the threshold voltage. On the other hand, the normally white mode transmits light at V=0 and the light is scattered at operating voltage greater than the threshold voltage. The homeotropic alignment layer is used in the normally white mode for PDLC. The basic operating mode of normally black mode of PDLC is shown in Figure. 1.4.
LCD
A P
Ambient light
(a) (b)
Fig. 1.4. Basic operating mode for the normally black PDLC.
1.3.3 Two Polarizer Reflective LC Displays
This kind of operating mode is widely used when the LC displays are developed at first time. The common example of such this display is a wristwatch. A LC (90o TN) cell is sandwiched between two crossed linear polarizing plates. The 90o TN cell has been widely used for transmission displays due to its high efficiency and weak color dispersion, high contrast ratio, and low operating voltage. However, when 90o TN cell is used for s reflective display sitting between the back substrate and the reflector not only reduces brightness by around 28% but also causes parallax (double image) which limits the device resolution.
1.4 Motivation
When the CLCs cells are wanted to control the intensity of reflective light, it must be applied the field across the cells. It causes to the pitch contraction and the perturbations in the helix if the field parallel to the helical axis. Thus, the color of the reflective light would be changed and shifted to the shorter wavelengths. In order to solve this phenomenon, a study of molecular behaviors of CLCs is important for us to discover more information.
For the reason, the main objective of this thesis is to understand how the external field affects the helical axis, and propose a method based on these effects to enhance the stability of
Off state Glass Alignment Polymer On state Mirror
Incident Scattering Incident
the helical axis. We infer the dielectric constant and the susceptibility act important parameters to influence the CLC’s behavior. Besides, a discussion of the results will be given in this thesis.
1.5 Organization of Thesis
In this thesis, the contents would be presented as following: the basic optical properties and the theories of field-induced wavelength shift for CLCs display are introduced in chapter 2. The measurement instruments which are used in experiments are described in chapter 3. The experiment and cell processes, results, characteristics measurements and performance evaluation including color shift, dielectric anisotropic, and spectrums that measured by spectrometer are in Chapter 4. Finally, the thesis concludes in Chapter 5 with a summary of the results and the future work for continued research on this subject.
Chapter 2
Overview of Cholesteric Liquid Crystals
2.1 Introduction
Cholesteric liquid crystals (CLCs) have a helical structure and the liquid crystal
director axes twists around this helical axis as shown in Fig. 1.2. The unique optical properties of the cholesteric phase are recognized by both Reinitzer and Lehmann at the time of their early investigations which culminated in the discovery of the liquid crystalline state. CLCs possess a supermolecular periodic helical structure due to the chirality of molecules. The helical pitch of cholesteric can be the same order of magnitude as the wavelength of visible light. Thus, the Bragg reflection occurs. In this chapter, we consider the general optical properties of CLCs, such as the influences of chiral material, Bragg diffraction due to the periodical helical structure, and induced circular dichroism. The influences of external field are also discussed briefly in order to understand the phenomenon of color change effect.
2.2 Effect of Chiral Material
Chirality may cause an intrinsic helical structure of the director field as shown in Fig. 2.1. Instead of the uniform alignment of the director field occurring in the nematic phase, the respective chiral nematic phase exhibits a helical structure such like CLC. In the preparation of a CLCs mixture, the helical pitch is controlled by the concentration of the chiral material and the helical twisting power (HTP) of the chiral dopant. The HTP is defined as:
c HTP P
⋅
= 1 , (2.1)
mixture in [μm]. Both the magnitude and sign of HTP are meaningful. It is customary to assign a positive HTP and a negative HTP to materials that exhibit the right-handed helix, and the left-handed helix, respectively.
Fig. 2.1. Helical structures formed in chiral liquid crystal. (a) N* is the cholesteric phase, (b)
BP is the blue phase, (c) SmC* is the chiral smectic-C, and (d) TGBA is the twist grain
boundary phase [4].
2.3 Optical Properties of Cholesteric Liquid Crystals
2.3.1 Textures in Cholesteric Liquid Crystals
Several types of electro-optic effects have been observed in CLCs which depending on
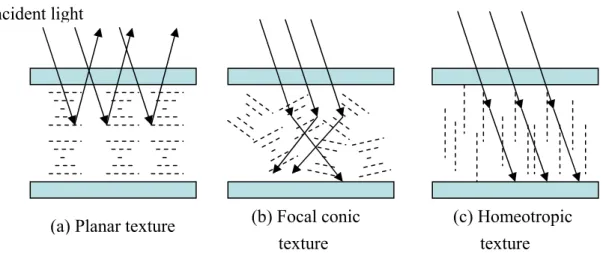
the surface treatment (boundary conditions), the helical pitch P, the thickness to pitch ratio d/P, the dielectric anisotropy Δε , the external field, and the frequency of the applied field. The CLCs textures influence the electro-optical behaviors when the textures are changed. The typical cholesteric textures for the orientation of the liquid crystal are shown in Fig. 2.2. They are named the planar (Grandjean), focal conic, fingerprint or amorphous, and the isotropic (homeotropic), respectively.
a b c d e
Fig. 2.2. Textures in CLCs: (a) planar or Grandjean, (b) fingerprint, (c) focal conic, (d)
isotropic or homeotropic, and (e) amorphous cholesteric texture [4].
In order to study the electro-optic effects, the CLCs are usually sandwiched between two parallel plates with transparent ITO electrodes. Many optical properties of CLCs are based on the different types of texture. It is a key helping for us to understand the applications of the CLC displays.
2.3.2 Bragg Reflection
When the CLCs are in the planar texture, the circularly polarized light is reflected by Bragg theory because of their chiral and periodic structure. Selective reflection occurs when the white light is incident on a cholesteric cell. In various cholesteric systems, the period of the helical pitch varies by a wide range (about 0.1μm to several hundred μm). For the long pitch (low concentration chirality) P >>λ (where λ is the wavelength of light), the light propagation parallel to the helical axis may be described by a superposition of two eigenwaves having electric field vectors parallel and perpendicular to the director. The long pitch case was studied for the first time by C. Mauguin [5] [6].
For the short pitch (high concentration chirality), when λ and P are comparable, the eigenwaves become elliptical and circular in the limiting case. It is well known that the selection reflection occurs in the limiting case due to the Bragg diffraction at a wavelength
ave B n m p/2)cos / ( 2 θ = λ ÆmλB =navepcosθ , (2.2)
where m is the diffraction order, θ is angle of light incidence, and nave is the average refractive
index of the CLC medium. There are some characteristics and restrictions for the light propagating along the helical axis as following:
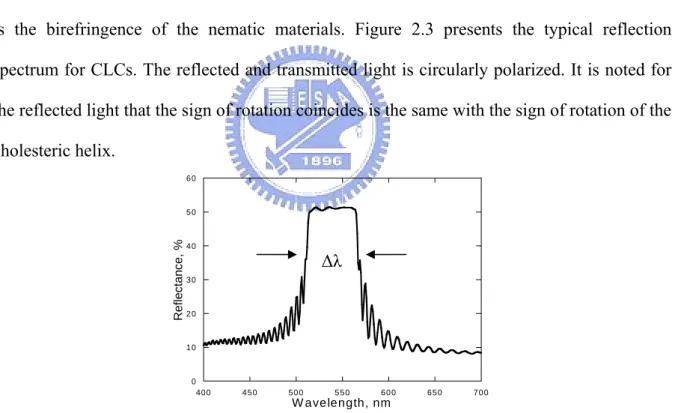
Only the first order Bragg reflection is possible in this case. This is confirmed by experimental results and theoretical considerations [7]. According to Eq. (2.2), the maximum selective reflection occurs at the wavelength λB =naveP when the angle of incident light is zero. The spectral bandwidth of the selective reflection is Δλ=P⋅Δn, where Δn=ne−no
is the birefringence of the nematic materials. Figure 2.3 presents the typical reflection spectrum for CLCs. The reflected and transmitted light is circularly polarized. It is noted for the reflected light that the sign of rotation coincides is the same with the sign of rotation of the cholesteric helix.
Fig. 2.3. Reflection spectrum is in the planar texture for CLCs.
2.3.3 Optical properties in different textures
CLCs are easy to change its texture by adding electric or magnetic field. When an
electric field applied to the CLCs cell, a texture transition occurs to minimize the free energy system. The texture transition is strongly associated with alignment layer, dielectric
0 10 20 30 40 50 60 400 450 500 550 60 0 650 700 Refl ec tan c e, % W avelength, nm Δλ
anisotropicΔε , field amplitude, and the frequency of the external field. The generally operating modes are described as following:
(i) When the dielectric anisotropyΔε>0:
Fig. 2.4. Schematic diagram for different states of the CLCs which dielectric anisotropy is
positive. (a) Planar texture. (b) Focal conic texture. (c) Homeotropic texture.
When the CLCs are in the planar texture at zero field, the helical axis is perpendicular to the cell surface as shown in Fig. 2.4(a). It reflects the selective reflection light by Bragg diffraction. The texture would be switched into the focal conic texture when applied electric field V>=Vth. In the focal conic texture, the helical axis is more or less parallel to the surface
as shown in Fig. 2.4(b). Incident light is diffracted or scattered in the forward direction and the material in this state has less reflective color appearance. It is noticed that CLCs exhibit two stable states at zero field. One of them is the planar state, and the other one is the focal conic state. So the CLCs material has the bistable property that is an advantage for display technology.
(ii) When the dielectric anisotropyΔε<0: (a) Planar texture
Incident light
(b) Focal conic texture
(c) Homeotropic texture
Focal conic texture Planar texture
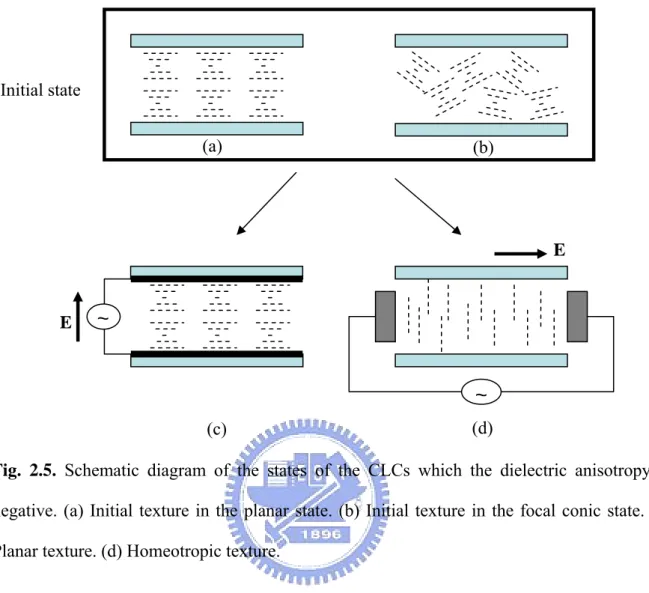
Fig. 2.5. Schematic diagram of the states of the CLCs which the dielectric anisotropy is
negative. (a) Initial texture in the planar state. (b) Initial texture in the focal conic state. (c) Planar texture. (d) Homeotropic texture.
No matter the CLCs cells are the in planar or focal conic state firstly as shown in Fig. 2.5(a) and (b), they have the same operating features when applied electric field. When an electric field E applied parallel to the axis h of the helix, it is a stable configuration and is shown in Fig. 2.5(c). In this instance the field only induces stabilization of the fluctuations. As a consequence, the order parameter is increased and displacement of the selective reflection maximum in the longwave spectral region (red shift) is observed.
Another situation is the electric field applied perpendicular to the axis of the helix as shown in Fig. 2.5(d). This situation was investigated experimentally and theoretically when the applied voltage V>>Vth [8]. The helix deformations and the threshold field are described
the by the same expression as in the case of CLCs with dielectric anisotropyΔε >0, E || h,
~
~
Initial state E E (a) (b) (c) (d)(defined below): 0 0 2 / 1 33 22 2(2 ) 4 P h K K VHelfrich ⋅ Δ ⋅ = εε π , (2.3)
where k22 and k are elastic moduli for liquid crystal, and 33 ε0 is the permittivity. It is a threshold voltage that the CLCs switch from the planar texture to focal conic texture.
2.3.4 Gray Scale property of Cholesteric Liquid crystals
CLCs exhibit gray scale property because of their multi-domain structure if the planar
texture and the focal conic texture are appeared at the same time. Starting with the imperfect planar texture, there are some domains can be switched to the focal conic texture when the threshold field is exceeded. The planar texture will break up into small domains and the incident is scattered [9] [10] as shown in Fig. 2.6. The reflective color will be decreased. Once a domain has been switched to the focal conic texture, it remains there even after the applied voltage is turned off because of the bistable property. The diagram of the gray scale states of a CLCs display is shown in Fig. 2.7. From right to left, the states are achieved by applying voltage pulses with increasing amplitude, and the reflectance. The domain is around 10 μm when CLCs are in the multi-domain and the domain structure cannot be observed by the naked eye. The typical pixel size for CLCs display is about 200 μm. It is misleading to call the CLCs multi-stable.
Fig. 2.6. The POM’s photograph of the planar texture is transferred to the focal conic texture
when applied electric field.
Fig. 2.7. The diagram of the gray scale states of the CLCs displays [3].
2.4 Reflective Color for CLCs
2.4.1 Controlling Cholesteric Color
In the preceding section, the theories of reflective color for CLCs are discussed generally. The cholesteric color is determined by temperature, electric field, chiral doping ratio, etc. However, if the color is easily changed by the environment, it is not suitable for CLCs to be a communication of information [11].
The pitch length depends on the environment temperature because of the helical twisting power will be changed. It may cause the pitch length to become longer or shorter and
Planar texture
Oily streak and focal conic texture
Increasing voltage Focal conic texture with
minimum reflectance
Planar texture with minimum reflectance
lead the cholesteric reflected color to be different [12] [13]. Therefore, it is important that the CLCs material is not sensitive to the temperature and the color can be well controlled and fixed if it wants to use on the display applications.
The color change of the electric fields to CLCs was proposed by Harper, Hansen, and Schneeberger [14] [15]. It is also called the ETC (Electrically Tunable Color) [16]. In 1968, de Gennes [17] and Meyer [18] proposed that an electric or magnetic field perpendicular to the helical axis of a CLCs would elongate the pitch length and thereby modifying the reflected color according to the Bragg’s Law [19]. It is observed that the color change from blue to red (redshift) with increasing electric field which applied normal to the helical axis. In contrast, the effects observed from Harper change from red to blue (blueshift) with increasing electric field which applied parallel to the helical axis. The helical axis will be disturbed or unwind and resulting in an aligned homeotropic configuration finally.
2.4.2 Blueshift
When the CLCs displays are drove, the blueshift is always occurred if the electric field parallels to the helix. It is defined for the short pitch, a shift of the selective reflection peak to shorter wavelengths can be observed. It is assumed that above a threshold field, a conical deformation of the planar texture leads to a contraction of the pitch and thus central wavelength λB is shifted to shorter area. However, it is shown that the blueshift of the selection reflection results from a helix distortion of the texture greater than from a pitch contraction. It causes a larger angle with the incident light and the blueshift can be observed given by Eq. (2.2). In this thesis, the main purpose is to resolve the blueshift when the CLCs cells are driving. This problem will be improved from the arguments originally advanced by Meyer.
2.5 Proposed Method to Resolve Blueshift
2.5.1 Effects of Electric Field on CLCs
Electric field acts on the anisotropic of the electric susceptibility exert torques within a LC which may compete with the elastic torques determining its internal structure. R. B. Meyer was proposed [18] [20] [21] and use the Frank’s theory of curvature elasticity in molecularly uniaxial LC is used and calculates the effects of external field on the helical structure of cholesteric materials.
Frank’s theory assumes that in cholesteric materials only one molecular axis is aligned. They are equivalent to nematic materials on a small scale. A unit vector L is defined which is parallel to the axis of molecular alignment at any point. Frank derives an expression for the elastic free energy density in a cholesteric substance:
∫
∇ + ⋅∇× + + ×∇× = k L k L L q k L L dx F [ ( ) ( o) ( ) ] 2 1 2 33 2 22 2 11 , (2.4)The k’s are the four independent elastic moduli, and P0 =2π/qo is the pitch of the uniform helix which minimizes the elastic free energy. An L defines the helix in a right-handed (x, y, z) coordinate system is
L=(cosq0z,sinq0z,0), (2.5)
Since there is local cylindrical symmetry about L, the electric susceptibility has only two components, χ|| and χ⊥, parallel and perpendicular to L, respectively. Assuming that the system is neither ferroelectric nor ferromagnetic, the field (F) energy density is given by
( ( ) ( ) ) 2 1 2 1 2 || F L F L F F gF =− ⋅χ =− χ ⋅ +χ⊥ × , (2.6)
The general procedure for calculating the effect of the field is to find the structure, characterized by L as a function of position in the sample, which minimizes the total free energy.
G=
∫
sample(gE+gF)dV , (2.7)The field dependence of the structure is in general a perturbation of the helix at low fields, followed by complete breakdown of the helix at some critical field.
Without following this general procedure, in simple situations, it can guess at the form of the perturbation in material far from surfaces. For example, consider the uniform helix of Eq. (2.5), and apply a F =Fx. Assuming that Lz remains 0, the general form of the
perturbed helix is
L=(cosθ,sinθ,0),θ =tz+ f(z), (2.8)
in which f(0)=0, and f has period π/q. By varying the integral G, one can find the different equation for f. Solve it, one can then find the q which minimizes G for a given value of the field. The pitch of the helix can often be observed as the color of light reflected by the helical structure. The result in this case, to lowest order approximation, is
] ) 2 ( 32 ) ( ) ( 1 [ 2 2 22 4 4 0 4 2 0 π κ χ χ π F P P q P= = + p − t , (2.9)
As another example, apply to the uniform helix the field
F
=
F
z
, and assume that the boundary condition will maintain the axis of the helix parallel to the field. Then a likely formof perturbation, if χ|| >χ⊥, is to rotate L at every point through an angle ρ toward the field;
L=(cosρcosqz,cosρsinqz,sinρ), (2.10)
In this case, the perturbation involves both bending and torsional strains, and depends on the relative magnitudes of the moduli of these strain, k33 and k22, respectively. If k33 ≧ k22,
there is no perturbation ( ρ = 0, q=q0 ) until a critical field Fc is reached at which complete
breakdown occurs ( ρ = π/2 ): 2 / 1 || 22 0 ] ) ( [ ⊥ − = χ χ κ q Fc , (2.11)
For k33 > k22, the breakdown will involve hysteresis around this field value, since
high energy configurations exist between the unperturbed helix and the breakdown configuration. For k33 < k22, there is a range of field for which ρ and q change continuously:
c c F F F 1/2 33 22 2 / 1 22 33) ( ) ( κ κ κ κ ≤ ≤ , (2.12) In this range, 1/2 0 22 33) ( P F F P c κ κ = , (2.13)
2.5.2 Propose Method to Improvement Blueshift
It has also been observed that in some cases, application of a large dc electric field perpendicular to a thin film of cholesteric substance in the planar texture, rather than changing the wavelength of light reflected by the helical structure, increases its intensity greatly.
This observation can be explained by the present theory by assuming thatχ⊥ >χ||. It makes the unperturbed uniform helix of Eq. (2.5), with F = Fz, the lowest energy structure for the system. Since the planar texture already satisfies field merely eliminates existing perturbations in the helical axis, making it more perfect, and thus intensifying the reflected light.
According to the above explanations, it must find a method to let the χ⊥ >χ|| in CLC’s nematic host and the reflective color will be uniform when CLCs are driving. Here we use the relative permittivity to substitution the electric susceptibility is given by:
e r χ
ε = 1+ , (2.14)
It uses the Eq. (2.14) to substitute the Eq. (2.11) and the critical field becomes proportional to the (1 /ε|| −ε⊥)1/2 if the influences of the elastic modulus of κ22 is neglected. The diagram of electric susceptibility for LC molecular is shown in Fig. 2.8. It is obviously that whenε⊥ >ε||, the blue shift is avoided by applying the electric field which is parallel to the helical axis. According to the above explanations to lower the blueshift in CLCs, a negative dielectric anisotropic (Δε = ε||−ε⊥ <0) nematic LC material would be doped appropriately into the positive nematic host in CLCs. We infer that it can increase the stability for the pitch and make the color more uniform when the electric field is applied.
Fig. 2.8. The diagram of electric susceptibility for LC molecular.
2.6 Summary
In this chapter, the basic optical properties are introduced and discussed for CLCs. It is known that different kind of nematic host is needed different operating methods to drive it. Then, the statements focus on the gray scale property and color shift for CLCs because it’s the major framework in this experiments. After that, in order to resolve the issue of blueshift, the method of doping negative nematic material is proposed according to the Meyer’s explanation. It can make the reflective color more uniform when the CLCs cells are driving.
χ⊥ χ|| z
Chapter 3
Measurement Systems
3.1 Introduction
In this chapter, the measurement systems and the cell fabrication process are described. We use the hydrochloric acid to etch the ITO substrates to enhance the stability when the cell is applied electric field. The spectrometer is used to measure the cell gap and the spectrums of transmission light intensity of the cell. The ConoScope is used to measure the chromaticity and the tristimulus values of the cell.
3.2 Spectrometer
3.2.1 Introduction
The UV-VIS spectrometer is as shown in Fig 3.1. LAMBDA 650 PerKin Elmer is high performance between 190 nm and 900 nm with the resolution ≦ 0.17 nm, and the spectrometer principles are double-beam, double mono-chromator, ratio recording spectrophotometers.
Fig. 3.1. The photograph of the spectrometer.
The absorption, reflectance and transmittance of materials characterized with the LAMBDA 650, and the large sample compartment allows easy access to a wide variety of sampling accessories.
3.2.2 The Method for Cell Gap Measurement
For LC display technologies, the distance of cell gap usually affects the optical properties. The cell gap of a LC display determines to a great extent the electro-optical properties such as the contrast ratio, response time, and switching voltage, etc. It’s important to control the cell gap during the manufacturing process.
The basic concept of the measurement method is based on the interference pattern of the light reflected by a layer with two reflecting surfaces [22]. The situation diagram is shown in Fig. 3.1. It is defined that the coefficient of the reflection R1 as the ratio of the light reflected by surface 1 to the total incident light on surface 1. R2 is defined as the reflection coefficient of surface 2.
Fig. 3.2. Two reflecting surfaces separated by a layer causing the light interference. The
dotted line indicates the first internal reflection [16].
If the total incident light is I =cosωt and assume no absorption of light in surfaces 1 and 2, the total reflected light R can be wrote as
(
)
k(
o)
k k k R R t kt R t R R= + − − + ∞ = −∑
ω ω 1 cos cos 1 1 2 1 1 1 1 , (3.1) where ω 2π 2/λ 1 gap cn= and t 2dgapngap2/c
1
0 = , c is the speed of the light in vacuum, λ is
the wavelength, dgap is the thickness of the layer, and n is the refractive index of the gap
layer. In Eq. (3.1), the cosine factors for k >1 are caused by internal reflections. The magnitude of the cosine factors for k>1 is much smaller than for k =1 since R1<1 and
1
2 <
R . Therefore the internal reflections are neglected, so the Eq. (3.1) becomes
(
)
⎟⎟ ⎠ ⎞ ⎜⎜ ⎝ ⎛ − − + = λ π ω ωt R R t ngapdgap R R 1cos 1 1 2 2cos 4 , (3.2) Thus the reflected spectrum isR
( )
λ 2 =R12+[
(
1−R1)
2R2]
2+2R1(
1−R1)
2R2×cos(
4πngapdgap/λ)
, (3.3)The generally known of the periodic term in Eq. (3.3) is an interference pattern. The periodicity of the reflected interference spectrum certainly determines the optical thickness of the cell gap, ngapdgap.
If the λ1 and λ2 are two wavelengths showing extrema in Eq. (3.3), then
(
4 /)
1cos πngapdgap λ =± for λ =λ1 and λ =λ2. That
2ngapdgap =k1λ1/2, (3.4) 2ngapdgap =k2λ2/2, (3.5) where k1 and k2 are natural numbers. Suppose λ1 >λ2, then
k2 =k1+x, (3.6) where x is a natural number.
According to the Eq. (3.4), (3.5), and (3.6), it can write
(
)
2 1 2 1 4λ λ λ λ − = x d ngap gap , (3.7)The value of x−1 indicates the number of extrema in R
( )
λ 2 between the wavelengths λ 1 and λ . If several wavelengths with extrema are known, it is better to choose the distance 2 xbetween the two extrema as large as possible for improving the accuracy of the calculation of
gap gapd
n .
3.3 Liquid Crystal Analysis System 1
The liquid crystal analysis system 1 (LCAS 1) is a fully automated system, consisting of proprietary hardware and software, for measuring the physical parameters of ferroelectric and nematic liquid crystal materials. In this thesis, the major purpose is the dielectric anisotropic Δε measured for the different CLC’s nematic host.
The LC cell can be considered a parallel-plate capacitor and follow the capacitor equation in the electromagnetic as defined:
d S
C=ε , (3.8)
where S is the area of the two parallel conducting plates separated by a uniform distance d, and ε is the dielectric of a constant permittivity. In a nematic single crystal, the static dielectric constants ε|| and ε are existed simultaneously. The LCAS 1 system will ⊥ measure the capacitor value of the cell and calculate the dielectric constant (ε|| and ε ) ⊥ value of the material. The measuring method is described as bellow:
(a) The cable line and the appropriative cell for LCAS 1 will be adjusted at the first time in order to compensate for the parasitic impedances, capacitance, and the resistance. The capacitance of the empty cell CEMPTY is obtained in these steps and the value is important to the following experiments for us. If the step of the adjustment is not completed correctly, the experimental data that we measure will include the cell resistance and capacitance, the LCAS 1 will yield incorrect results.
(b) For measuring the parallel dielectric constant, the LCAS 1 will measure the C ||
automatically. According to the Eq. (3.1), the value is determined as: EMPTY C C|| || = ε , (3.9)
where C is the measured capacitance at V|| th/Vrms = 0 and the CEMPTY is the
measured empty cell capacitance. It can also obtain the ε|| using the same rule as defined: EMPTY C C⊥ ⊥ = ε , (3.10)
where C⊥ is the measured capacitance at driving voltage V << Vth. It is noticed
that the parallel and the perpendicular dielectric constant have no units.
(c) The dielectric anisotropy is the difference between the parallel and the perpendicular dielectric constants as given by:
Δε =ε|| −ε⊥, (3.11)
where it is possible that the value of the dielectric anisotropy Δε is positive or negative. It depends on the character of the LC material.
The LCAS 1 system is useful for the LC technologies. It can measure almost kinds of parameters for LC material, such as elastic constant, rotational viscosity, voltage holding ratio, and threshold voltage, etc.
3.4 ConoScope
The ConoScope (autronic-MELCHERS GmbH) is an important instrument for display technologies. It can use for visual performance, such as chromaticity, color shift, contrast ratio, luminance, and many useful characteristics. In our experiments, the major purpose using the ConoScope is the color shift measurement. The diffuse light is used for the reflection mode to analyze the parameters of the CLCs cell.
Fig. 3.3. The photograph of the ConoScope.
The ConoScope are based on the conoscopic method where a cone of elementary parallel light beams C, transmitted by the sample S (located in the front focal plane of the transform lens L1) and originating from the measuring spot is collected simultaneously over a large solid angle by the lens L1 as shown in Fig. 3.3.
A pattern IF1 (conoscopic figure) is generated in the rear focal plane F1 of the lens L1 with the intensity of each area element corresponding to the intensity of one elementary parallel beam with a specific direction of light propagation.
The light propagation parallel to the optical axis of the conoscopic receiver forms the center of the circular pattern IF1 and the beams with the constant angle of inclination appear as concentric circles around the center with the radius of the circles being proportional to the inclination.
An arrangement of several lenses (here represented by single lens) modifies the light propagation directions in a way, that all beams emerging from the sample in the same direction will meet in one spot in the focal plane (or within the conoscopic figure) corresponds to one specific direction of the viewing cone. The conoscopic figure directly shows color and luminance as they would have been plotted in a polar coordinate system as described in Fig. 3.4.
Chapter 4
Experiments and Results
4.1 Introduction
For the CLCs reflection displays, the phenomenon of color shift (blue shift) is always accompanied when they are applying external field. It causes the selective reflection peak to shift to the shorter wavelength and the reflection color is turned. The display images will be distorted and it’s quality become much badly. In this thesis, according to the theories which was proposed by R. B. Meyer [18], the negative (Δε <0) nematic material (which is also called VA material) will be doped into CLCs to try to resolve the color shift phenomenon. As mentioned in the section 2.5, the χt will become higher gradually with doping VA material. This method helps to increase the stability of helical axis when the CLCs cells are driving. Different mixing ratio of CLC’s host is discussed in this chapter and the best dopant ratio will be chosen to the balance of the gray scale property and the low color shift character.
4.2 Cell preparation
The cholesteric liquid crystals (CLCs) null cells are prepared by our-self in the clean room. We start to fabricate normal steps of the CLCs cell process. The detail steps to produce the prototype are listed below.
(a) ITO etching:
In order to increase the stability of the CLCs cell when the electric field is applied, we pattern the ITO substrates by using the photolithography process. The pattern and the etching
process of the cell are shown in Fig. 4.1.
(a)
Fig. 4.1. (a) The ITO pattern. (b) CLCs cell processes for our experiments.
(b) CLCs cell processes:
(1) The ITO pattern substrates was cleaned by using the ethyl alcohol shocked for 5 minute in the ultrasonic. Further, the detergence and the DI water were used to wash it alternately. The ITO substrates were blew with nitrogen gas to remove the DI water and then baked for 30 minutes at 100oC.
(2) The substrates were explored by UV-ozone before coating the PI alignment layer. It had a better adhesion of alignment layer. Put the clean ITO substrate into the spin coater. Dropped the solution of alignment material and wetted for 30 second (make sure the solution to coater the whole substrate), then spin. The procedure of the spin-coating was as follows:
Clean/Etch ITO pattern
Coating of
alignment film Baking Rubbing
Spacer placing with UV glue Press uniformly UV curing for adhesion Cell gap measurement LC injection Annealing Measuring of E-O properties
Table. 4.1. The process to spin the PI alignment layer which we use in the experiments.
When the polyimide was coated, the substrates were needed to bake for 1hr at 200oC. The polyimide (PIA-X201-G01) was from Chisso. According to the spin rate, the thickness of 50wt% polyimide was about 350Å.
(3) Using the rubbing machine to rub the substrates. Because of the material of alignment layer was the same to every substrate, the rubbing strength will not change to get the parameters. The rubbing strength was different depending on the LC material, alignment layer, and pretilt angle. The rubbing condition used was as below:
PI alignment layer
Pile impression 0.2mm
Rotation speed 300rpm
Table advancing speed 7.3mm/s
(4) Combining two ITO substrates and to form the cell gap. The 8μm ball spacer mixxed with the UV glue (NOA-65, from Norland) and dropped a small amount on the substrates. Cover the top plate and press it. Next, because the UV glue was sensitive to the UV light, take the cell under a UV lamp for 5 minutes to cure the glue, and the empty cells were finished.
(5) The cell gap of the empty cells is measured by spectrometer using interferometric method. The details were explained in chapter 3.2.
5000rpm 60s 2st spin 5000rpm 60s 2st spin 800rpm 30s 1st spin 800rpm 30s 1st spin 0rpm 40s wetting 0rpm 40s wetting Speed Time Speed Time Polyimide (Second) Solvent (First)
(6) Heated up the CLCs material to isotropic and injected it from the edge of the cell by using capillarity until the CLCs was full of the gap. Then annealing and cooling the CLCs cells continuously in order to let the alignment of molecules much better.
(7) Soldering the wire at the ITO contact on the CLCs cells, and then the cells were available for measuring the electro-optical properties.
4.2.1 Materials and CLCs Mixtures
The positive and negative nematic LC (MJ-041937, Merck) were used in the experiments. The chiral dopant structure was shown in Fig. 4.2. The CLCs mixtures with selective wavelength reflected around 550 ± 15 nm was prepared at the ratio of 85.5 wt % nematic host with 14.5 wt % chiral dopant.
COOC*H(CH3)C6H13 (s)+C6H13C*H(CH3)OOC
Fig. 4.2. The chemical structure of chiral dopant material.
4.3 Measurement of Dielectric Anisotropic (
Δε)
Since we mixed the negative dielectric anisotropic nematic LC into the positive (Δε >0) nematic host in CLCs, the changed value Δε for nematic host is important. In order to calculate the value of the Δε, the LCAS 1 is used here to measure it. Different mixing ratios are discussed here and the results are shown in Tab. 4.2.
Table. 4.2. The values of dielectric anisotropy for the different CLCs cells.
Cell A B C D E
wt% 0 25 50 75 90
The Δε of host nematics became negative when the negative nematic LC mixing ratio over 75wt%. Different values of Δε show the different degrees of tilt or unwinding to the CLCs molecules when applying operating field. The different properties for each CLCs cells will be discussed in later sections.
4.4. Measurement form Spectrometer
4.4.1 Introduction
Spectrometer is usually used for CLCs displays measurement. It can cover all visible light wavelengths and help us to gauge the various properties in CLCs cells. We combine with the waveform generator in order to observe the different characteristics for each CLC cell when applied electric field. The results will be discussed in next section.
4.4.2 Observation from Spectrometer
The transmittance and reflectance spectrums are measured in order to see the color shift and the gray scale properties for different mixing ratio of CLCs cells. The operating electric field (1K Hz and square wave) is between 0V to 30V and the direction is parallel to the helical axis. The refractive oil (n=1.56) is used here to adjust the inner reflection which comes from the refractive index mismatch of CLCs and ITO glass. The results are shown as bellow:
30 40 50 60 70 80 90 100 400 500 600 700 Tra n s m is s ion, % 0V 10V 15V 30V 20V 25V Wavelength, nm 0 10 20 30 40 50 60 400 500 600 700 Re fle c ti on, % Wavelength, nm 0 to 5V 10V 15V 30V
(a) (b)
Fig. 4.3. The spectrums of cell A (0wt% VA doped) when applied electric field. (a)
Transmission mode, and (b) Reflection mode.
30 40 50 60 70 80 90 100 400 500 600 700 Tr a ns m is s ion, % 0V 10V 15V 20V 30V 25V Wavelength, nm 0 10 20 30 40 50 60 400 500 600 700 Re fl e c ti on, % Wavelength, nm 0V 10V 15V 20V 25 to 30V (a) (b)
Fig. 4.4. The spectrums of cell B (25wt% VA doped) when applied electric field. (a)
30 40 50 60 70 80 90 100 400 500 600 700 Tra n s m is s ion, % 15V 20V 25V 30V 0V 10V Wavelength, nm 0 10 20 30 40 50 60 400 500 600 700 Re fle c tion, % Wavelength, nm 0 to 10V 15V 20V 25V 30V
(a) (b)
Fig. 4.5. The spectrums of cell C (50wt% VA doped) when applied electric field. (a)
Transmission mode, and (b) Reflection mode.
From the Fig.4.3 to Fig. 4.5, the tendency of color shift can be observed which is proportional to the value of Δε. If the Δε is smaller, the color shift is also lower when the CLCs cells are drove. The color shift of cell A is about 90nm, cell B is about 70nm, and cell C is about 20nm in the same operating voltage range. Since the operating voltage for cell A is lower because of its high Δε, the color shift is more seriously than other cells. For cell C, it is noticed that the gray scale property is much the same with cell B, but the color shift is lower. The result is good for us to use it on the CLCs displays application.
30 40 50 60 70 80 90 100 400 500 600 700 Tr a ns m is s ion, % Wavelength, nm 0V 30V 0 10 20 30 40 50 60 400 500 600 700 R e fl ect io n , % Wavelength, nm 0V 30V (a) (b)
Fig. 4.6. The spectrums of cell D (75wt% VA doped) when applied electric field. (a)
Transmission mode, and (b) Reflection mode.
The phenomenon of color shift is totally improved when the Δε is changed to negative (ε⊥ >ε||) as shown in Fig. 4.6. Although the color shift is erased, the gray scale is virtually too weak to be used for displays. It is noticed that for the negative nematic host in CLCs, the order parameter is increased and the alignment is much better when the electric field is parallel to the helical axis [23]. Then, the reflection intensity is larger than before operating as shown in Fig. 4.6 (b). The result of cell E (90wt% VA doped) is the same with cell D so it is not shown here.
4.5 Measurement of Color Shift from Cono-Scope
4.5.1 CIE 1976 (L* a* b*) Color Space Model
The CIE 1976 (L* a* b*) color space, abbreviated CIELAB, is used here to help us to calculate the quantities of color shift. The parameters of L*, a*, and b* are defined as below:
*=116( / )1/3−16 n Y Y L (4.1) * 500[( / )1/3 ( / )1/3] n n Y Y X X a = − (4.2) * 200[( / )1/3 ( / )1/3] n n Z Z Y Y b = − (4.3)
where these equations X, Y, and Z are the tristimulus values of the stimulus and Xn, Yn, and Zn
are the tristimulus values of the reference white. L* represents lightness, a* represents approximate redness-greenness, b* represents approximate yellowness-blueness [24]. The L*, a*, and b* coordinates are used to construct a Cartesian color space as illustrated in Fig. 4.7.
Fig. 4.7. Three-dimensional representation of the CIELAB L*, a*, and b* coordinates.
After defining the parameters of L*, a*, and b*, the color differences can be obtained according to those values. Color differences are measured in the CIELAB space as the Euclidean distance between the coordinates for the two stimuli. This is expressed in terms of the CIELAB ΔE *ab, which can be calculated as below:
light red green yellow blue dark a* b* L*
2 / 1 2 2 2 * * ] * [ * L a b E ab = Δ +Δ +Δ Δ (4.4)
Where ΔL*, Δa*, and Δb* are the parameters of color differences when the CLCs cells are in two different types. It must define one type as the reference white and the other type is compared with it to calculate the variations. The definition what we use will be explained more detail in next section.
4.5.2 Chromaticity
The results are measured from Cono-Scope will be shown and discussed. It would be the reference white when the cells are in 0V and calculate the color differences ΔE *ab that applied to 30V according to the Eq. (4.4). The results of chromaticity for each CLC cells are shown in Fig. 4.2. (a) ΔE *ab= 49.89 (b) ΔE *ab= 14.79 0V 30V 0V 30V
(c)ΔE *ab= 10.80 (d) ΔE *ab= 2.97
Fig. 4.8. The color shift of each CLC cells when applied voltage from 0V to 30V taken by
Cono-Scope. (a) 0wt% VA doped, (b) 25wt% VA doped, (c) 50wt% VA doped, and (d) 75wt% VA doped.
It can see obviously the color shift is much more if the value of Δε is higher when applied voltage from 0V to 30V. The color shift can be reduced by doping negative nematic in order to lower the Δε in CLCs cells as shown in Fig. 4.8 (a) to 4.8 (c). It is noticed that the color shift is totally disappeared when the negative nematic LC mixing ratio over than 75wt% as shown in Fig. 4.8 (d), so the cell E (90wt% VA doped) is neglected here. Since the color shift is erased for cell D as shown in Fig. 4.8 (d), the ΔE *ab= 2.97 is also measured from Cono-Scope. It is thought that has a little interference from ambient light when the measurement is proceeding.
0V
4.6 Summary
It is known that the color shift is resolved obviously by doping negative nematic LC to lower the value of Δε. The results of shift nm and ΔE *ab are compared as shown in Tab. 4.3 and imply the same trend for the color shift phenomenon.
Table. 4.3. The values for color differences ΔE *ab and the shifted wavelength nm.
Cell A B C D
ab
E *
Δ 49.89 14.79 10.80 2.97
Shift nm 89 71 20 0
The color shift can be minimized if the Δε is small enough. It means that the whole molecules almost tilt in the direction of the applied field [25] [26]. However, the gray scale will become obscure when lager amount of negative nematic LC doped into positive nematic LC. As a result, the best dopant ratio will be chosen which likes cell C to the balance of the gray scale property and the low color shift character.
Chapter 5
Conclusions
5.1 Summary
The research of this thesis aimed to get the CLCs device which had gray scale and low color shift simultaneously. It is focused on the causes of color shift and tried to find approached to resolve for these problems. In order to exalt the color quality of CLCs displays, the phenomenon of color shift on gray scale must be avoided. According to the Meyer’s explanations, we proposed doping negative nematic material into positive nematic host in CLCs cells appropriately, and it is successful to lower the color shift and preserves the gray scale property. The value of dielectric anisotropy is really changed by doping VA material and we also use the Cono-Scope to verify the results of blueshift from spectrometer. For cell C (50wt% VA doped), the blueshift is improved fromΔE*ab=49.89 to 10.80 and the gray scale property is much the same with cell B in limitative voltage range. It is known the best dopant ratio will be chosen carefully to obtain the balance of the gray scale property and the low color shift when CLCs cells are driving.
5.2 Future Works
Although the color shift is lowed successfully in our experiments, the best doping ratio of negative nematic material is still not clear. Because the low color shift and gray scale property are needed at the same time if the CLCs materials are wanted to use for display applications. It must find and try to get this ratio depends on the industrial requirements even the threshold voltage will be arose lightly when the dielectric anisotropy Δε is lower. Maybe the higher pretilt angle alignment layer can be chosen here to help to decrease the
operating voltage.
The color shift phenomenon can also be used for others applications. It can get a multicolor display which combines with the photo-curing and electrically induced color shift without changing the chiral dopant concentration [27] [28]. But the issue is the reflective intensity decreased seriously when the color shift is occurred. This technology is still in beginning and needs to look for better process to fabricate.
![Fig. 2.1. Helical structures formed in chiral liquid crystal. (a) N* is the cholesteric phase, (b) BP is the blue phase, (c) SmC* is the chiral smectic-C, and (d) TGB A is the twist grain boundary phase [4]](https://thumb-ap.123doks.com/thumbv2/9libinfo/8718565.200387/20.892.131.804.271.713/helical-structures-formed-crystal-cholesteric-chiral-smectic-boundary.webp)
![Fig. 2.2. Textures in CLCs: (a) planar or Grandjean, (b) fingerprint, (c) focal conic, (d) isotropic or homeotropic, and (e) amorphous cholesteric texture [4]](https://thumb-ap.123doks.com/thumbv2/9libinfo/8718565.200387/21.892.190.752.114.273/textures-grandjean-fingerprint-isotropic-homeotropic-amorphous-cholesteric-texture.webp)
![Fig. 2.7. The diagram of the gray scale states of the CLCs displays [3].](https://thumb-ap.123doks.com/thumbv2/9libinfo/8718565.200387/26.892.308.602.505.724/fig-diagram-gray-scale-states-clcs-displays.webp)
