Coprostanol in a Sediment Core from the
Anoxic Tan-Shui Estuary, Taiwan
Woei-Lih Jeng
aand Bor-Cheng Han
b aInstitute of Oceanography, National Taiwan University, Taipei, Taiwan, Republic of China andb
School of Public Health, Taipei Medical College, Taipei, Taiwan, Republic of China
Received 22 December 1993 and in revised form 7 July 1994
Key words:coprostanol; extractable; bound; sediment; diagenesis
A short sediment core with a length of approximately 40 cm taken from the anoxic Tan-Shui estuary, Taiwan, was analysed for extractable and bound coprostanol (5â-cholestan-3â-ol), cholestanol (5á-cholestan-3â-ol) and
choles-terol (cholest-5-en-3â-ol). Extractable Ócoprostanol and cholestanol
concen-trations exhibit an abrupt change at a depth of about 20 cm, which supposedly marks the time when a sewage treatment plant became operational in the estuary in 1980. The Ócoprostanol/cholesterol and cholestanol/cholesterol
ratios are comparatively higher in sediment than in the sewage effluent, implying some degree of diagenesis in the extractable phase. Anoxicity must have played a crucial role in the preservation and diagenesis of the sterols. In the upper layer (c. top 20 cm), the concentrations of extractable Ócoprostanol,
normalized to total organic carbon (TOC), increase down the core. Extractable cholestanol exhibits the same trend, but extractable cholesterol shows the opposite trend. This indicates cholesterol reduction to these two stanols. In addition, both bound Ócoprostanol/TOC and cholestanol/TOC display a
decreasing trend with core depth and no pronounced concentration change at 20 cm depth. The averages of percent bound sterols are in the following order: cholesterol >Ócoprostanol>cholestanol. ? 1996 Academic Press Limited
Introduction
Coprostanol (5â-cholestan-3â-ol) has been used to trace sewage pollution in various
sedimentary environments (Goodfellow et al., 1977; Hatcher & McGillivary, 1979; Yde et al., 1982; Brown & Wade, 1984; Readman et al., 1986; Venkatesan & Kaplan, 1990; LeBlanc et al., 1992). A chronological study of coprostanol concentrations in a dated sediment core has been shown to reflect the true sewage inputs over 160 years (Muller et al., 1979). Coprostanol will degrade during aerobic wastewater treatment processes
(McCalley et al., 1981). However, coprostanol, along with cholesterol (cholest-5-en-3
â-ol) and cholestanol (5á-cholestan-3â-ol), is quite persistent in anoxic sedimentary
environments (Nishimura & Koyama, 1977; Hatcher & McGillivary, 1979; McCalley et al., 1980; Readman et al., 1986; Bartlett, 1987). The hydrogenation of naturally
occurring unsaturated sterols may be effected extremely rapidly in contemporary aquatic
sediments (Gaskell & Eglinton, 1975). Sterol diagenesis has been studied in a bay (Lee et al., 1977), a lake (Nishimura, 1978) and laboratory experiments (Nishimura, 1982). The Tan-Shui estuary is located on the outskirts of the metropolitan area of Taipei city, with a population of approximately 3 million. The Tan-Shui river carries untreated
sewage along its course, and treated sewage effluent has been discharged into the estuary
since 1980. High levels of coprostanol have accumulated in the estuary (Jeng & Han, 1991). The estuary is very anoxic; dissolved oxygen is virtually zero. A preliminary
survey shows that redox potential (Eh) values of the surface sediments range from 0 to
"500 mV approximately. This anoxicity has lasted for a very long period of time which aids in the preservation of coprostanol in sediments. The aim of this study was to investigate the short-term diagenesis of coprostanol, cholestanol and cholesterol in the anoxic environment by analysing their concentrations in the extractable and bound phases.
Experimental
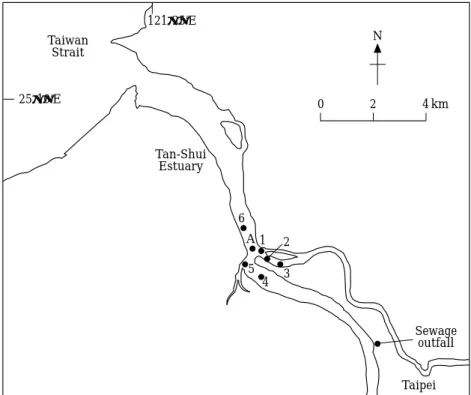
Sediment cores were taken from the Tan-Shui estuary (Figure 1) using a gravity corer with a 6-cm diameter core barrel. Core A had a length of about 40 cm and was sectioned at 5-cm intervals from the top for analysing sterols. Cores 1–6 were measured for the
downcore variation of Eh.
For measuring redox potentials, the core liner was drilled with a series of holes (allowing the redox electrode to be inserted into sediment) at 2·5-cm intervals along the liner length. Before sampling, the holes were taped with masking tape. Immediately after
Taiwan Strait Tan-Shui Estuary Sewage outfall Taipei 0 2 4 N 121°25'E 25°10'E 2 1 6 4 5 3 A km
retrieving the core, the masking tape was peeled off the liner, and Ehwas measured in situ
with a combined reference (Ag/AgCl) and platinum electrode from the core top, one hole at a time. The reading was taken after a period of 60 s, to ensure that the electrode had reached a steady potential.
All solvents used were HPLC grade and/or all-glass distilled. All reagents employed were reagent grade.
Each section of Core A was freeze-dried and extracted with a mixture of benzene and methanol (1:1, v/v) in a Soxhlet apparatus for 24 h. 1-Nonadecanol was added to the extract as an internal standard. The spiked extract was concentrated and saponified with 0·5 N methanolic KOH. The neutral lipid was extracted with n-hexane four times. The extracted lipid was fractionated by silica gel (deactivated with 5% water) column chro-matography. The less polar lipids were removed by elution with 40% hexane in chloro-form, and the sterol-containing fraction was isolated using 10% methanol in chloroform. The extracted sediment residue was subjected to alkaline hydrolysis (16 h) for releasing bound lipids, followed by filtration, internal standard addition, n-hexane extraction and sterol isolation.
The isolated sterols (both extractable and bound) were derivatized with NO-Bis (trimethylsilyl) acetamide prior to gas chromatography (GC) analysis.
Sterols (as TMS ethers) were analysed by capillary GC and gas chromatography–mass spectrometry (GC-MS). Separations were performed with an HP 5890A gas chromato-graph equipped with a flame ionization detector (FID) and a split/splitless capillary column inlet system. An OCI-5 cool on-column injector (SGE, Australia) was also fitted
in the chromatograph for quantitation. A 30 m#0·25 mm i.d., 0·25 ìm film thickness,
SE-30 bounded-phase fused silica capillary column was used. Hydrogen was used as the
carrier gas. Nitrogen served as the make-up gas. The detector was set at 300)C. Oven
temperature was programmed as follows: (1) 45–90)C at 15 )C min"1; (2) 90–270)C
at 3)C min"1; (3) 20 min at 270)C; (4) 270–280 )C at 10 )C min"1; and (5) 20 min
at 280)C. Identification was made by co-injection with authentic standards. Positive
confirmation was done with a Finnigan MAT TSQ-46C GC/MS. All GC traces were recorded by a Shimadzu data processor, Chromatopac C-R6A. Quantitation was achieved by comparison of sample peak areas with the areas of the internal standard. The precision of the method was determined by five replicate analyses of the same sediment sample, and the relative standard deviation was 2·1%.
Total organic carbon was determined by the dichromate acid oxidation method (Gaudette et al., 1974) modified by addition of Ag2SO4to H2SO4at the rate of 15 g l"1,
with ortho-phenanthroline-ferrous complex used as the indicator. The relative standard deviation of TOC determinations was generally <1%.
Results and discussion
Prior to discussing sterols, it is important to know the redox state of the sediment in the
estuary. As shown in Table 1, Ehvalues are virtually negative and generally in the range
between"100 and "200 mV. The general trend of depth profiles is that the Ehvalues
decrease with depth in the upper core and fluctuate with depth in the lower core.
For the extractable phase,Ócoprostanol and cholestanol concentrations vs. core depth
exhibit a large break between Sections 4 and 5 (i.e. at a depth of about 20 cm), which indicates an extra large input of coprostanol from sometime in the past to the sampling time (Table 2). This depth supposedly marks the time when a sewage treatment plant
became operational in 1980, and considerably higher levels of coprostanol began to be deposited in the estuary. This record has been well kept due to anoxicity, which aids in the preservation of coprostanol.
Core A was located not far from the sewage outfall (Figure 1) which was presumably
the predominant coprostanol source for this core. The Ócoprostanol/cholesterol and
cholestanol/cholesterol ratios of the effluent from the sewage outfall were 0·69 and
0·043, respectively, and those of Core A sediments had averages of 2·19 and 1·43, respectively (Table 2). The increases in the two ratios are of particular interest. It has been well documented in the literature that there is little decay of coprostanol, cholesterol and cholestanol in anaerobic sediments (Nishimura & Koyama, 1977; Hatcher & McGillivary, 1979; McCalley et al., 1980; Readman et al., 1986; Bartlett, 1987). Furthermore, cholesterol can be transformed into coprostanol and cholestanol in a reducing environment (Gaskell & Eglinton, 1975). The present result with compara-tively higher stanol/stenol ratios implies rapid hydrogenation of cholesterol, which could lead to the conversion of cholesterol into coprostanol and cholestanol in the reducing environment.
Since grain size has a significant effect on the distribution of organic compounds in
sediment, concentrations of molecular data are usually normalized to TOC (Jeng & Han, 1991; LeBlanc et al., 1992; Jasper & Gagosian, 1993); variation trends and/or
meaning-ful results can readily be obtained. ÓCoprostanol, cholestanol and cholesterol
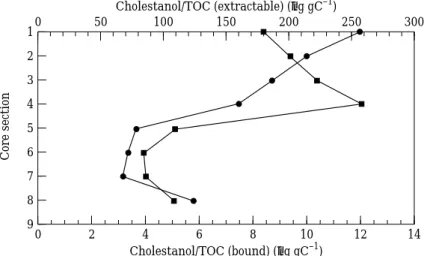
concen-trations are normalized to TOC, and their variations, both extractable and bound, vs. depth are given in Figures 2–4. It can be seen that the concentrations of extractable Ócoprostanol and cholestanol increase down the core in the upper layer (Sections 1–4). However, extractable cholesterol (top three sections) shows the opposite trend relative to the two stanols. The increase of stanol and decrease of stenol with depth indicates that hydrogenation of stenol (Gaskell & Eglinton, 1975) was occurring in the upper layer.
T 1. Redox potentials (mV) in sediment cores from the Tan-Shui estuary
Depth (cm) Core 1 2 3 4 5 6 0·0–2·5 "16 4 11 5 "30 "70 2·5–5·0 "112 "96 "7 "49 "59 "95 5·0–7·5 "142 "160 "6 "77 "140 "170 7·5–10·0 "114 "180 "21 "129 "152 "218 10·0–12·5 "179 "176 "41 "162 "147 "194 12·5–15·0 "209 "119 "83 "169 "140 "215 15·0–17·5 "217 "172 "122 "149 "222 "113 17·5–20·0 "216 "150 "139 "160 "119 "152 20·0–22·5 "148 "192 "157 "133 "90 "208 22·5–25·0 "230 "161 "181 "129 "171 "252 25·0–27·5 "214 "152 "120 "168 "131 — 27·5–30·0 "96 "123 "134 "172 "111 — 30·0–32·5 "213 "60 "163 "182 "186 — 32·5–35·0 "134 "155 "81 "42 — — 35·0–37·5 "200 "171 "39 "195 — — 37·5–40·0 "125 "177 "60 "58 — — 40·0–42·5 "206 "110 "108 "55 — — 42·5–45·0 "172 — "72 "96 — — 45·0–47·5 "217 — "100 "66 — —
T 2. Concentrations (ì gg " 1) o f extractable coprostanol, cholestanol and cholesterol in Core A from the Tan-Shui estuary Core section a Coprostanol (ì gg " 1) Epicoprostanol (ì gg " 1) Ó Coprostanol b (ì gg " 1) Cholestanol (ì gg " 1) Cholesterol (ì gg " 1) Ó Coprostanol Cholesterol Cholestanol Cholesterol TOC (%) 1 3·80 1·33 5·13 2·94 2·40 2·14 1·23 1·63 2 4·46 1·53 5·99 3·63 2·48 2·42 1·46 1·81 3 6·08 1·11 7·19 4·62 2·58 2·79 1·79 2·08 4 4·46 1·42 5·88 4·16 2·32 2·53 1·79 1·61 5 1·68 1·06 2·74 1·92 1·37 2·00 1·40 1·75 6 1·34 0·64 1·98 1·48 1·17 1·69 1·26 1·75 7 1·63 1·18 2·81 1·79 1·30 2·16 1·38 2·08 8 1·96 0·92 2·88 1·88 1·65 1·75 1·14 1·72 Average 2·19 1·43 aNumbered from the core top and sectioned at 5-cm intervals. bÓ Coprostanol = coprostanol + epicoprostanol (5 â -cholestan-3 á -ol). TOC, total organic carbon.
This is thought to be attained by: (1) constant input sources; (2) constant degradation rates (or possibly no degradation); and (3) greater production than degradation of
stanols. In the lower layer (Sections 5–8), however, extractable Ócoprostanol,
chol-estanol and cholesterol all exhibit a similar variation with depth but no depth trend. The reason for this remains unclear. However, one possible factor that might be associated with it is that the redox gradients (or redoxclines) in the sediments around Core A are generally in the top 15–25 cm (Table 1). Beyond the redox gradients, redox potentials stop dropping and fluctuate with depth. In other words, the strength of anoxicity in
the lower layer stops increasing and is weakened, consequently affecting sterol
hydrogenation.
Linear regression of extractable Ócoprostanol and cholestanol vs. depth (using the
mean depth of each core section) for the upper layer gives the following equations: ∑Coprostanol/TOC (extractable) (µg gC–1) 100 1 9 0 ∑Coprostanol/TOC (bound) (µg gC–1) Core section 6 2 3 4 5 7 8 20 40 60 80 400 0 100 200 300
Figure 2. Depth profiles of Ócoprostanol (normalized to total organic carbon) for
Core A from the Tan-Shui estuary.-, Bound; /, extractable. Cholestanol/TOC (extractable) (µg gC–1) 14 1 9 0 Cholestanol/TOC (bound) (µg gC–1) Core section 10 6 2 3 4 5 7 8 2 4 6 8 12 300 0 50 100 150 200 250
Figure 3. Depth profiles of cholestanol (normalized to total organic carbon) for Core A from the Tan-Shui estuary.-, Bound; /, extractable.
Ócoprostanol/TOC=3·3 depth+306 (r=0·999)
cholestanol/TOC=5·1 depth+164 (r=0·990)
whereÓcoprostanol/TOC and cholestanol/TOC are in ìg gC"1and depth is in cm. It
is interesting to note that the slope for cholestanol (5·1) is greater than that for Ócoprostanol (3·3). This is attributed to the fact that the 5á stanol is thermodynamically
more stable than its 5â epimer (Van Graas et al., 1982). Therefore, the sedimentary
reduction process of cholesterol gives rise to stanol mixtures in which 5á stanol
predominates (Gaskell & Eglinton, 1975; Nishimura & Koyama, 1977; Boudou et al., 1986; Robinson et al., 1986).
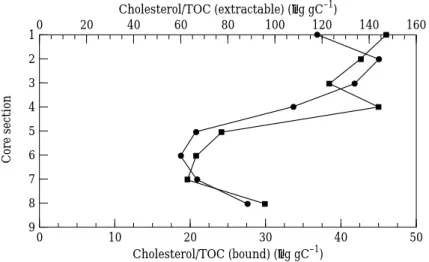
Coprostanol is only found in the faeces of higher mammals and is nearly human-specific (Walker et al., 1982), especially in urbanized estuaries where human waste predominates. Cholestanol is not a common constituent of most organisms but has been found in some living organisms (Nishimura & Koyama, 1977). Compared with these two stanols having relatively limited sources, cholesterol is quantitatively the most important sterol of animals (Tissot & Welte, 1978) and widespread in plant life (Volkman, 1986). The concentration of cholesterol in sediment depends on the amount of input sources during deposition; therefore, irregular variation with depth may result. The concentration of extractable cholesterol in Section 4 may result from a large input (Figure 4).
Table 3 presents the concentrations of bound sterols. In Figures 2 and 3, excluding
the Section 8 data point, both boundÓcoprostanol/TOC and cholestanol/TOC exhibit
a decrease with core depth and no pronounced concentration change between Sections 4 and 5. It appears that bound stanols are not influenced markedly by the enhanced sewage input change. The decreasing trend with depth might be ascribed to assimilation by bacteria and/or chemical decomposition. Lee et al. (1977) studying sterol diagenesis in recent sediments from Buzzards Bay found that extractable sterols decreased in concentration while bound sterols increased in concentration with depth. From this result, they inferred that a transformation between extractable and bound sterols
Cholesterol/TOC (extractable) (µg gC–1) 50 1 9 0 Cholesterol/TOC (bound) (µg gC–1) Core section 6 2 3 4 5 7 8 20 40 10 30 160 0 20 40 60 80 100 120 140
Figure 4. Depth profiles of cholesterol (normalized to total organic carbon) for Core A from the Tan-Shui estuary.-, Bound; /, extractable.
appeared to be occurring over the entire core. However, it is worthy of note that their depth trends are the reverse of those found in the present study. The main cause of this
difference is that the core was in a reducing environment in the present study. It is quite
probable that extractable stanol formation rates greatly exceed sterol degradation rates. Percent bound sterols are calculated as follows:
% Bound=[Bound/(Extractable+Bound)]#100
The results are presented in Table 4. It is noted that the averages of percent bound
sterols are in the order, cholesterol>Ócoprostanol>cholestanol. Before diagenesis, it is
assumed that the three sterols have about the same percentage of bound fractions. Part of the extractable cholesterol is transformed into stanols during diagenesis resulting in an increase in percent bound cholesterol. At the same time, extractable coprostanol and cholestanol increased due to diagenesis, thus decreasing the percent bound stanol. As mentioned above, since there is less diagenetic coprostanol than diagenetic cholestanol,
there is more percent boundÓcoprostanol than percent bound cholestanol.
Acknowledgements
We are grateful to referees for constructive comments. This study was financially supported by the National Science Council, Republic of China.
T 3. Concentrations (ìg g"1) of bound coprostanol, cholestanol and cholesterol in Core A from the Tan-Shui estuary
Core section Coprostanol (ìg g"1) Epicoprostanol (ìg g"1) ÓCoprostanol (ìg g"1) Cholestanol (ìg g"1) Cholesterol (ìg g"1) 1 1·24 0·22 1·46 0·19 0·61 2 1·20 0·22 1·42 0·19 0·81 3 1·11 0·21 1·32 0·18 0·87 4 0·66 0·15 0·81 0·12 0·54 5 0·35 0·10 0·45 0·065 0·36 6 0·29 0·10 0·39 0·059 0·33 7 0·28 0·13 0·41 0·066 0·44 8 0·52 0·15 0·67 0·099 0·49
T 4. Percent bound Ócoprostanol, cholestanol and cholesterol in Core A from the Tan-Shui estuary
Core
section ÓCoprostanol Cholestanol Cholesterol
1 22 6·1 20 2 19 5·0 25 3 16 3·8 25 4 12 2·8 19 5 14 3·3 21 6 16 3·8 22 7 13 3·6 25 8 19 5·0 23 Average 16 4·2 23
References
Bartlett, P. D. 1987 Degradation of coprostanol in an experimental system. Marine Pollution Bulletin 18, 27–29.
Boudou, J. P., Trichet, J., Robinson, N. & Brassell, S. C. 1986 Lipid composition of a Recent Polynesian microbial mat sequence. Organic Geochemistry 10, 705–709.
Brown, R. C. & Wade, T. L. 1984 Sedimentary coprostanol and hydrocarbon distribution adjacent to a sewage outfall. Water Research 18, 621–632.
Gaskell, S. J. & Eglinton, G. 1975 Rapid hydrogenation of sterols in a contemporary lacustrine sediment.
Nature 254, 209–211.
Gaudette, H. E., Flight, W. R., Toner, L. & Folger, D. W. 1974 An inexpensive titration method for the determination of organic carbon in recent sediments. Journal of Sedimentary Petrology 44, 249–253. Goodfellow, R. M., Cardoso, J., Eglinton, G., Dawson, J. P. & Best, G. A. 1977 A faecal sterol survey in
the Clyde Estuary. Marine Pollution Bulletin 8, 272–276.
Hatcher, P. G. & McGillivary, P. A. 1979 Sewage contamination in the New York Bight. Coprostanol as an indicator. Environmental Science and Technology 13, 1225–1229.
Jasper, J. P. & Gagosian, R. B. 1993 The relationship between sedimentary organic carbon isotopic composition and organic biomarker compound concentration. Geochimica Cosmochimica Acta 57, 167–186.
Jeng, W. L. & Han, B. C. 1991 Coprostanol as an indicator of environmental pollution on the western coast of Taiwan. Journal of the Chinese Environmental Protection Society (ROC) 14, 38–47.
LeBlanc, L. A., Latimer, J. S., Ellis, J. T. & Quinn, J. G. 1992 The geochemistry of coprostanol in waters and surface sediments from Narragansett Bay. Estuarine, Coastal and Shelf Science 34, 439–458. Lee, C., Gagosian, R. B. & Farrington, J. W. 1977 Sterol diagenesis in recent sediments from Buzzards Bay,
Massachusetts. Geochimica Cosmochimica Acta 41, 985–992.
McCalley, D. V., Cooke, M. & Nickless, G. 1980 Coprostanol in Severn Estuary sediments. Bulletin of
Environmental Contamination and Toxicology 25, 374–381.
McCalley, D. V., Cooke, M. & Nickless, G. 1981 Effect of sewage treatment on faecal sterols. Water
Research 15, 1019–1025.
Muller, G., Kanazawa, A. & Teshima, S. I. 1979 Sedimentary record of fecal pollution in part of Lake Constance by coprostanol determination. Naturwissenschaften 66, 520–522.
Nishimura, M. 1978 Geochemical characteristics of the high reduction zone of stenols in Suwa sedi-ments and the environmental factors controlling the conversion of stenols into stanols. Geochemica
Cosmochimica Acta, 42, 349–357.
Nishimura, M. 1982 5â-isomers of stanols and stanones as potential markers of sedimentary organic quality
and depositional paleoenvironments. Geochimica Cosmochimica Acta 46, 423–432.
Nishimura, M. & Koyama, T. 1977 The occurrence of stanols in various living organisms and the behavior of sterols in contemporary sediments. Geochimica Cosmochimica Acta 41, 379–385.
Readman, J. W., Preston, M. R. & Mantoura, R. F. C. 1986 An integrated technique to quantify sewage, oil and PAH pollution in estuarine and coastal environments. Marine Pollution Bulletin 17, 298–308. Robinson, N., Cranwell, P. A., Eglinton, G., Brassell, S. C., Sharp, C. L., Gophen, M. & Pollingher, U.
1986 Lipid geochemistry of Lake Kinneret. Organic Geochemistry 10, 733–742.
Tissot, B. P. & Welte, D. H. 1978 Petroleum Formation and Occurrence. Springer-Verlag, Berlin, p. 41. Van Graas, G., Baas, J. M. A., van de Graaf, B. & de Leeuw, J. W. 1982 Theoretical organic geochemistry.
I. The thermodynamic stability of several cholestane isomers calculated by molecular mechanics.
Geochimica Cosmochimica Acta 46, 2399–2402.
Venkatesan, M. I. & Kaplan, I. R. 1990 Sedimentary coprostanol as an index of sewage addition in Santa Monica Basin, southern California. Environmental Science and Technology 24, 208–214.
Volkman, J. K. 1986 A review of sterol markers for marine and terrigenous organic matter. Organic
Geochemistry 9, 83–99.
Walker, R. W., Kun, C. K. & Litsky, W. 1982 Coprostanol as an indicator of fecal pollution. CRC Critical
Reviews in Environmental Control 12, 91–112.
Yde, W., DeWulf, E., DeMaeyer-Cleempoel, S. & Quaghebeur, D. 1982 Coprostanol and bacterial indicators of fecal pollution in the Scheldt Estuary. Bulletin of Environmental Contamination and