Received 28 February 2005; received in revised form 5 September 2005; accepted 22 March 2006 Available online 28 April 2006
Abstract
The leachate from methanogenic landfill normally contains low concentrations of heavy metals. Little samples had ever been collected from the full-scale landfill piles owing to technical difficulty for well drilling. We drilled two wells in Hangzhou Tianziling landfill, 20 m and 32 m in depth each, and collected solid samples of waste age of 1–4 years from both wells. The total amounts, the sequentially extracted amounts, and the chemical binding forms of heavy metals of the samples collected at different depths were measured. With the correlation between leachate production amount and the yearly rainfall amount, the leached ratio of the heavy metals were estimated only 0.13%, 1.8%, 0.15%, and 0.19% of Cu, Cd, Pb, and Zn, respectively. The heavy metals amounts in the main compositions of MSW, like glass, food waste, paper, coal cinders, were measured using fresh MSW samples. Afterward, the contents of heavy metals initially landfilled were estimated. A positive correlation was noted between the measured and the estimated initial contents of heavy metals, indicating that the low migration of heavy metals in landfill layers. However, among the metals investigated, Zn has shown better mobility inside landfill layers.
Acid volatile sulfide (AVS) and the simultaneously extracted metals (SEM) were measured for all collected samples with optimal reaction conditions identified to yield nearly perfect sulfide recovery as follows: 100 g wet samples, 80 mL min−1N2flow rate, reaction time of 150 min.
The SEM/AVS ratios ranged 25–45, indicating that the AVS was insufficient to immobilize the SEM. Sequential extraction using six-fraction scheme revealed that the sum of exchangeable and the avid soluble fractions of heavy metals follow: Zn > Cd > Cu, Ni, Pb > Cr. The insoluble fraction of heavy metals in MSW was high, for instance, over 80% for Cr and Pb high insoluble fractions of heavy metals in the landfilled MSW and the sorption capability of the methanogenic landfill layers should be responsible to the low concentrations of heavy metals found in leachate. © 2006 Elsevier B.V. All rights reserved.
Keywords: Municipal solid waste; Landfill; Heavy metals; Mobilization; Chemical speciation
1. Introduction
The leachate from methanogenic landfill contains low con-centrations of heavy metals [1–3]. The evaluation of metal release potential from landfill needs the information of the total deposited refuse amount, its composition, and the historical records of the leachate quality. With limited data, the worse-case simulation could be achieved by analyzing the leachate quality at present time[4].
Bozkurt et al.[5]claimed that the mature refuse contained a high sorption capacity of heavy metals. The sulfide
precipi-∗Corresponding author. Tel.: +86 21 6598 6104; fax: +86 21 6598 6104. E-mail address:[email protected](P.-J. He).
tation corresponded to the low heavy metal concentrations in methanogenic leachate[6,7]. For Cr, which could hardly form insoluble sulfide precipitates, Jensen and Christensen [8] pro-posed that the hydroxide precipitate should be able to bind it firmly in landfill. The ratio of the simultaneously extracted met-als (SEM) and acid volatile sulfide (AVS), SEM/AVS, has been used to correlate the bioavailability of heavy metals in sediments
[9–13]. At a low SEM/AVS, most heavy metals are claimed to
bind in sulfide form and should not be available under anaer-obic environment. Martensson et al. [15]noted that the AVS of landfill leachate is far from sufficient to bind most SEM in the landfill. Hydroxide precipitate could form instead at pH above neutral as normally noted for methanogenic leachate[16]. Gounaris et al.[17]and Jensen and Christensen[8]noted that a large fraction of heavy metals was associated with the colloidal
0304-3894/$ – see front matter © 2006 Elsevier B.V. All rights reserved. doi:10.1016/j.jhazmat.2006.04.033
Fig. 1. Main ingredients of MSW of Hangzhou City over 1990–2003.
particles in landfill leachate. Klein and Nissner[18]found that the humic substance dominated colloidal particles in landfill leachate bound the main fraction of heavy metals in leachate. Kjeldsen et al.[19]comprehensively reviewed pertinent litera-ture on leachate characteristics from MSW landfill.
To monitor the landfill leachate alone is hard to interpret why the mass amount of heavy metals could be immobilized in the landfill. However, to sample in situ is difficult in practice since the landfilled refuse contains texture to resist mechani-cal drilling. Also, the mechanimechani-cal strength of the landfill body is generally not high enough to stabilize the well’s wall. We drilled two wells in a full-scale landfill site, Tianziling land-fill in Hangzhou, which is the first sanitary landland-fill site in PR China, and collected samples at different depths. The contents and the chemical binding forms of heavy metals of the samples collected at different depths were measured and profiled in this work.
2. Materials and methods 2.1. The landfill
The Tianziling landfill has received MSW from Hangzhou City since April 1991.Fig. 1shows the main compositions of the collected MSW. The food waste presents a major compo-sition which occupies more than 50% (wet basis) since 1992. Since the road dust was landfilled on the other site, its fraction reduced dramatically since year 1996. Coal was widely applied as household fuel over 1998–2002, which has been replaced by town-gas since 2003. The coal cinders presented up to 20% of the MSW around 2000, and had not appeared since 2003. The raw MSW apparently has a significant impact on the spatial changes of compositions in a landfill site.
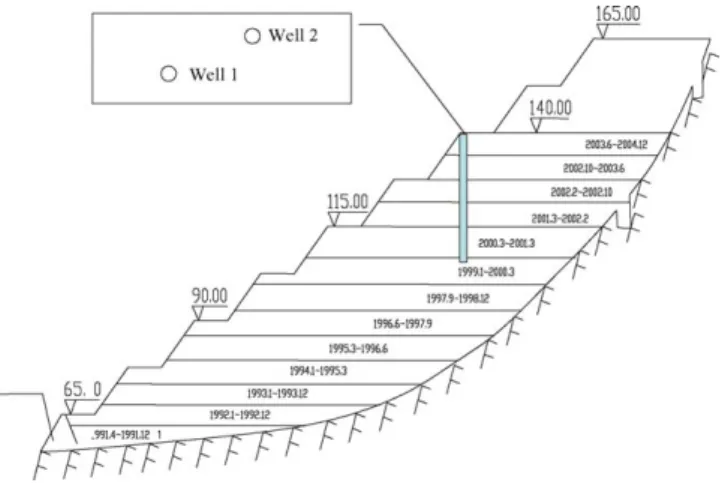
The cross-section of the landfill site is profiled in Fig. 2, with bottom liners located at 54 m above sea level. The design capacity is 6,000,000 m3and will be closed at the end of 2005, and the top of the landfill will reach 165 m above sea level. The matured waste was located at bottom layers and the fresh one at top layers. For instance, the MSW of year 1999 was filled over the height of 102.5–110.0 m above sea level, and that of year 2002 over 127.5–135.0 m. Two wells of depth 20 m and 32 m were drilled at the landfill site from the layer located 140 m above sea level, whose locations were also depicted inFig. 1for
Fig. 2. The landfill site and the sampling wells.
demonstration purpose. The sampled MSW layer had a waste age of 1–4 years old.
2.2. The samples
The samples were collected at depths of 5 m, 10 m, 15 m and 20 m in well 1, and of 5 m, 15 m, 25 m and 32 m in well 2, respectively. The physical characteristics of the MSW at differ-ent sites and depths are shown inTable 1. The bulk materials such as glass, plastic, textile, stone had been removed from the collected samples. The remaining part of the collected sample is the sample materials for further examination (the sample (a) in
Table 1), occupying 46–84% (wet basis) of the collected
sam-ples from the wells. The moisture contents of the wet samsam-ples were also listed in the last column of this table. Part of the sam-ples were sealed in polyethylene black bag and kept at 4◦C in a refrigerator for AVS determination[9,10]. The rest of samples were air-dried and shredded into fine grain which was less than 2 mm size for other analysis items[11,12].
2.3. Methods and apparatus 2.3.1. Element analysis
The C, H, S contents in the collected samples (the sample (a)
inTable 1) was analyzed using the LECO CHNS-932 elemental
analyzer (LECO Corp., USA), and TKN measurement has been conducted for the N content in the collected samples.
2.3.2. Total amounts of heavy metals
The shredded samples were digested with a HCl–HNO3–
HF–HClO4[20]mixture according to the procedure described
below: (1) Adding 0.2000–0.5000 g sample accurately into a 50 mL-crucible (PTFE). (2) The sample was first digested with 10 mL hydrochloric acid in an open crucible on a heat plate, whose temperature was about 200◦C. Digestion stopped when the hydrochloric acid was left less than 3 mL. (3) Adding nitric acid (5 mL), hydrofluoric acid (5 mL) and perchloric acid (3 mL) in turn. After the crucible was lidded the sample was also heated for 1 h. Then crucible was kept open and shaken occasionally to lose of silicon by its vaporization. The crucible was lidded
T able 1 Physical characteristics of the MSW at dif ferent sites and depths MSW Depth (m) pH Or ganic matters (%, w/w) Inor ganic matters (%, w/w) Bulk material remo v ed (%, w/w) Animal Plant Clay Porcelain P aper Plastic/rubber T extile Glass Metals W ood/bamboo W ell 1 5 6.88 0.0 0.0 0.0 5.2 0.0 16.8 5.9 0.0 0.4 1.7 10 7.27 0.0 0.0 0.0 4.4 0.0 5.2 4.0 0.0 0.5 2.1 15 8.29 0.0 0.0 0.0 2.3 0.0 27.7 2.8 0.0 0.0 2.9 20 8.60 0.0 0.0 0.0 4.9 0.0 7.0 4.2 0.5 0.0 5.1 W ell 2 5 7.85 0.0 0.0 0.0 0.6 0.0 14.4 7.8 0.0 3.1 0.0 15 8.58 0.0 0.0 0.0 1.7 0.0 6.1 12.4 0.0 0.7 3.5 25 9.00 0.0 0.0 0.0 6.2 0.0 26.6 13.9 0.0 5.5 1.8 32 8.62 0.0 0.0 0.0 6.4 0.0 12.2 0.0 0.1 0.0 0.0 aThe samples mentioned here were the sampled refuses with b ulk materials such as glass, plastic, te xtile, stone and pottery remo v ed.
The sequential extraction procedures as follows were adopted to differentiate metals in the sampled waste into different frac-tions[11,12]:
(1) Exchangeable fraction: 10 mL of 1 M NH4Ac (pH 7) were
added to 1.00 g shredded dry sample in a 50 mL plastic cen-trifuge tube. The mixture was continuously agitated (using a mechanical shaker) for 2 h and then centrifuged (3000 rpm for 30 min). The supernatant solution was retained and used for analysis.
(2) Acid soluble fraction: 10 mL of distilled water were added to the residue from step (1) and centrifuged for 30 min. 10 mL of NaAc and HAc mixture (pH 5) were added to the residue. The mixture was agitated for 5 h and centrifuged. The super-natant solution was used for analysis.
(3) Easily reducible fraction: 10 mL of distilled water were added to the residue from step (2) and centrifuged for 30 min. Twenty milliliters of 0.1 M NH2OH·HCl (pH 2)
were added to the residue from step (2). The mixture was agitated for 12 h and centrifuged. The supernatant solution was used for analysis.
(4) Moderately reducible fraction: 20 mL of 0.1 M oxalate buffer (pH 3) were added to the residue from step (3). The mixture was agitated for 24 h and centrifuged. The super-natant solution was used for analysis.
(5) Oxidizable fraction: 20 mL of 30% H2O2(pH 3) were added
to the residue from step (4). The mixture was heated to 90◦C until most of the hydrogen peroxide was evaporated. Following this treatment, 20 mL of 1 M NH4Ac (pH 7) were
added to the residue. The mixture was agitated for 12 h and centrifuged. The supernatant solution was used for analysis. (6) Insoluble fraction: the residue from step (5) was dried at 105◦C for 2 h and weighed. Then less than 0.5 g residue was digested following the same procedures in Section2.3.2.
2.3.4. AVS and SEM measurements
Procedures for the determination of AVS and SEM in Allen and van Griethuysen [13,14]were adopted here. The appara-tus for measuring AVS and SEM of the landfill samples were shown inFig. 3. Firstly nitrogen was deoxygenated by vanadous deoxygenating reagent in the first gas-washing bottle (3), then it was washed again by distilled water in the second gas-washing bottle (4). Hundred grams wet sample was placed in a 1000 mL flask (6) with stirring. Before test, the system was deoxygenated using nitrogen. Then 6 M HCl was added to the sample flask to keep HCl concentration in the mixture to be 1 M[9,13]. Bottles (7) and (8) were H2S trap containing 0.5 M NaOH. The trapped
Fig. 3. Apparatus for measuring AVS and SEM in the landfill samples: (1) N2 cylinder; (2) flow controller; (3) 500 mL gas-washing bottles, containing oxy-gen scrubbing solution; (4) 500 mL gas-washing bottles, containing deionized water; (5) stirrer; (6) 1000 mL reaction flask (7) and (8) 200 mL trapping bottles, containing 80 mL 0.5 M NaOH solution.
H2S was analyzed by colorimetric methods, and the solubilized
metals (SEM) determined by AAS.
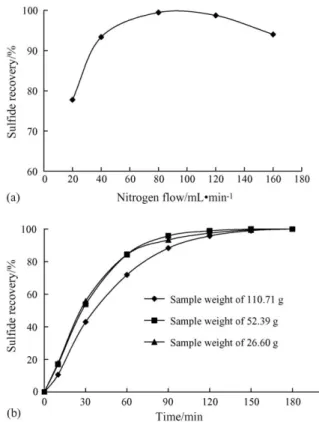
To approach the appropriate testing conditions for AVS/SEM, a standard solution containing 123.7 mg L−1 (10 mL) sulfide was used as the testing material. For N2 flow rates ranging
60–100 mL min−1, the AVS recovery exceeded 95%, especially, reached 99% at a flow rate of 80 mL min−1(Fig. 4a). We hence fixed the N2flow rate used in further analysis at 80 mL min−1.
Fig. 4b shows the recovery of H2S at different sample weight
at a N2flow rate of 80 mL min−1. Apparently when the
sam-ple weight is less than 110 g in the 1000 mL flask, the recovery reaction could be complete in less than 120 min. Therefore, in the subsequent analysis, the reaction conditions were fixed as: 100 g wet samples, 80 mL min−1N2flow rate, reaction time of
150 min.
3. Results and discussion 3.1. Element analysis results
The results for the shredded samples are shown inTable 2. Most nitrogen has been leached out in the landfill, as shown by little nitrogen content in the collected samples, as a result of sufficient hydrolysis occurred in the landfilled MSW. The carbon content ranged 9.1–15.3% (w/w). The sulfur content was about 0.2–0.5% (w/w) in the collected samples.
Fig. 4. (a) Effects of nitrogen flow rate on the recovery of H2S from Na2S suspension, 180 min. (b) Effects of sample weight and reaction time on the recovery of H2S from sample.
3.2. The heavy metals in landfill
Table 3shows the heavy metal contents of collected samples.
The contents follow the sequence: Zn > Pb > Cr > Cu > Ni > Cd. The heavy metal contents in landfill layers are much higher than those in surface soil samples as the backgrounds. Based on the average heavy metal contents of collected samples in the drilled well and the yearly landfill records, the total amount of Cd, Cu, Pb, and Zn in the landfill could be estimated as 8.7 tonnes, 222 tonnes, 548 tonnes, and 808 tonnes, respectively (calculated
fromTable 4). Hence, the pollution potentials of the heavy metals
from landfill leachate should be extremely high.
Based on the historical records of the precipitation and leachate production in the landfill over the past decade, the leachate production rate could be estimated by the yearly average rainfall rate with the follow equation: (leachate production rate (10,000 tonnes) = 0.0042× rainfall (mm a−1), with r2= 0.97).
Table 2
Elemental analysis for collected samples (the sample (a) inTable 1)
MSW Depth (m) C (%, w/w) H (%, w/w) TKN (%, w/w) S (%, w/w) Well 1 5 9.8 1.18 0.7 0.222 10 15.3 2.09 0.5 0.367 15 11.2 1.28 0.5 0.268 20 9.1 1.13 0.3 0.372 Well 2 5 14.8 1.68 0.6 0.252 10 9.3 1.03 0.3 0.543 15 10.4 1.27 0.3 0.289 20 10.2 1.18 0.3 0.216
T able 3 The hea vy metal contents of collected samples from landfill at dif ferent depths and the estimated contents landfilled with the original MSW based on the historical landfill measured for main ingredients of the MSW MSW Depth (m) Cd ( gg − 1)C u ( gg − 1)C r ( gg − 1)P b ( gg − 1)N i ( gg − 1)Z Sample Original a Sample Original a Sample Original a Sample Original a Sample Original W ell 1 5 6.1 ± 0.70 5.2 107 ± 1.1 45.0 456 ± 13.5 74.3 347 ± 0.3 241.7 58.3 ± 5.5 59.6 10 5.4 ± 0.89 5.3 133 ± 10.8 44.9 456 ± 51.4 73.5 777 ± 49.4 217.9 54.8 ± 7.4 65.4 15 4.9 ± 0.22 5.3 148 ± 10.2 44.5 545 ± 7.6 72.9 237 ± 10.1 212.6 73.5 ± 0.8 65.2 20 4.7 ± 0.35 5.4 133 ± 4.6 45.6 352 ± 35.7 75.0 665.4 219.7 39.6 ± 5.7 68.1 W ell 2 5 4.9 ± 0.69 5.2 178 ± 4.5 45.0 490 ± 79.2 74.3 259 ± 23.7 241.7 76.8 ± 2.4 59.6 15 11.3 ± 0.57 5.3 320 ± 1.7 44.5 454 ± 19.3 72.9 206 ± 16.2 212.6 101 ± 3.4 65.2 25 6.8 ± 0.43 5.4 146 ± 0.7 45.6 323 ± 4.9 75.0 528 ± 10.5 219.7 82.9 ± 11.5 68.1 32 7.4 ± 0.86 5.4 165.9 45.7 503 ± 227 74.9 265 ± 9.0 215.6 90.3 ± 5.6 69.4 Surf ace soil 1 b 0.070 ± 0.059 17.6 ± 12.9 52.9 ± 43.0 23.7 ± 6.8 24.6 ± 11.9 Surf ace soil 2 b 0.065 ± 0.056 21.0 ± 17.5 54.5 ± 31.8 24.0 ± 7.8 27.6 ± 11.9 Intermediate co v er materials 28.1 ± 1.1 462.5 ± 18.1 3238.3 ± 549.6 470.1 ± 132.8 135.1 ± 18.7 V alues are based on per gram of dried sample (the sample (a) in T able 1 ). aEstimated, original contents of hea vy metals in landfill. bThe surf ace soil samples were collected randomly in the same county of the landfill.
Fig. 5. The measured heavy metal contents and the estimated, initial contents for landfill layers. Circles denote the samples collected at bottom layers of the two wells.
The leachability of the heavy metals could also be estimated according to the historical records of the heavy metal contents in leachate from the landfill.
Over year 1993–2003, the leached amounts of Cu, Cd, Pb, and Zn are 282 kg, 166 kg, 823 kg, and 1560 kg, respectively, representing only 0.13%, 1.8%, 0.15% and 0.19% of the total amount presented (estimated) in the landfill (Table 4). This result consists with the previous works that the heavy metals in landfill leachate are generally low in concentrations[1–3].
To clearly identify the pollution sources, the main composi-tions of MSW, like glass, food waste, paper, coal cinders, were collected from MSW collection station and their total heavy metal contents were separately measured (Table 5). Based on
Fig. 1, the amounts of compositions of landfilled MSW in year
2000 followed: food waste > paper > plastics > coal cinder, dust; while in 2003, food waste > plastics > paper > dust, with negligi-ble coal cinder. Since most food waste and paper were degraded, and since the dust was not physically separable from the samples collected from landfill wells (Table 1), their incorporated heavy metals may be contributing to the measured amounts inTable 3.
3.3. Mobility of heavy metals in landfill
Based on the historical record in Figs. 1 and 2 and the heavy metal measurements in Table 5, the heavy metal con-tents landfilled with the original MSW over 1999–2003 could be estimated, which were also shown inTable 3for comparison. The heavy contents in samples collected at different depths are all higher than the estimated, original values. This observation is attributable to the significant reduction in MSW mass after hydrolysis and degradation, and the possible immobilization of the heavy metals in the landfill layers.[21]
Since the refuse would undergo different stages of degrada-tion over various landfill ages, it is not fair to compare the heavy metal contents sampled at different depths. However, at a given sampling point, since the organic degradation level is the same, the herein measured six metals are on the same comparison basis (gram of dried solids). Hence, the data inTable 3were plotted
Table 4
Precipitation, leachate production, heavy metals concentrations and migration rate of past 11 years from 1993 to 2003
Year Sum 1993 1994 1995 1996 1997 1998 1999 2000 2001 2002 2003 Landfilled MSW [12](104 tonnes) 32 38 42 44.7 49 52.4 57.2 61.5 64.5 71.9 76.1 589.3 Precipitation [12,13](mm) 1751 1399 1449 1482 1435 1538 1824 1198 1567 1744 854 – Leachate production (104tonnes)a 77.4 61.8 64.0 65.5 63.4 68.0 80.6 53.0 69.0 72.1 31.8 706.6 Concentrations (mg L−1)b Cu 0.025 0.027 0.046 0.038 0.038 0.050 0.057 0.045 0.035 0.038 0.038 – Cd 0.012 0.014 0.021 0.022 0.022 0.055 0.034 0.012 0.017 0.022 0.022 – Pb 0.166 0.044 0.056 0.112 0.112 0.105 0.210 0.103 0.109 0.112 0.112 – Zn 0.119 0.115 0.121 0.245 0.245 0.331 0.261 0.260 0.249 0.245 0.245 – Leached amount (kg)c Cu 19.4 16.7 29.4 24.9 24.1 34.0 45.9 23.9 24.2 27.4 12.1 282 Cd 9.3 8.7 13.4 14.4 13.9 37.4 27.4 6.4 11.7 15.9 7.0 166 Pb 129 27.2 35.8 73.4 71.0 71.4 169.3 54.6 75.2 80.8 35.6 823 Zn 92.1 71.1 77.4 161 155 225 210 138 172 177 77.9 1560 Migration rates (‰)d Cu 0.09 0.08 0.13 0.11 0.11 0.15 0.21 0.11 0.11 0.12 0.05 1.3 Cd 1.07 0.99 1.55 1.66 1.60 4.30 3.15 0.73 1.35 1.82 0.80 19.0 Pb 0.23 0.05 0.06 0.13 0.13 0.13 0.31 0.10 0.14 0.15 0.07 1.5 Zn 0.11 0.09 0.10 0.20 0.19 0.28 0.26 0.17 0.21 0.22 0.10 1.9
a(Leachate production (10,000 tonnes)) = 0.0042× (rainfall (mm)).
b There are no data for 1996, 1997, 2002 and 2003, and the average values of past years are taken.
cThe leached amount (kg) = (heavy metals concentrations in leachate of the year (mg L−1))× (leachate production (104tonnes))× 10. d The migration rates of heavy metals (‰) = (leached amount (kg))× 1000/(total amounts of heavy metals in landfill).
measured heavy metal contents and the estimated, initial con-tents. If the heavy metals were easily migrated, all heavy metals should be washed out. InFig. 5, however, a clearly positive cor-relation is noticeable for all cases. The data circled in Fig. 5
presented the samples collected at the bottom layers of wells. The heavy metals are thereby unlikely to move easily in the land-fill. All data located above the 45◦-line, mainly attributable to the degradation of organic matter to reduce the solids content.
However, the contents of Cr and Cu in the samples are much higher than in the original waste, which may be attributed to the intermediate cover materials, with extraordinary higher concen-tration of heavy metals, in the landfill (Table 3), although the mass amount of the intermediate cover materials was less than one tenth of the initially landfilled waste. The data of Zn and Pb deviated significantly from, while those of Ni located close to the 45◦-line (Fig. 5). Since the samples collected at the same
Table 5
The heavy metal contents of different ingredients in MSW
Ingredient Date Elements and contents (g g−1)
Cd Cu Cr Pb Ni Zn Paper 9-29-2004 3.4 25.2 35.6 39.3 22.8 73.0 10-27-2004 6.1 18.3 9.1 39.3 27.7 73.0 Plastics 9-29-200410-27-2004 3.39.7 44.945.6 68.67.2 119.054.5 224.837.0 259.6109.6 Glass 9-29-200410-27-2004 33.96.3 11.632.8 426.6363.6 130.084.8 170.238.3 378.480.2 Wood 9-29-2004 2.1 24.3 41.0 47.2 28.4 136.3 10-27-2004 4.4 19.6 36.7 24.7 20.9 40.1
Food waste (vegetation and animals) 9-29-2004 5.7 56.8 88.0 362.5 52.9 499.9 10-27-2004 5.1 43.7 35.6 56.4 52.9 121.6 Coal cinder 9-29-200410-27-2004 6.56.3 78.761.1 168.128.1 80.247.5 49.375.9 193.4255.2 Textile 9-29-2004 0.0 46.1 38.9 192.0 32.9 113.5 10-27-2004 5.0 50.9 58.3 215.6 148.1 52.8 Dust 9-29-200410-27-2004 –6.3 57.4– 83.7– 47.8– 151.7– 76.3–
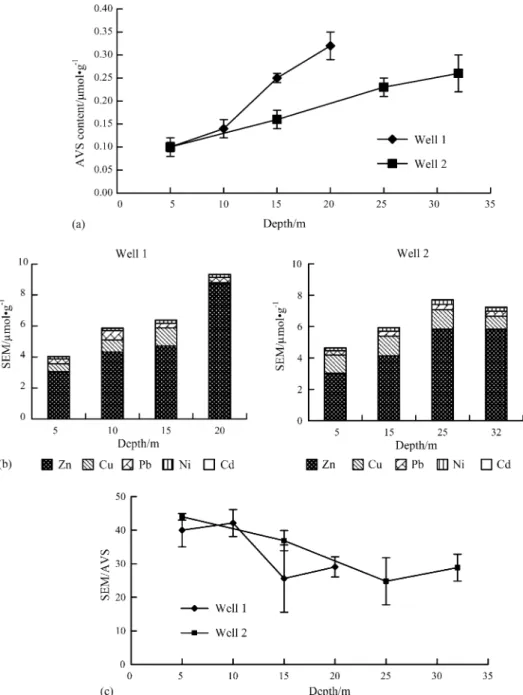
Fig. 6. (a) The AVS contents of the samples collected at different depths. (b) The SEM contents of the samples collected at different depths. (c) The SEM/AVS ratios of the samples collected at different depths.
depth should be having similar waste age, the noted difference (also shown inTable 3) revealed that the more percentage of Ni has been mobilized than Zn and Pb in landfill. However, since the leachate contains a low level of Ni, the heavy metals released in the upper landfill layers may be immobilized again in the bot-tom layers. Additionally, the Zn concentrations at botbot-tom layers (circled) were high than the initial concentrations, indicating the relatively high mobility of Zn in landfill.
3.4. Measurements of AVS and SEM
The AVS and SEM contents increase with increasing depths
(Fig. 6a and b). The AVS ranged 0.10–0.32mol g−1 for
well 1, and 0.10–0.26mol g−1 for well 2. Comparing with
the sulfur contents listed in Table 2 (2.2–5.4× 10⁻³g g−1 or 68.8–169mol g−1), only a small fraction of sulfur was present in sulfide form (or the forms soluble in 1 M HCl). The AVS tends to move downward in the landfill. The mobility of sulfide is affected by the local liquid pH, dropping from 6.8 to 7.8 at top layers to 8.6–9.0 at lower layers (Table 1). The sulfide is more readily fixed in environment at elevated pH values.
Hage and Mulder[22]have pointed out that the mobility of the heavy metals in the solid waste should be greatly dependent on pH in the liquid phase. Their results showed that at lower pH more components would be leached out than at neutral or alkaline conditions. As shown inTable 1, the pH of the collected samples raised from 6.8 to 7.8 at top layers to 8.6–9.0 at lower layers of landfill. The heavy metals in an easily mobilizing state
Fig. 7. Metal binding forms in the collected samples from well 1 and from well 2.
in the upper layers may move downward with leachate, and be fixed in the lower layers (Fig. 6b).
AsFig. 6b shows, the SEM mainly comprises of Zn (60–90%)
and Cu (up to 30%). Comparing with the total heavy metals in the landfill (Table 3), the content of Zn in SEM ranged 3–8 mol g−1, or 40–80% of the total Zn. The mobility of Zn appears higher than those of the other four metals, corresponding to the observa-tion noted inTable 3. Nonetheless, since the leachate contains a
low level of Zn2+, the heavy metals released in the upper landfill layers must be immobilized again in the bottom layers.
The resulting SEM/AVS ratios are much greater than 1, rang-ing 25–45, and show a decreasrang-ing trend with increasrang-ing depth
(Fig. 6c). The amount of AVS is insufficient to immobilize the
SEM, correlating with the results by Martensson et al.[15]that sulfide is not a key binder to heavy metals in landfill. Field monitoring at Tianziling landfill revealed a high
concentra-The exchangeable fractions of heavy metals follow: Cd > Zn > Cu > Ni > Pb > Cr. This fraction of heavy metals is easily removed by simple ion-exchange mechanisms, and corre-lated well with the leached amounts of heavy metals estimated
inTable 5. The strong complexiation of Cd2+and Cl−may result
in high mobilization rate of Cd in landfill[19], because of high level of Cl−in landfill leachate.
The acid soluble fractions of heavy metals may be released in acidic environment, account for the possible release during refuse hydrolysis stage. This fraction decreases in the following order: Zn > Cd > Pb > Ni > Cu > Cr. The sum of the exchange-able fraction and the acid soluble fraction present the part of metals which have potential to release during refuse hydrolysis stage, whose magnitudes follow: Zn > Cd > Cu, Ni, Pb > Cr. It is obvious fromTable 3that Zn showed a higher mobility than did the other metals investigated, correlating to the noted, highest content of exchangeable and acid soluble fractions noted herein. However, the leachate contains low levels of Zn, indicating that the leached Zn from the upper layers would be immobilized through certain mechanisms other than bound by sulfide at the bottom layers.
The insoluble fraction of heavy metals is not expected to be released in solution over a reasonable time span under the con-ditions normally encountered in nature[23]. Most heavy metals in landfill are noted in insoluble fraction. For Cr and Pb, this fraction exceeded 80%, and for Zn and Cu, at least 20% (w/w). The heavy metals in landfilled MSW were mostly in residue fraction, which should be responsible to low concentrations of heavy metals in the leachate.
4. Conclusions
This work profiled how the heavy metals distributed in a full-scale landfill site, Hangzhou Tianziling landfill. Two wells were drilled in the landfill, 20 m and 32 m in depth each, from which solid samples of waste age of 1–4 years were collected. The total amount, the sequentially extracted amounts, and the solid metals binding forms of heavy metals of the samples collected at different depths were measured and profiled. The heavy metal contents of collected samples follow the sequence: Zn > Pb > Cr > Cu > Ni > Cd, while the amounts in the land-fill were estimated as 8.7 tonnes, 222 tonnes, 548 tonnes, and 808 tonnes for Cd, Cu, Pb, and Zn, respectively. Based on the noted, linear relationship between leachate production rate and the yearly average rainfall rate, the leached ratio of Cu, Cd, Pb, and Zn with leachate were estimated only 0.13%, 1.8%, 0.15%
landfilled heavy metals amount could be estimated. Owing to the hydrolysis and degradation of MSW, the measured heavy metal contents in samples collected at different depths were all higher than the estimated, initial values. A positive correlation was noted to exist between the measure and the estimated ini-tial contents of heavy metals, indicating the low mobility of the metals in the landfill interior. Among the metals investigated, Zn has shown better mobility inside landfill layers.
Acid volatile sulfide and the simultaneously extracted metals were measured for all collected samples with optimal reaction conditions identified to yield nearly perfect sulfide recovery as follows: 100 g wet samples, 80 mL min−1N2 flow rate,
reac-tion time of 150 min. The AVS and SEM contents increase with increasing depths, with the former ranged 0.10–0.32mol g−1 for well 1 and 0.10–0.26mol g−1for well 2, and with the lat-ter, 4.1–9.4mol g−1and 4.3–7.8mol g−1, respectively. The SEM/AVS ratios ranged 25–45, indicating that the AVS was insufficient to immobilize the SEM. Most sulfur was leached out with leachate in the form of sulfate ions.
On the other hand, sequential extraction using six-fraction scheme revealed that the sum of exchangeable and the avid sol-uble fractions of heavy metals follow: Zn > Cd > Cu, Ni, Pb > Cr. This sum presented the fraction of heavy metals that had poten-tial to be released in the refuse hydrolysis stage, corresponding to the noted highest mobility for Zn in the landfill. However, field data showed that the Zn concentration in leachate remained low, indicating that the leached Zn from the upper layers would be immobilized through certain mechanisms other than sulfide at the bottom layers. The insoluble fraction of heavy metals was high, for instance, over 80% for Cr and Pb. The high insoluble fractions of heavy metals of landfilled MSW and the adsorption capability of the methanogenic landfill layers should be respon-sible to the low concentrations of heavy metals in leachate.
Acknowledgement
Support for this work by the Hi-Tech Research and Devel-opment Program (Nos. 2001AA644010, 2003AA644020) of China, is gratefully appreciated. Mention of trade names or commercial products does not constitute endorsement or rec-ommendation for use.
References
[1] P. Flyhammar, Analysis of the cadmium flux in Sweden with special empha-sis on landfill leachate, J. Environ. Qual. 24 (1995) 612–621.
[2] H. Belevi, P. Baccini, Water and element fluxes from sanitary landfills, in: T.H. Christensen, R. Cossu, R. Stegmann (Eds.), Sanitary Landfilling: Pro-cess, Technology and Environment Impact, Academic Press Ltd., London, 1989.
[3] C. Aulin, I. Neretnieks, Material balance for an industrial landfill, in: T.H. Christensen, R. Cossu, R. Stegmann (Eds.), Proceedings of the Sar-dinia 95, Fifth International Landfill Symposium, vol. III, CISA Envi-ronmental Sanitary Engineering Centre, Cagliari, Italy, 1995, pp. 173– 180.
[4] J.K. ´Øygard, A. Mage, E. Gjengedal, Estimation of the mass-balance of selected metals in four sanitary landfills in Western Norway, with emphasis on the heavy metal content of the deposited waste and the leachate, Water Res. 38 (2004) 2851–2858.
[5] S. Bozkurt, L. Moreno, I. Neretsson, Long-term fate of organics in waste deposits and its effect on metal release, Sci. Total Environ. 228 (1999) 135–152.
[6] T.H. Christensen, P. Kjeldsen, H.J. Albrechtsen, et al., Attenuation of land-fill leachate pollutants in aquifers, Crit. Rev. Environ. Sci. Technol. 24 (1994) 119–202.
[7] A.S. Erses, T.T. Onay, In situ heavy metal attenuation in landfills under methanogenic conditions, J. Hazard. Mater. B99 (2003) 159–175. [8] D.L. Jensen, T.H. Christensen, Colloidal and dissolved metals in leachates
from four Danish landfills, Water Res. 33 (9) (1999) 2139–2147. [9] Y.P. Hsieh, C.H. Yang, Diffusion methods for the determination of reduced
inorganic sulfur species in sediments, Limnol. Oceanogr. 34 (1989) 1126–1130.
[10] C.E. Pesch, D.J. Hansen, W.S. Boothman, et al., The role of acid-volatile sulphide and intersitial water metal concentrations in determining bioavail-ability of cadmium and nickel from contaminated sediments to the marine polychaete neanthes arenaceodentata, Environ. Toxicol. Chem. 14 (1) (1995) 129–141.
[11] P. Flyhammar, Estimation of heavy metal transformations in municipal solid waste, Sci. Total Environ. 198 (1997) 123–133.
[12] P. Flyhammar, Use of sequential extraction on anaerobically degraded municipal solid waste, Sci. Total Environ. 212 (1998) 203–215. [13] H.E. Allen, Analysis of acid-volatile sulphide (AVS) and simultaneously
extracted metals (SEM) for the estimation of potential toxicity in aquatic sediments, Environ. Toxicol. Chem. 12 (1993) 1441–1453.
[14] C. van Griethuysen, Measuring acid volatile sulphide in floodplain lake sediments: effect of reaction time, sample size and aeration, Chemosphere 47 (2002) 395–400.
[15] A.M. Martensson, C. Aulin, O. Wahlberg, et al., Effect of humic substances on the mobility of toxic metals in a mature landfill, Waste Manage. Res. 17 (1999) 296–304.
[16] D.R. Reinhart, C.J. Grosh, Analysis of Florida MSW landfill leachate qual-ity, Report 97-3, Florida Centre for Solid and Hazardous Management, Gainsville, FL, 1998.
[17] V. Gounaris, P.R. Anderson, T.M. Holsen, Characteristics and environmen-tal significance of colloids in landfill leachate, Environ. Sci. Technol. 27 (1993) 1381–1387.
[18] T. Klein, R. Nissner, Characterization of heavy-metal-containing seepage water colloids by flow FFF, ultrafiltation, ELISA and AAS, Mikrochim. Acta 129 (1–2) (1998) 47–55.
[19] P. Kjeldsen, M.A. Barlaz, A.P. Rooker, A. Baun, A. Ledin, T.H. Chris-tensen, et al., Present and long-term composition of MSW landfill leachate: a review, Crit. Rev. Environ. Sci. Technol. 32 (4) (2002) 297–336. [20] State Environmental Protection Administration of China, soil
quality-determination of total chromium, GB/T 17137-1997.
[21] P. Jain, H. Kim, T.G. Townsend, Heavy metal content in soil reclaimed from a municipal solid waste landfill, Waste Manage. 25 (2005) 25– 35.
[22] J.L.T. Hage, E. Mulder, Preliminary assessment of three new European leaching tests, Waste Manage. 24 (2004) 165–172.
[23] A. Tessier, P.G.C. Campbell, M. Bisson, Sequential extraction procedure for the speciation of particulate trace metals, Anal. Chem. 51 (7) (1979) 844–850.