行政院國家科學委員會補助專題研究計畫成果報告
※※※※※※※※※※※※※※※※※※※※※※※※※※
※ ※
※ 分析兩種不同排隊環境對佇列的影響 (Ι)
※
※
※
※※※※※※※※※※※※※※※※※※※※※※※※※※
計畫類別:■個別型計畫 □整合型計畫
計畫編號:NSC 90-2218-E-004-002-
執行期間: 90 年 8 月 1 日至 91 年 7 月 31 日
計畫主持人:陸行
共同主持人:
計畫參與人員:
本成果報告包括以下應繳交之附件:
□赴國外出差或研習心得報告一份
□赴大陸地區出差或研習心得報告一份
□出席國際學術會議心得報告及發表之論文各一份
□國際合作研究計畫國外研究報告書一份
執行單位:國立政治大學應用數學系
中
華
民 國 九十一 年
七 月
三十一 日
行政院國家科學委員會專題研究計畫成果報告
分析兩種不同排隊環境對佇列的影響 (Ι)
A queue with two differ ent envir onmental setting
計畫編號:NSC 90-2218-E-004-002-
執行期限:90 年 8 月 1 日至 91 年 7 月 31 日
主持人:陸行 國立政治大學應用數學系
一、中文摘要 等候理論的研究中,分析有關延遲等待 的可能性已有數十年。在一個等候系統中, 所有的平均等候時間及平均在系統內的時間 已成為觀察這個等候系統的一個基本指標。 很明顯地,等候環境對顧客而言扮演一個很 重要的角色。例如,改變子等候空間的環境 讓顧客能減少在等候時的痛苦或不舒服。這 個有趣的問題引發了我們去建立一個在不同 觀察點的等候系統來修正等候模型的動機。 在這論文中,我們將研究服務速率、顧客數 目的變化與等候環境有關的等候模型。 關鍵詞:等候理論、等候成本 AbstractQueues that involve waiting as a model for analyzing the possible delay have been studied for past several decades. The average total time spent in the system and the average total time spent in queue are two of the most fundamental quantities describing a queueing system's behavior. In addition, there are other important factors that will affect the delay as well. For example, the environment in which queue waiting occurs plays a fundamenta
l
role in a customer's perceived and/or actual cost of participating in that system. In this paper, we study a queueing model that takes the waiting environment into account. We present a very simple solution procedure to solve the steady-state probability in this model with the required measurement.Keywords: Delay, Queues, M/G/1.
1. Introduction
Studying a queueing model or a queueing
network model that take a possible delay into account in a system has been a considerably long history because both models have significant representation as been used for the design and analysis of many applied systems. Examples may be found in Robertazzi [12], Buzacott and Shanthikumar [2]. Traditionally, the Little's formula, L=λW, represents the relationship between the time-average number of customers in the system L and the average total time spent in the system W while λ is the arrival rate per unit time. In general, the average delay, namely the average total time either spent in the system or in the queue, has become the most fundamental quantity describing a customer’s delay or a queueing system's behavior. However, as Larson [9], So and Tang [14] and some other researchers reported (e.g., Schmitt et al. [13]), the customer's attitudes toward queues may be influenced more strongly by other factors, such as environment and social injustice. They have attempted to argue or demonstrate that at least three attributes other than the queueing waiting time play key roles in a customer's queueing experience: queueing environment, social justice and feedback about the delay. From their observations, customers usually feel better about queueing when they are provided with information that allows them to estimate in advance their waiting time in queue.
Many examples show that customer's queueing experiences and attitudes can impact a wide range of firms, including fast foods, department stores, banks and hotels, transportation services, emergency services, theme parks, airlines and so on. It seems clear that the environment in which queue waiting occurs plays a fundamental role in a customer's perceived and/or actual cost of participating in that system. The fraction of the total operating cost of a facility often can go a long way
towards alleviating customer anguish and discomfort, perhaps even transforming it into well being and happiness. In terms of the management of waiting and delays, Schmitt et al. [13] suggest that service providers should not only be concerned about minimizing customers’ average waiting time but also design queueing support systems that are susceptible to psychological and behavior factors.
A similar observation was published by Finlay et al. [8]. They considered the problem of organizing the medical residents’ work in settings where queue demands are heavy and resources are limited. The focus of their work is framework of relationship among "multiple queues" resulting from the organization of patient care into a set of sequential activities in which patients are seen first by a nurse (one queue) and then by a resident (a second queue). The reason that a queue is divided into two queues in series may be explained as follows. Generally, patients in a clinic waiting in a guest room can occupy their time watching the magazines, newspapers or paintings. Waiting after a while, the patients are called by a pre-registered number assigned according to their arrival to enter a small waiting room in order to finish some paper work or pre-checking with nurses. Although these may not be necessary to complete before seeing a doctor, it makes the patients feel they are not longer in waiting, instead they are being served. However, no details of solution methods for this problem were addressed in evaluating its performance.
Summarizing our discussion, we have attempted to demonstrate that there exist instances in which the conventional notion, an average queue waiting time, does not reflect the effective measure properly. In this paper, we investigate some mediating factors that may be related to the environment as well as the structure of the queue itself. We show a semaphore queue modeling (SQM) can be used to analyze this setting design problem. Solution methods of this SQM under the environmental consideration are presented for the first time with theoretical reasoning.
In order to describe the fundamental factors that characterize the problem, we study the classic M/G/1 queueing system with a finite
subqueue that represents a different waiting environment. Our goal is to construct such a queueing model and define its performance measures of effectiveness. As a consequence, we define new measurements to represent the delay and prove the modified queueing model is equivalent to a classic M/G/1 model but provides more information. Numerical examples are given to illustrate these results.
Several methods have been proposed to deal with finite M/G/1 queueing models, e.g., Carroll et al. [4] and Truslove [15]. Amongst the results obtained is the distribution of queue length at instants at which customers complete service. Our approach here differs from previous methods in many ways and it may be useful if we identify the contribution of this paper. First, we consider a queueing model with an infinite buffer but within it there is a finite queue to represent a different waiting environment. Second, in contrast to more complex analyses, the model we propose is rather simple and quickly understood.
2. Numer ical illustr ate examples
In this section, we present numerical experiments describing the various aspects of system behavior for different values of arrival rate λ with the service rate fixed to 1. In this case, we have ρ=λ while studying the system’s behavior.
Consider three different service distributions in examples whose probability density functions are, Erlang-2, E_2, hyper-exponential, H_2 and Erlang-4, E_4, respectively, E_2 (t)=4t e−2t, t≥0 H_2 (t)= 0.5 e−1 5. t+ 0.5e−0 75. t, t≥0 E_4 (t)=2 3(4t) 3 e−4t, t≥0 .
Each example is tested with two different buffer sizes 3 and 5. All test problems are computed with µ=1, and λ is taken from 0.1
to 0.9. From the illustrative examples, the mean waiting time are studied and found in the following order: M/H_2/1/(3), M/E_2/1/(3),
M/E_4/1/(3). The M/ H_2/1/(3) queueing model gives the highest waiting time. This is demonstrated in Figure 2.
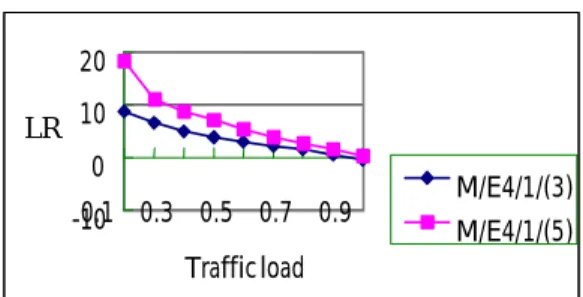
Conversely, M/ E_4/1/(3) gives the highest VR and M/H_2/1/(3) gives the lowest VR but they all are lower than that of 5-token models. This is shown in Figure 3. In Figure 4, it shows LR versus traffic load with respect to M/E_4/1/(3) and M/ E_4/1/(5). Clearly, it shows LR increases as N increases and decreases as the traffic load approaches to 0.9. Figure 4 shows it is almost impossible to have an equal queue length between Q1 and Q2,
i.e., LR=0, unless the traffic is very heavy. However, Figure 3 shows it is not difficult to let two queues with equal variance, i.e., VR=0, within a moderate traffic. Notice customers in light traffic are not sensitive to the environment since most of them do not spend
0 2 4 6 8 10 12 0.1 0.2 0.3 0.4 0.5 0.6 0.7 0.8 0.9 Traffic load
Mean waiting time
M/H_2/1/(3) M/E_2/1/(3) M/E_4/1/(3)
Figure 2: Mean waiting time vs. Traffic loads w.r.t. M/ E_2/1/(3), M/ H_2/1(3) and M/
E_4/1/(3) -10 -5 0 5 10 15 20 25 0.1 0.2 0.3 0.4 0.5 0.6 0.7 0.8 0.9 Traffic load VR M/E_4/1(5) M/E_2/1(5) M/H_2/1(5) M/E_4/1(3) M/E_2/1(3) M/H_2/1(3) a f e d c b b a f e d c
Figure 3: LR vs. Traffic loads w.r.t. M/E_2/1/(3), M/H_2/1(3) and M/E_4/1/(3)
-10 0 10 20 0.1 0.3 0.5 0.7 0.9 Traffic load LR M/E4/1/(3) M/E4/1/(5)
Figure 4: LR vs. Traffic load w.r.t. M/E_4/1(3) and M/ E_4/1/(5)
time in queue. The closer the ratios obtained from the traffic load to 1, the less different are the two environments. Therefore, these measures are suitable for cases in moderate traffic.
7. Conclusions
For the delay been considered, the variance is computed from the SQM as function of the number of tokens and the traffic load. Given available arrivals and their service requirements, the problem of setting design is to simultaneously find the subqueue sizes or assign the number of operational tokens. The objective here is to characterize VR and LR, the system’s behavior in terms of the ratio of mean waiting time and their variances between two queues. It turns out both VR and LR have an interesting characteristic that suggests the system manager a viewpoint different from traditional notion and may reflect an effective measurement.
We use a closed queueing network model to represent the subsystem. Our next research problems may be the study of characterizing LR and VR in more complicated cases. For example, consider the city bus services. Passengers have to experience two stages of waiting before reaching their destination: one is at a bus stop; the other is in the bus. Passengers usually feel better about queueing when they are in the bus rather than at the bus stop. Since the bus' capacity is finite, an interesting problem is to estimate its optimal capacity while satisfying certain cost constraints. This challenging problem may be considered as an example of a closed queueing network model with population constraints.
REFERENCES
1. Bazzraa, M.S., H.D. Sherali and C.M. Shetty, Nonlinear Programming: Theory and Algorithms , 2nd edition, John Wiley & Sons, NY, (1993).
2. Buzacott, J. and J.G. Shanthikumar,
Stochastical Models of Manufacturing Systems, Prentice-Hall, NJ, (1993).
3. Carmon, Z., J.G. Shanthikumar, and T.F. Carmon “A psychological perspective on service segmentation models: the
significance of accounting for customers’ perceptions of waiting and service,”
Management Science, Vol. 41, No.11, 1806-1815, (1995)
4 Carroll, J.L., A.D.E. Liefvoorf and L. Lipsky, “Solutions of M/G/1//N-type loops with extensions to M/G/1 and GI/M/1 queues,” Operations Research, 30, No.3, 490-514, (1982).
5 Davis, M.M., “How long should a customer wait for a service?,” Decision Sciences, Vol.22, No. 2, 421-434, (1991).
6 Davis, M.M. and J. Heineke, “How disconfirmation, perception and actual waiting times impact customer satisfaction,” International Journal of Service Industrial Management, Vol. 9, No. 1, 64-73, (1998).
7. Fdida, S., H.G. Perros and A. Wilk, “Semaphore queues: modeling multilayered window flow control mechanisms,” IEEE Transactions on Communications, 38, 309-317, (1990).
8. Finlay, W., E.J. Mutran, R.Zeitler and C. Randall, “Queues and care: how medical residents organize their work in a busy clinic,” Journal of Health and Social Behavior, 31, 292-305, (1990).
9. Larson, R.C., “Perspectives on queues: social justice and the psychology of queueing,” Operations Research, Vol.35, No.6, 895-905, (1987).
10. Katz, K.L., B.L. Larson and R.C. Larson, “Prescription for the waiting-in-line blues: entertain, enlighten, and engage,” Sloan Management Review, Winter, (1991). 11. Luh, H., “An approximation Procedure for
multi-layered semaphore queues with Coxian arrivals and exponential service times,” International Journal of Computers and Their Applications, Vol. 4, No. 1, 47-55 , (1997).
12. Robertazzi, T.G.,Computer Networks and Systems: Queueing Theory and Performance Evaluation, Springer-Verlag, New York , (1990).
13. Schmitt, B.H., L. Dube, and F. Leclerc, “Intrusions into waiting lines: does the queue constitute a social system,” Journal of Personality and Social Psychology, Vol.63, No.5, 806-815, (1992).
14. So, K.C. and C.S. Tang, “On managing oper-ating capacity to reduce congestio n in service systems,” European Journal of Operational Research, 92, 83-89, (1 996).
15. Truslove, A.L., “Queue length for the M/G/1 queue with finite waiting room,”
Advanced Applied Probability, 7, 215-226, (1975).
16. Wolff, R.W., Stochastic Modeling and the Theory of Queues, Prentice-Hall, NJ, (1989).