Regulate-SAGE: Mining Software for Serial Analysis of Gene
Expression Data
Cheng-Hong Yang
Department of Electronic Engineering, National Kaohsiung University of Applied Sciences, Kaohsiung, Taiwan [email protected]Tsung-Mu Shih
Department of Electronic Engineering, National Kaohsiung University of Applied Sciences, Kaohsiung, Taiwan [email protected]De-Leung Gu
Faculty of Biomedical Science and Environmental Biology, Kaohsiung Medical University, Kaohsiung, Taiwan ed0958719325@ya hoo.com.twHsueh-Wei Chang
Faculty of Biomedical Science and Environmental Biology, Kaohsiung Medical University, Kaohsiung, Taiwan [email protected]Li-Yeh Chuang
Department of Chemical Engineering I-Shou University, Kaohsiung, Taiwan [email protected]Abstract
- SAGE (serial analysis of gene expression) is a powerful method that allows the analysis of complete gene expression patterns with computer-aided digital analysis. SAGE libraries are available in both NCBI and NCI-CGAP for paralleled comparison on-line. However, the multiple-group comparisons among SAGE libraries are still challenging, especially for mining of tissue-specific gene candidates. We had developed an effective stand-alone software for analyzing SAGE data. In the first module, biologists can mine the regulative information of genes among different SAGE libraries and make the cross-analysis and comparison in various genes. In the second module, our proposed software also provides a friendly platform to query gene expression of interested SAGE tags in a selected SAGE library. Moreover, analyzing SAGE data in various organisms are acceptable. We are the first to provide friendly cross-analyzing and comparative interface of SAGE libraries to our knowledge. It is very important for transcriptomic studies in silico in cost-effective manner. Availability: ftp://[email protected]/2008 0824-RegulateSAGE.zipKeywords: Serial Analysis of Gene Expression, Model-
View-Controller, Gene Expression Omnibus, Tag per million.
1. Introduction
SAGE (serial analysis of gene expression) is a kind of gene expression quantifying technique, which was proposed by V. E. Velculescu et al. [1]. It is used to verify and quantify the transcripts of biological samples, and construct the cognition of the distribution and regulation of transcription in normal or abnormal cell types. Each specific tag represents each specific gene, and the level of SAGE tag abundance [2] represents the
gene expression in various biological samples. High or low tag abundance in normal and abnormal samples is able to mine by comparison of the tag number of the same gene. However, SAGE usually generates a huge amount of experimental data (including noisy and redundant data). Therefore, it is necessary to extract and arrange the significant information in SAGE data to find a key SAGE tag (or a set of SAGE tag) by data mining.
Some SAGE visualization platforms had developed, including SAGEmap [6], SAGE Genie [7], GEO [8] and Mouse SAGE Site [9]. SAGEmap [6] provides a lot of SAGE data of various organisms, and the basic function for browsing and comparing SAGE libraries. SAGE Genie [7] provides the SAGE data for human and mouse, and included a function for analyzing the differences in gene expression. GEO [8] also provides the SAGE data for various organisms, and able to browsing each library data for gene expression. Mouse SAGE Site [9] provides the SAGE data for mouse, and some analysis functions. Although these platforms are available for browsing, comparing or analyzing SAGE library data, most of them only analyze and compare with two sets of library data. It is hard to obtain and trace the unique or common gene expression of various genes in many samples simultaneously. Their ranked results of SAGE analysis are too simple to discriminate between the up, down and non-regulation of many samples. Visualized displaying of analysis results are not well-established. Accordingly, the software for analyzing multiple and cross-specific SAGE libraries (different states of cells or tissues) simultaneously was required to be developed.
Therefore, we developed Regulate-SAGE to provide biologists a gene expression mining interface for comparing and analyzing SAGE data. Regulate-SAGE offered an analysis function to mine the gene expression. It not only conquered problems, but also provided a convenient, friendly displaying for cross-comparing and
-analyzing SAGE library data. Even can obtain and trace the serials variation of expression of various genes in various SAGE libraries. Besides, Regulate-SAGE also provides a function of retrieving SAGE tag, for query interested SAGE tags in a SAGE library of interest.
2. Implementation
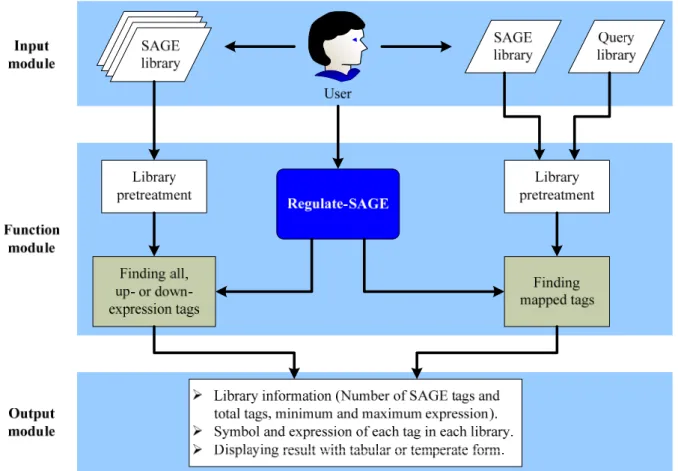
Regulate-SAGE was developed to improve and construct the SAGE data processing and retrieval of various computer platforms. The system was compiled by Java language [3], platform was divided into data, analysis module and output unit according to MVC (Model-View-Controller) architecture [4]. The workflow of Regulate-SAGE was illustrated in Figure 1.
Before outputting the regulative information of genes or retrieving SAGE tags from source SAGE libraries, these libraries needed to be pretreated. There are two processes for data pre-treatment as following:
1) The tag abundance value is transformed into the TPM value (tag per million) for each SAGE tag in each
SAGE library, in order to make the analysis with equal basal line in these libraries.
2) These libraries are merged as a gene expression matrix S. In this matrix S, each column represented different SAGE libraries and each row represented different SAGE tags, and the element sij means the gene
expression of SAGE tag i in SAGE library j. This step was useful for enhancing in searching and estimating gene expression profile.
After the pre-treatment for source data was completed, it will be filtering gene expression data definition of regulation of gene expression [5] and requirement by user, for find the genes with up or down expression. Which the expression of genes are increased in a sample that means the up-expression genes, whereas the decreased genes are the down-expression genes.
3. Results and Discussion
In this study, we proposed a powerful data mining platform [14]. This platform is able to mine large-scale
Figure 1. System structure and flowchart for Regulate-SAGE
Regulate-SAGE is divided into three modules, such as 1) input module, 2) function module, and 3) output module. In the input module, it needs to save the setting of analysis and load library data of interest for user. In the function module, a pre-treatment for loaded library data are made at first. It subsequently processes to computation and library data processing according to setting of analysis. In the output module, the results are visualized and displayed for biologists and may go for further analysis if necessary.
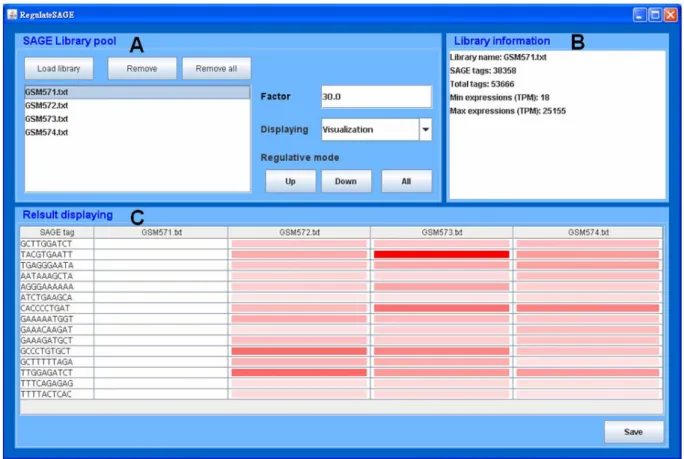
of SAGE data in several biological samples, and it is suitable for analyzing library data among tissues and cells in various organisms. The interface of Regulate-SAGE is shown in Figure 2, and it can divide into three parts in this interface. In the part of SAGE library pool, it is responsible for loading interested library data and setting parameter of analysis. In the part of library information, it can retrieve basic information about each library. In the part of result displaying, it provides the results of regulative information. In this tool, we provided two functions for analyzing SAGE data. The data sources, the input and output data of these two functions will be described as following.
3.1. Data sources
Through our SAGE platform, biologists can choose one or more interested SAGE libraries and focus on the interesting tag for analyzing. The valid format of a SAGE library is a text file, and each row data is composed of SAGE tag and tag counts and separated by a tab key [14]. Such data also can be obtaining form
SAGEmap [6], SAGE Genie [7], GEO [8], Mouse SAGE Site [9], others or self-producing SAGE library.
3.2. Mining Regulation of Gene Expression
This function can load several SAGE libraries of interest freely, and selected one library to find out all of the up- or down-expression SAGE tags in others. For example (as shown in Figure 2), there are four different state of SAGE libraries of eye of Homo sapiens which are GSM571 [10], GSM572 [11], GSM573 [12] and GSM574 [13] individually, and the detailed description and data can be obtained from GEO [8]. Now, if biologists are interested in the up-expression genes in GSM572, GSM573 and GSM574 to all the genes in GSM571, then they need to input data as following (the box of SAGE Library pool in Figure 2):1) Loading all the SAGE libraries of interest, then choose at GSM571.
2) Setting the regulative magnification (factor). This parameter is a filtering threshold of magnification of expression in each gene and regulative gene.
Figure 2. The graphical user interface of Regulate-SAGE
(A) Box of SAGE Library pool. The procedure is followed: 1) load or remove interested and valid SAGE libraries freely; 2) choose one of loaded libraries and set the Factor (regulative magnification); 3) results displaying form (TPM value or Visualization) and regulative mode (Up-, Down- or All-regulation). (B) Box of Library information. It output basic information (Library name, number of SAGE tags, total of tags, minimum and maximum expression) of a choosing library. (C) Box of Result displaying. It output 1) SAGE tags and 2) each tag expression in each library with value or temperature form. The results can be saving as a text file, for other application of analysis.
3) Selecting the displaying form of gene expression of the result for TPM value or Visualization. If displaying in TPM value, then the result will be shown as a table, else the results will be shown as a temperature map.
4) Selecting the regulative mode as up-expression. Output data of Regulate-SAGE includes the information as following:
(i) The basic information of each loaded library (the box of Library information in Figure 2), which contains library name, number of SAGE tags, total of tags, minimum and maximum expression (TPM).
(ii) The mining results for regulative genes (the box of Result displaying in Figure 2). The result contains SAGE tag and expression of each SAGE tag in these loaded libraries, and that will be displaying with tabular or visualized form.
3.3. Retrieving SAGE tags
Regulate-SAGE also could be query SAGE tags in a SAGE library, and the input and output data is the same with above function. Using this function, biologists only need to submit two valid SAGE libraries for retrieving. One library data is the SAGE library of interest, and another library data is the querying SAGE tags. In the analysis setting, the regulative magnification should be 0.0, and the SAGE library list should be selected at the querying library. After complete above steps, biologists need to click the button of ‘Up’ or ‘Down’, for obtaining the mapped results between the interested and queried libraries.
3.4. Discussion
In this study, we constructed this SAGE data mining
tool based on a cross-platform language of Java [3], so that it allows operation and analysis on various operation systems freely (e.g. Windows and Linux). As shown in Table 1, Regulate-SAGE is a stand-alone software, and it is unrestricted for the source of cells, tissues, or organisms. As compare to SAGEmap [6], SAGE Genie [7], GEO [8] and Mouse SAGE Site [9], they are restricted for the provided SAGE data, so that needs to update by developer. Therefore, user only needs to collect various SAGE library data on internet (e.g. SAGE Genie [7], GEO [8] or others) for analyzing, if it is required. And it is unnecessary for finding various tools to analyze SAGE data in the vast network. Biologists only need to find the interested and valid SAGE libraries [14] for this tool.
As shown in Table 1, Regulate-SAGE has provided two functions for analyzing SAGE data, and these two functions are suitable for any type of SAGE data (e.g. SAGE tag of 10, 14, 17 or 21 bp). SAGEmap [6], SAGE Genie [7] and Mouse SAGE Site [9] also can analyze SAGE data for SAGE tag of 10 or 17 bp, but it is unable to analyze for other type of SAGE data. In the function of Mining Regulation of Gene Expression, that is able to analyze for a number of SAGE libraries at the same time. Such way is useful for obtaining and tracing the serials variation of expression of various genes in different state of samples, and also can make a cross-comparison and -analysis for these samples. As compare to SAGEmap [6], SAGE Genie [7], GEO [8] and Mouse SAGE Site [9], these platforms are restricted to analyze in two groups of library data. So it is hard to obtain or trace the variation of gene expression in several samples, not to mention the cross-comparison and -analysis in a number of samples.
In the result of output, Regulate-SAGE is divided into up, down or all expression of genes for displaying, in
Table 1. The comparison for Regulate-SAGE and some related softwares
SAGEmap [6] SAGE Genie [7]
GEO [8] Mouse SAGE Site [9]
Regulate-SAGE [14]
Program type Web Web Web Web Stand-alone
Cross-platform Yes Yes Yes Yes Yes
Source of data Web Web Web Web Anywhere
Analysis of species Many Human/mouse Many Mouse Free
Accept SAGE type Web Web Web Web Any type
Browsing SAGE library Yes Yes Yes Yes Yes
Multi-sample analysis Only two Only two - Only two Free
Cross-comparison - - - - Yes
Mining regulating gene - - - - Yes
Querying SAGE tag Yes Yes - Yes Yes
Ranked results - Yes Yes Yes Yes
order to avoid the confusion of intricacy. As compare to SAGEmap [6], SAGE Genie [7] and Mouse SAGE Site [9], the output results are intricate for all genes. In the result of displaying, Regulate-SAGE provides not only the form of TPM value (just like SAGEmap [6], SAGE Genie [7] and Mouse SAGE Site [9]), but also the form of visualized temperature map. As shown in Figure 2, biologists could know not only the gene expression of SAGE tag of ‘TACGTGAATT’ in GSM753 is comparatively high than others obviously, but also a serials comparison for GSM751 to others simply. Therefore, such user-friendly displaying form of result is convenient for biologists, for analyze SAGE data.
4. Conclusions
In this study, we constructed a powerful SAGE data mining tool for biologists (Availability: ftp://[email protected]/20080824-Regulat eSAGE.zip). Regulate-SAGE mainly provides two functions for analyzing SAGE data. One is ‘Mining Regulation of Gene Expression’, and another is ‘Retrieving SAGE tags’. These two functions are suitable for analyzing in any kinds of SAGE library data, any kinds of organism. The first function is able to make a cross-comparison and cross-analyzing in several SAGE libraries conveniently, and visualized the analysis results for displaying. Thus, it is able to meet the demands wildly, and decrease the further research costs for biologists.
Acknowledgements
This work was partly supported by the National Science Council in Taiwan under grants NSC96- 2221-E-214-050-MY3, NSC96-2622-E-151-019-CC3, N SC96-2311-B037-002, 96-2221-E-214-050-MY3, 96-26 22-E-151-019-CC3, NSC96-2622-E214-004-CC3 and the grant KMU-EM-97-1.1a.
References
[1] V.E. Velculescu, L. Zhang, B. Vogelstein and K.W. Kinzler, “Serial analysis of gene expression”, Science,
vol. 270, no. 5235, pp. 484-487, October 1995. [2] S.M. Wang, “Understanding SAGE data”, Trends in
Genetics, vol. 23, issue. 1, pp. 42-50, January 2007.
[3] Sun Developer Network (SDN), http://java.sun.com/. [4] Wikipedia, “Model-view-controller (MVC)”,
http://en.wikipedia.org/wiki/Model-view-controller. [5] Wikipedia, “Regulation of gene expression”,
http://en.wikipedia.org/wiki/Regulation_of_gene_exp ression#Up-regulation_and_down-regulation. [6] A.E. Lash, C.M. Tolstoshev, L. Wagner, G.D.
Schuler, R.L. Strausberg, G.J. Riggins, S.F. Altschul, “SAGEmap: a public gene expression resource”,
Genome Research, vol. 10, issue 7, pp. 1051-1060,
July 2000.
[7] P. Liang, “SAGE Genie: a suite with panoramic view of gene expression”, Proceedings of the National
Academy of Sciences of the United States of America,
vol. 99, no. 18, pp. 11547-11548, August 2002. [8] T. Barrett, D.B. Troup, S.E. Wilhite, P. Ledoux, D.
Rudnev, C. Evangelista, I.F. Kim, A. Soboleva, M. Tomashevsky, R. Edgar, “NCBI GEO: mining tens of millions of expression profiles--database and tools update”, Nucleic acids research, vol. 35, pp. D760-D765, January 2007.
[9] P. Divina, J. Forejt, “The Mouse SAGE Site: database of public mouse SAGE libraries”, Nucleic acids
research, vol. 32, pp. D482-D483, 2004.
[10] SAGE library data: GSM571 (HRPE1_SAGE), http://www.ncbi.nlm.nih.gov/geo/query/acc.cgi?acc= GSM571&targ=self&form=html&view=quick. [11] SAGE library data: GSM572 (HPR1_SAGE),
http://www.ncbi.nlm.nih.gov/geo/query/acc.cgi?acc= GSM572&targ=self&form=html&view=quick. [12] SAGE library data: GSM573 (HPR2_SAGE),
http://www.ncbi.nlm.nih.gov/geo/query/acc.cgi?acc= GSM573&targ=self&form=html&view=quick. [13] SAGE library data: GSM574 (HMAC2_SAGE),
http://www.ncbi.nlm.nih.gov/geo/query/acc.cgi?acc= GSM574&targ=self&form=html&view=quick.
[14] Our proposed Software: Regulate-SAGE, ftp://[email protected]/20080824-Reg ulateSAGE.zip.