國
立
交
通
大
學
資訊科學與工程研究所
碩
士
論
文
動態配罝即時編譯程式碼
至草稿記憶體以利高效率爪哇執行
Dynamically Allocating JIT-Compiled Code
to Scratch-Pad Memory for Efficient Java Execution
研 究 生:郭泰毅
指導教授:單智君 博士
動 態 配 置 即 時 編 譯 程 式 碼
至 草 稿 記 憶 體 以 利 高 效 率 爪 哇 執 行
Dynamically Allocating JIT-Compiled Code
to Scratch-Pad Memory for Efficient Java Execution
研 究 生:郭泰毅 Student:Tai-Yi Guo
指導教授:單智君 Advisor:Dr. Jyh-Jiun Shann
國 立 交 通 大 學
資 訊 科 學 與 工 程 研 究 所
碩 士 論 文
A Thesis
Submitted to Institute of Computer Science and Engineering College of Computer Science
National Chiao Tung University in partial Fulfillment of the Requirements
for the Degree of Master
in
Computer Science and Engineering
December 2008
Hsinchu, Taiwan, Republic of China
i
動態配置即時編譯程式碼至草稿記憶體以利高效率爪哇執行
學生:郭泰毅 指導教授:單智君 博士 國立交通大學資訊工程學系﹙研究所﹚碩士班摘 要
現今不少嵌入式處理器除了 配有 快取記憶體 (cache) 外,也包含了草稿記憶體 (scratch-pad memory)。對於這些處理器,有必要研究和開發一個機制來有效地利用草稿 記憶體。目前沒有一個成功的草稿記憶體配置機制,能夠確實地在整個程式執行過程 中,根據程式行為的變化來調整草稿記憶體的配置。此外,由於快取記憶體和主記憶體 (main memory)之間的速度差異愈來愈大,指令快取誤失(instruction cache miss)所造成的停滯週期(stall cycles)已經成為程式執行時間裡相當大的一部分。對於爪哇(Java)程式, 我們觀察到超過一半的停滯週期是即時編譯程式碼(JIT-compiled code)所引起的。為了減 少指令快取誤失,我們提出了一個新的動態草稿記憶體配置機制來配置即時編譯程式碼 至草稿記憶體,在此機制中草稿記憶體的配置可以隨著程式行為的變化而有所調整。 在我們的設計中,每個方法(method)被即時編譯器(JIT compiler)編譯時,都會先被 配置到草稿記憶體。一旦草稿記憶體缺少空間,某些在草稿記憶體內的方法(method)會 被重新配置至主記憶體。在程式執行過程中,即時編譯程式碼所造成的指令快取誤失的 資訊會被蒐集,根據所蒐集的資訊,某些在主記憶體內的方法(method)會被重新配置至 草稿記憶體。 實驗結果證實,對於配有快取記憶體和草稿記憶體的處理器,我們的設計能夠有效 地利用草稿記憶體來減少指令快取誤失,進而改善程式執行效能;此設計的效能甚至比 只配有快取記憶體且成本更高或相等的處理器還要好。
ii
Dynamically Allocating JIT-Compiled Code
to Scratch-Pad Memory for Efficient Java Execution
Student: Tai-Yi Guo Advisor:Dr. Jyh-Jiun Shann
Institute of Computer Science and Engineering National Chiao Tung University
ABSTRACT
Nowadays, quite a few embedded processors have not only caches but also a scratch-pad
memory (SPM). For these processors, it is essential to explore and develop a scheme to make
good use of the SPM. There is no successful SPM allocation scheme proposed previously that
can adjust SPM allocation exactly according to variations in the program behavior all the time
throughout program execution. Furthermore, due to the widening speed gap between cache
and main memory, stall cycles resulting from instruction cache misses have become a
considerable part in the program execution time. For Java applications, we observed that over
half of the instruction cache misses are caused by JIT-compiled code. Therefore, we proposed
a novel dynamic SPM allocation scheme for JIT-compiled code to reduce instruction cache
misses, in which the SPM allocation is adjustable according to variations in the program
behavior.
In our design, every method is allocated to the SPM when it is compiled by the JIT
compiler. Once the SPM lacks free space, certain methods in the SPM will be reallocated to
the main memory. Throughout program execution, the information about instruction cache
misses caused by JIT-compiled code is gathered, and certain JIT-compiled methods in the
main memory would be reallocated to the SPM according to the gathered information.
The experimental results demonstrate that not only does our design make effective use of
the SPM to reduce instruction cache misses and thus improve the program execution
performance for the processors that have an instruction cache and an SPM, but it also has
better performance than the processors only containing caches whose costs are higher than or
iii
致 謝
感謝我的指導老師 單智君教授這兩年來對我細心地指導,並給予我親切的關懷、 幫助與勉勵,使我能夠克服求學中所遇到的困難,完成研究及碩士學位。也感謝實驗室 的另一位老師 鍾崇斌教授的諄諄教誨,讓我瞭解到必須更加努力才能不落人後。另外 也謝謝我的口試委員 楊武教授及 雍忠教授,由於你們的指導和建議,使得此篇論文更 加完整與充實。還要謝謝計劃的另一位老師 徐慰中教授給了我許多一針見血的建議。 感謝陳裕生學長帶領我進入 Java 領域,並且在研究上給予我許多的建議,使我學習 到不少東西以及可以完成此研究。同時也謝謝不吝給予幫助和意見的吳奕緯學長和實驗 室其他學長姐、同學與學弟妹,你們讓我的研究生活更為充實。 最後要謝謝我的家人與親友,你們的支持與陪伴,一直是我精神上最堅強的支柱。 郭泰毅 2008.12.26iv
Table of Contents
摘 要 ... i ABSTRACT ... ii 致 謝 ... iii Table of Contents... iv List of Figures ... vi List of Tables ... ix Chapter 1 Introduction ... 1 1.1 Java Technology ... 21.2 Execution of Java Programs ... 3
1.3 Code Buffer for Storing JIT-Compiled Code ... 5
1.4 Observation on Instruction Cache Misses for Java ... 6
1.5 Scratch-Pad Memory (SPM) ... 7
1.6 Research Motivation ... 8
1.7 Research Objective ... 9
1.8 Thesis Organization ... 10
Chapter 2 Background and Related Work ... 11
2.1 Method Table in JVM ... 11
2.2 Java Stack in JVM ... 12
2.3 Replacement Policies for Code Buffer Management ... 13
2.4 Sample-Based Profiling ... 17
2.5 Relate Work ... 17
2.5.1 Static Approach for Java ... 19
2.5.2 Partial-Runtime Dynamic Approach for Java ... 20
2.5.3 Comparison between Related Work for Java and Our Design ... 21
Chapter 3 Design of Dynamic SPM Allocation ... 22
3.1 Memory Hierarchy Overview ... 22
3.2 Components of Original Execution Environment ... 23
3.3 Components of Execution Environment in Our Design ... 24
3.3.1 Method Allocator ... 26
3.3.2 SPM Space Manager ... 26
3.3.3 Method Information Profiler ... 28
3.3.4 Method Reallocator ... 33
Chapter 4 Experiments and Results ... 37
4.1 Experimental Environment... 37
v
4.3 Experiments on Dynamic SPM Allocation and Results ... 42
4.3.1 Result of Basic Design (8KB ICache + 8KB SPM) ... 43
4.3.2 Results of Further Design (8KB ICache + 8KB SPM) ... 44
4.3.3 Basic Design vs. Further Design (8KB ICache + 8KB SPM) ... 50
4.3.4 Result of Basic Design (8KB ICache + 11.6KB SPM) ... 51
4.3.5 Results of Further Design (8KB ICache + 11.6KB SPM)... 52
4.3.6 Basic Design vs. Further Design (8KB ICache + 11.6KB SPM) ... 57
4.4 Comparison with 16KB ICache Only Environment... 59
4.5 Summary of Experimental Results ... 64
Chapter 5 Conclusion and Future Work ... 65
5.1 Conclusion ... 65
5.2 Future Work ... 67
vi
List of Figures
Figure 1-1 Components of Java Technology and Targeted Products [4]... 3
Figure 1-2 Mixed-Mode Execution of Java Programs ... 5
Figure 1-3 Writing JIT-Compiled Code into Code Buffer ... 6
Figure 1-4 Reading JIT-Compiled Code from Code Buffer ... 6
Figure 1-5 Breakdown of Execution Time for the Environment Containing an 8KB Direct-Mapped Instruction Cache and an 8KB Direct-Mapped Data Cache ... 7
Figure 1-6 Scratch-Pad Memory Organization ... 8
Figure 2-1 An Instance of a Method Table in JVM ... 12
Figure 2-2 Java Stacks in JVM... 12
Figure 2-3 An Example of a Fragmented Code Buffer ... 14
Figure 2-4 Code Buffer Miss Rate of Each Code Buffer Replacement Policy [7] ... 16
Figure 2-5 Sample-Based Profiling ... 17
Figure 3-1 Memory Hierarchy Consisting of SPM, Cache, and Main Memory ... 22
Figure 3-2 Components of Original Execution Environment ... 23
Figure 3-3 Components of Execution Environment in Our Design ... 24
Figure 3-4 A Case of LRC Replacement Policy ... 28
Figure 3-5 Work Flowchart for Method Information Profiler ... 29
Figure 3-6 Timing for Profit Calculation ... 31
Figure 3-7 Promotion and Demotion ... 34
Figure 4-1 Breakdown of Instruction Cache Miss Rate for Each Benchmark ... 40
Figure 4-2 Breakdown of Execution Time for Each Benchmark ... 41
Figure 4-3 Reduction in Execution Time by Basic Design (8KB ICache + 8KB SPM)... 44
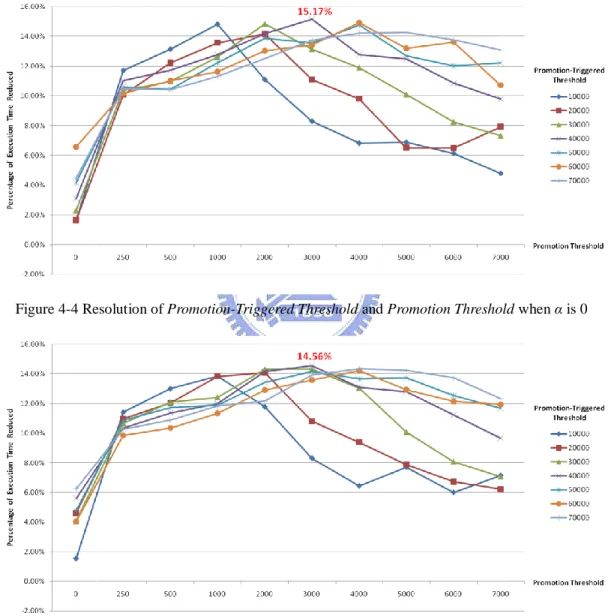
Figure 4-4 Resolution of Promotion-Triggered Threshold and Promotion Threshold when α is 0 ... 45
Figure 4-5 Resolution of Promotion-Triggered Threshold and Promotion Threshold when α is 0.1 ... 45
Figure 4-6 Resolution of Promotion-Triggered Threshold and Promotion Threshold when α is 0.2 ... 46
Figure 4-7 Resolution of Promotion-Triggered Threshold and Promotion Threshold when α is 0.3 ... 46
Figure 4-8 Resolution of Promotion-Triggered Threshold and Promotion Threshold when α is 0.4 ... 46
Figure 4-9 Resolution of Promotion-Triggered Threshold and Promotion Threshold when α is 0.5 ... 47
Figure 4-10 Resolution of Promotion-Triggered Threshold and Promotion Threshold when α is 0.6... 47
vii
Figure 4-11 Resolution of Promotion-Triggered Threshold and Promotion Threshold when α is 0.7... 47 Figure 4-12 Resolution of Promotion-Triggered Threshold and Promotion Threshold when α
is 0.8... 48 Figure 4-13 Resolution of Promotion-Triggered Threshold and Promotion Threshold when α
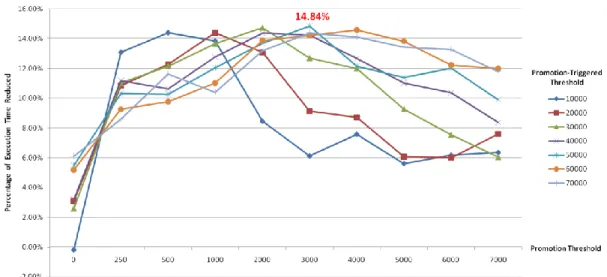
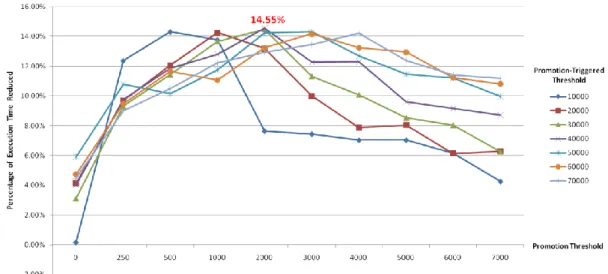
is 0.9... 48 Figure 4-14 Resolution of Sampling-Triggered Threshold ... 49 Figure 4-15 Reduction in Execution Time by Further Design (8KB ICache + 8KB SPM) ... 49 Figure 4-16 Comparison of Reduction in Execution Time between Basic Design and Further
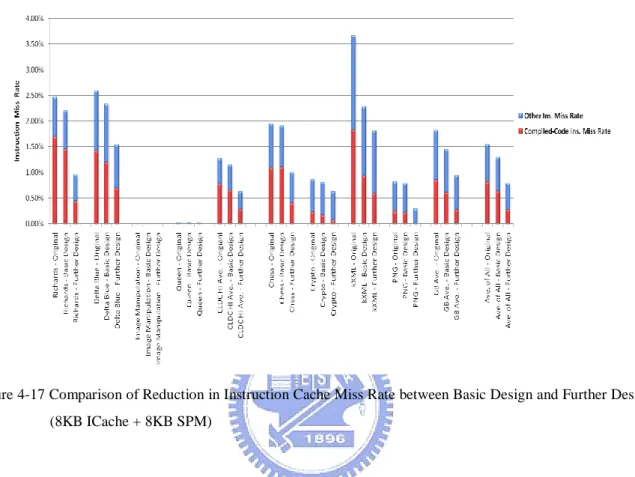
Design (8KB ICache + 8KB SPM)... 50 Figure 4-17 Comparison of Reduction in Instruction Cache Miss Rate between Basic Design
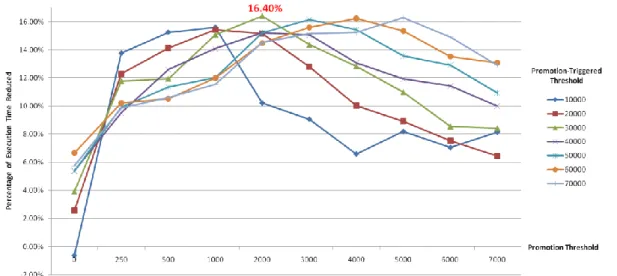
and Further Design (8KB ICache + 8KB SPM) ... 51 Figure 4-18 Reduction in Execution Time by Basic Design (8KB ICache + 11.6KB SPM) ... 52 Figure 4-19 Resolution of Promotion-Triggered Threshold and Promotion Threshold when α
is 0... 53 Figure 4-20 Resolution of Promotion-Triggered Threshold and Promotion Threshold when α
is 0.1... 53 Figure 4-21 Resolution of Promotion-Triggered Threshold and Promotion Threshold when α
is 0.2... 53 Figure 4-22 Resolution of Promotion-Triggered Threshold and Promotion Threshold when α
is 0.3... 54 Figure 4-23 Resolution of Promotion-Triggered Threshold and Promotion Threshold when α
is 0.4... 54 Figure 4-24 Resolution of Promotion-Triggered Threshold and Promotion Threshold when α
is 0.5... 54 Figure 4-25 Resolution of Promotion-Triggered Threshold and Promotion Threshold when α
is 0.6... 55 Figure 4-26 Resolution of Promotion-Triggered Threshold and Promotion Threshold when α
is 0.7... 55 Figure 4-27 Resolution of Promotion-Triggered Threshold and Promotion Threshold when α
is 0.8... 55 Figure 4-28 Resolution of Promotion-Triggered Threshold and Promotion Threshold when α
is 0.9... 56 Figure 4-29 Resolution of Sampling-Triggered Threshold ... 56 Figure 4-30 Reduction in Execution Time by Further Design (8KB ICache + 11.6KB SPM) 57 Figure 4-31 Comparison of Reduction in Execution Time between Basic Design and Further
Design (8KB ICache + 11.6KB SPM) ... 58 Figure 4-32 Comparison of Reduction in Instruction Cache Miss Rate between Basic Design
viii
Figure 4-33 Comparison of Execution Time between Further Design (8KB ICache + 8KB SPM) and 16KB Instruction Cache Only Environment ... 60 Figure 4-34 Comparison of Instruction Cache Miss Rate between Further Design (8KB
ICache + 8KB SPM) and 16KB Instruction Cache Only Environment ... 61 Figure 4-35 Comparison of Execution Time between Further Design (8KB ICache + 11.6KB
SPM) and 16KB Instruction Cache Only Environment ... 62 Figure 4-36 Comparison of Instruction Cache Miss Rate between Further Design (8KB
ix
List of Tables
Table 1-1 Comparison between Cache and Scratch-Pad Memory ... 8
Table 2-1 Summary of Code Buffer Replacement Policies [7] ... 17
Table 2-2 Comparison between Related Work for Java and Our Design ... 21
Table 3-1 Method Information Table ... 29
Table 3-2 New Profits are Stored, and Cache Miss Frequencies are Reset to 0, after Profit Calculation ... 33
Table 3-3 Method 3 has been Decompiled, and Its “Starting Address of Compiled Code in Main Memory” is 0 ... 36
Table 4-1 Description of Sun’s CLDC HotSpot Implementation Evaluation Kit ... 38
Table 4-2 Description of EEMBC’s GrinderBench ... 39
Table 4-3 Number of Compiled Methods and Size of Compiled Code for Each Benchmark . 40 Table 4-4 Summary of Experimental Results... 64
1
Chapter 1 Introduction
In recent years, electronic communication devices, such as mobile phones, information
appliances (IAs), personal digital assistants (PDAs), and so on, have attracted much attention
and continue growing rapidly year by year. Java is a programming language of good
portability, security, reliability, and compatibility. These properties make Java widely used for
the development of applications for electronic communication devices.
SRAM and DRAM are the two most common memories adopted in embedded systems.
SRAM is typically faster (by a factor of 10 to 100) but more expensive (by a factor of 20 or
more) than DRAM [1], and the difference in speed still keeps increasing nowadays. The rise
in the SRAM speed is averagely 50% a year at a similar rate to that in the processor speed [2]
versus only 7% a year for DRAM [3].
Cache is one of the most widespread SRAMs in processors while main memory is
usually a DRAM. Due to the widening gap between SRAM and DRAM speeds, the stall
cycles resulting from cache misses have become a considerable part in the program execution
time. For example, consider a processor with an 8KB direct-mapped instruction cache and an
8KB direct-mapped data cache, there is 30.85% of execution time spent on instruction cache
miss stall cycles in our experiments. Obviously, reducing the number of instruction cache
misses is an effective way to improve the execution performance.
There are quite a few embedded processors containing not only caches but also a kind of
SRAM called scratch-pad memory (SPM) or local memory. In this work, we propose a
method of utilizing the scratch-pad memory to reduce instruction cache misses arising during
program execution. At runtime, every JIT-compiled method is allocated to the SPM first and
may be dynamically reallocated to the main memory or to the SPM according to variations in
2
reduce instruction cache misses, thus decrease the program execution time, and improve the
execution performance.
1.1 Java Technology
Java technology was introduced by Sun Microsystems in 1991 and gets more and more
prevalent in numerous application fields. In order to meet various demands of different
application fields, Sun Microsystems has divided Java technology into the following three
editions:
Java Platform, Enterprise Edition
Java EE targets transactional, scalable, and database-centered applications on servers and
enterprise computers.
Java Platform, Standard Edition
Java SE provides plenty of APIs for creating applications running on servers and
personal computers.
Java Platform, Micro Edition
Java ME provides an environment for applications running on small devices with limited
memory, display, and power capacity, such as mobile phones, personal digital assistants
(PDAs), TV set-top boxes, and printers.
Figure 1-1 shows the components of Java technology and the respective targeted
products of different Java platform editions.
In this research, we chiefly aim our design at small devices, targeted by Java Platform,
Micro Edition, whose cache capacities are generally not large. Java ME contains many
technologies and specifications for constructing a platform that can meet the specific
requirements of a small device. Java ME is composed of three elements [4]:
3
A configuration provides the most basic set of libraries and virtual machine capabilities.
To fit a wide range of devices with diverse hardware capabilities, Java ME is divided into two
configurations, Connected Device Configuration (CDC) and Connected Limited Device
Configuration (CLDC). CDC targets larger devices with more capacity and with a network
connection, such as smart phones, high-end PDAs, and TV set-top boxes, whereas CLDC fits
resource-constrained devices, like mobile phones and low-end PDAs.
Profile
A profile is a set of APIs that support a narrower range of devices.
Optional Package
An optional package is a set of technology-specific APIs.
Figure 1-1 Components of Java Technology and Targeted Products [4]
1.2 Execution of Java Programs
Java programs are first compiled into an intermediate representation, referred to as
bytecode, by a Java compiler at static time. When the compilation is finished, the bytecode is
Java Card Java Platform, Enterprise Edition (Java EE) JVM Java Platform, Standard Edition (Java SE) JVM CDC CVM Foundation Profile Personal Profile Personal Basic Profile Basic CLDC MIDP KVM Card VM Optional Package Optional Package Optional Package Optional Package
Java Platform, Micro Edition
Servers & Enterprise
Computers Servers & Personal Computers
High-End PDAs & TV Set-Top Boxes &
Embedded Devices
Mobile Phones & Entry-Level PDAs
4
saved in one or more class files, which are to be fed into a Java virtual machine (JVM) for
execution. The class loader in a JVM is responsible for loading a class file into the memory
heap on demand throughout program execution. In the course of execution, the class loader
loads class files into the memory heap for the interpreter in the JVM to interpret the bytecode.
Although it is easy to implement an interpreter, its slow performance makes it unsuitable for
those environments where the performance is an essential consideration. In order to overcome
this problem, an approach that a Just-In-Time (JIT) compiler is integrated into a JVM has
been proposed.
For a JVM that comprises an interpreter and a JIT compiler, Java programs may be
executed in a mixed mode, the mixture of the aforementioned interpretation mode and the
JIT-compilation mode, as illustrated in Figure 1-2. Likewise, Java programs have to be
compiled into bytecode by a Java compiler first. When a program begins running, the JVM
executes it by directly interpreting the bytecode of the program. At the same time, the number
of invocations and backward branches of each method are counted to calculate the popularity
value of each method. Once the popularity value of a method reaches the popularity threshold,
meaning that the method is executed frequently enough, the JIT compiler is triggered to
translate the bytecode of the method into native machine code, and a free space is allocated
from the code buffer in the main memory to store the compiled code. When the method is
executed afterwards, it need not be compiled again since the compiled code has been stored in
the code buffer, and the compiled code can be fetched immediately for execution.
The JIT compilation is performed during execution of a Java program, and therefore it
must bring additional runtime overhead. However, because execution of native machine code
is far faster than interpretation of bytecode, mixed-mode execution still speeds up
5
Figure 1-2 Mixed-Mode Execution of Java Programs
1.3 Code Buffer for Storing JIT-Compiled Code
As mentioned above, when the popularity value of a method reaches the popularity
threshold, the bytecode of the method is compiled into native machine code by the JIT
compiler, and a free space needs to be allocated from the code buffer in the main memory to
store the compiled code for future utilization. From the perspective of a processor, emitting
JIT-compiled code is the same as writing data into the main memory. In the case of a data
cache with the write-allocate policy, JIT-compiled code is first written into the data cache and
then written into the code buffer in the main memory. The process of writing JIT-compiled
code into the code buffer is described in Figure 1-3.
Any JIT-compiled code must be first loaded into the instruction cache and then can be
executed by a processor. If the compiled code that is going to be executed has been in the
instruction cache, the processor can execute it straight out of the instruction cache. Otherwise,
an instruction cache miss will occur and cause the processor pipeline to stall for a number of
cycles, referred to as cache miss penalty, until the compiled code is loaded from the code
6
perhaps several dozen cycles to several hundred cycles. After the compiled code is loaded into
the instruction cache, the processor can proceed with executing it out of the instruction cache.
The process of reading compiled code from the code buffer is illustrated in Figure 1-4.
Figure 1-3 Writing JIT-Compiled Code into Code Buffer
Figure 1-4 Reading JIT-Compiled Code from Code Buffer
1.4 Observation on Instruction Cache Misses for Java
In our experiments on Java applications, we found that instruction cache miss stall cycles
constitute a considerable part of the program execution time (30.85% for the environment that
has an 8KB direct-mapped instruction cache and an 8KB direct-mapped data cache without
L2 caches), and over half (50.57%) of the instruction cache miss stall cycles are caused by
JIT-compiled code, as shown in Figure 1-5. To decrease the instruction cache misses, we may
make use of a scratch-pad memory to place the JIT-compiled code that frequently incurs
7
Figure 1-5 Breakdown of Execution Time for the Environment Containing an 8KB Direct-Mapped Instruction Cache and an 8KB Direct-Mapped Data Cache
1.5 Scratch-Pad Memory (SPM)
A scratch-pad memory is a memory array, which consists of SRAM memory cells, with
decoding circuitry and column circuitry as depicted in Figure 1-6. A scratch-pad memory is
commonly an on-chip memory. A study [5] had been made to compare the area cost and the
energy consumption between scratch-pad memory and cache, and the results indicate that a
scratch-pad memory has 34% smaller area and 40% less energy consumption than a two-way
set-associative cache of the same capacity. Additionally, through our conversion using CACTI
4.1 [6], the area of a scratch-pad memory is 31% smaller than that of a direct-mapped cache
of the same capacity. However, unlike a cache, which is invisible to software, the allocation of
instructions or data in a scratch-pad memory relies on software’s control and hence is visible
to software. To strike a balance between scratch-pad memory and cache, a good few
embedded processors, such as ARM10E, PXA270, ColdFire MCF5, IXP, and PowerPC 405,
have a scratch-pad memory as well as one or more caches. A brief comparison between
8
Figure 1-6 Scratch-Pad Memory Organization
Table 1-1 Comparison between Cache and Scratch-Pad Memory
Cache Scratch-Pad Memory
Loading Time At Runtime Before or At Runtime
Controlled by Hardware Software
Allocation Visibility Invisible to Software Visible to Software
Area Cost Ratio [5] 1 (Direct-Mapped) 0.69
1.6 Research Motivation
Owing to the great gap between cache and main memory speeds, when a cache miss
occurs, it takes a large number of cycles (perhaps several dozen cycles to several hundred
cycles) to load instructions or data into the cache, making cache miss stall cycles play an
important role in the program execution performance. We observed that instruction cache
miss stall cycles occupy a considerable part of the program execution time, and over half of
the instruction cache miss stall cycles are caused by JIT-compiled code. In other words, a
large portion of the execution time is spent on instruction cache miss stall cycles caused by
JIT-compiled code. If we place the JIT-compiled code in the SPM that frequently incurs
instruction cache misses, a lot of instruction cache misses will be eliminated, and thus the
execution time may be decreased significantly.
9
a cache of the equal capacity but introduces the overhead of software maintenance for SPM
allocation. Hence, quite a few embedded processors, such as ARM10E, PXA270, ColdFire
MCF5, IXP, and PowerPC 405, contain an SPM along with one or more caches to strike a
balance between SPM and cache. For these processors, it is essential to develop an efficient
SPM allocation scheme to make good use of the SPM.
So far, no successful SPM allocation scheme can always dynamically adjust SPM
allocation exactly according to variations in the program behavior throughout program
execution. As a result, if the behavior of a program (e.g. an interactive application) varies
during the course of program execution, the SPM allocation may be unable to fit the program
behavior anymore, leading to diminishing benefits from using the SPM. However, we can
move the JIT-compiled methods to the SPM whenever they cause numerous instruction cache
misses during program execution. In consequence, we may devise a dynamic SPM allocation
scheme that has the capability of regulating the selection of JIT-compiled methods in the SPM
with variations in the dynamic program behavior.
1.7 Research Objective
This research aims to reduce instruction cache misses that arise during execution of Java
applications by identifying the JIT-compiled methods that incur more instruction cache misses
at runtime and allocating them to the SPM dynamically. Furthermore, the JIT-compiled
methods allocated to the SPM need to be adjustable according to variations in the program
behavior throughout program execution. Besides, because the dynamic allocation method
works at runtime, it must be low-overhead sufficiently to prevent the gain from being offset
by the runtime overhead. In a word, the goal of this research is to design a low-overhead
dynamic SPM allocation approach for JIT-compiled code to reduce instruction cache misses,
10
performance.
1.8 Thesis Organization
The rest of this thesis is organized as follows. Chapter 2 introduces the background
knowledge and the related work in reference to our research. Chapter 3 presents the memory
hierarchy and the components of the execution environment in the design of dynamic SPM
allocation for JIT-compiled code. Chapter 4 describes our experimental process and gives the
experimental results and some analyses. Chapter 5 presents the conclusion and the future
11
Chapter 2 Background and Related Work
In this chapter, the required background knowledge for this thesis and the related work to
our research are introduced. Section 2.1 describes the method table in a JVM used for keeping
some necessary information on methods. Section 2.2 introduces the Java stack in a JVM for
storing the runtime data of invoked methods. Section 2.3 introduces the six most common
replacement policies for code buffer management. Section 2.4 describes the sample-based
profiling technique, which is adopted as the profiling scheme in our design. Section 2.5
introduces the related work, proposed SPM allocation schemes to date.
2.1 Method Table in JVM
The method table in a JVM is used to keep the necessary information on methods. Every
class in a Java program has its own method table, and each method in a class has a method
block, which is a C structure, in the method table. Each method block contains the following
information, a method name, a signature, exceptions, and pointers to more specific
information on a Java method or a native method.
For a Java method, its method block in the method table has a pointer to its method
descriptor. The method descriptor holds the bytecode of the method, a method exception table,
and debugging information like the line number table if applicable. The method descriptor is
immutable after being initialized. Additionally, when a method gets compiled by the JIT
compiler, a pointer to the start of the compiled code in the code buffer is stored into the
method block. Figure 2-1 is an instance of a method table, where method A and method C are
JIT-compiled methods, and their method blocks contain pointers to their respective starts of
the compiled code.
12
instruction.
Figure 2-1 An Instance of a Method Table in JVM
2.2 Java Stack in JVM
Every Java thread has a Java stack in the JVM for keeping the runtime data of invoked
methods. A Java stack is allocated as a linked list, as depicted in Figure 2-2. When a method
gets invoked, a new stack frame for this method will be pushed onto the Java stack. Once the
method returns, the stack frame will be popped out and discarded. Therefore, whenever a
method is being executed, its stack frame must be the top one in the Java stack.
Figure 2-2 Java Stacks in JVM
Each stack frame holds the useful data for an invoked method, including the method’s
13
the class of the method and a pointer to the method descriptor of the method can as well be
found in the stack frame.
2.3 Replacement Policies for Code Buffer Management
When a method gets compiled by the JIT compiler, the JIT-compiled code is stored into
the code buffer for future utilization. If the code buffer doesn’t have enough free space for a
newly compiled method, one or several compiled methods in the code buffer must be replaced
to make room for the newly compiled method. The replacement policy for deciding which
method(s) to evict from the code buffer is of crucial importance since evicting frequently
executed methods may result in performance degradation.
Besides, the fragmentation problem and the maintenance overhead of the replacement
policy also have influences on the program execution performance. The fragmentation
problem means that even if the total capacity of the free space in the code buffer is adequate
for an incoming method, the method still cannot be inserted into the code buffer because the
free space is fragmented. For an example of a fragmented code buffer, see Figure 2-3, where
the white blocks indicate free space. Although the total size of the free space is larger than the
size of the incoming method, each segment of contiguous free space is too small to fit the
method. The defragmentation operation may be employed to deal with this problem, but the
overheads of most defragmentation techniques are too high to be applicable to Java
environments. Such a cause necessitates a replacement policy for code buffer management
14
Figure 2-3 An Example of a Fragmented Code Buffer
The following are the six most common ways to decide which method(s) to evict from
the code buffer:
Least-Recently Accessed (LRA)
When the code buffer doesn’t have sufficient free space for a newly compiled method,
the JIT-compiled method in the code buffer that hadn’t been accessed for the longest time is
the first candidate for replacement. In case removing only this JIT-compiled method cannot
free an adequately large space to place the incoming method, the subsequent one or more
methods in the code buffer are also removed until the space freed is larger than the incoming
method. This policy has the benefit of exploiting the temporal locality, yet it has the drawback
of deleting innocent victim methods in order to make a contiguous space large sufficiently for
the incoming method. This policy would suffer from the effect of fragmentation.
Least-Frequently Accessed (LFA)
In the event that there isn’t adequate room in the code buffer for an incoming method,
the JIT-compiled method accessed the fewest times among all the methods in the code buffer
is the first candidate for replacement. Like the LRA policy, if evicting the method doesn’t
generate enough free space, the subsequent one or more methods are evicted as well. Even
though this policy can identify hot methods effectively, it has the possibility of deleting a
method compiled just lately, whose access count has not been high yet. Additionally, this
15
Least-Recently Created (LRC)
This policy treats the code buffer as a circular buffer, and the compiled methods are
replaced in the same order as they were inserted. In the event that replacing a method does not
produce adequate free space for the incoming method, the subsequent one or more methods
are also replaced till the space freed is enough. If the space freed is larger than needed by the
incoming method, the remainder free space can be used by the next method inserted into the
code buffer. This policy completely avoids the generation of fragmentation, and the overhead
is rather low because it merely needs a pointer to be updated when a method is inserted.
Largest Element (LE)
When a JIT-compiled method cannot be put into the code buffer owing to lack of free
space, the method of the largest size in the code buffer is selected as the first victim to discard.
Likewise, if discarding the method cannot free adequate space, the subsequent one or more
methods are also discarded. The purpose of this policy is to minimize the number of
replacements that occur within the code buffer, but no attention is paid to the temporal locality.
This policy would lead to the fragmentation problem as well.
Best-Fit Element (BFE)
In case the free space in the code buffer is not sufficient to store a newly compiled
method, the entire code buffer is scanned in search of the method of the smallest size that is
larger or equal to the size of the incoming method. If there is no method in the code buffer
large enough for the incoming method, all the methods and their next ones are grouped into
pairs of two, and the best-fit search resumes. Although this policy attempts to minimize the
number of times the fragmentation problem arises, it incurs very high overhead from the
search for the best-fit element.
Full Cache Flush
As soon as a JIT-compiled method cannot be inserted into the code buffer, all compiled
16
placed in the code buffer. Although this is a replacement policy with very low overhead and
no fragmentation problem, it has the adverse side effect of evicting frequently executed
methods from the code buffer and thus potentially degrades the program execution
performance.
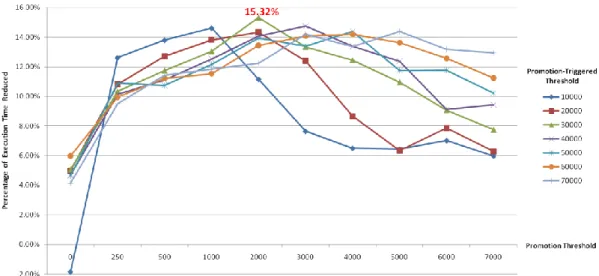
The above six replacement policies for code buffer management have been evaluated in a
previous study [7]. The experimental result reveals that the LRA policy outperforms the other
policies across various code buffer sizes in terms of the code buffer miss rate as shown in
Figure 2-4. The code buffer miss rate of the LRC policy is also fairly low, although it is a little
higher than that of the LRA policy.
Figure 2-4 Code Buffer Miss Rate of Each Code Buffer Replacement Policy [7]
In addition to the code buffer miss rate, the fragmentation problem and the maintenance
overhead should also be taken into account for the evaluation of these policies. As
summarized in Table 2-1, only two policies, LRC and Flush, do not suffer from the
fragmentation problem at all, and each of them simply needs a pointer for management,
incurring the lowest overhead among all the policies. After combining the factors of code
buffer miss rate, fragmentation problem, and overhead, the LRC policy, with a low code
buffer miss rate, no fragmentation problem, and the lowest maintenance overhead, appears to
17
Table 2-1 Summary of Code Buffer Replacement Policies [7]
Policy Fragmentation Code Buffer Miss Rate Management
Flush None 4.61% Pointer
LRA Yes 2.48% Priority Queue
LFA Yes 9.11% Priority Queue
LE Yes 13.91% Priority Queue
BFE Minimal 20.77% Multiple Sorted Lists
LRC None 2.88% Pointer
2.4 Sample-Based Profiling
Profiling is used to analyze a program’s behavior by gathering information on program
execution. Sample-based profiling is a kind of profiling technique with fairly low overhead. It
does not specifically collect all required information at runtime but collects information only
while certain regular events occur (e.g. the number of cache misses reaches a certain value)
using operating system or hardware interrupts as illustrated in Figure 2-5. Sample-based
profiling is typically less accurate and less specific but allows the target program to run at
nearly full speed. This technique is employed as the profiling scheme in our design.
Figure 2-5 Sample-Based Profiling
2.5 Relate Work
There have been plenty of previous studies on SPM allocation schemes, the majority of
which are for executed languages like C and C++, and few are for interpreted languages like
18
partial-runtime dynamic approach, and runtime dynamic approach.
The static approach [5][8][9][10][11][12][13][14][15][16][17][18][19] and the statically
decided dynamic approach [20][21][22][23][24][25][26] need a static compiler to analyze
program behavior at static compile time for the decision on SPM allocation. The static
approach does not change SPM contents during program execution, so objects placed in the
SPM do not alter across distinct portions of a program. On the contrary, the statically decided
dynamic approach may change SPM contents during program execution. Nevertheless,
because the SPM allocation is decided at static compile time, these approaches cannot exactly
adjust SPM contents according to dynamic program behavior. Consequently, as long as the
program behavior varies with inputs at runtime, the benefits from use of the SPM are likely to
diminish. Heretofore, the mass of the proposed SPM allocation schemes belonging to the two
approaches are applied to executed languages, and few [18][19] are applied to interpreted
languages. Executed languages are those whose program binaries need to be executed directly
on hardware, such as C and C++, while interpreted languages are those whose program
machine-independent representations are interpreted by a runtime system, such as Java.
The partial-runtime dynamic approach decides SPM allocation by profiling a program
for a period of execution time after the start of program execution till a method is detected as
a hot method. Like the statically decided dynamic approach, this approach may change SPM
contents in the course of program execution. Even though this approach decides SPM
allocation at runtime, it cannot always adjust the SPM allocation exactly according to
dynamic program behavior throughout program execution as well because it gathers program
information only during the beginning period of execution time. Only one SPM allocation
scheme [1] belongs to this approach at present, which is applied to an interpreted language,
Java.
So far, there is only one scheme belonging to the runtime dynamic approach, which is
19
bits, tags, and data of the cache are handled by compiler-inserted code on every memory
access. Even if this method is capable of regulating SPM contents with variations in the
dynamic program behavior, it introduces significant overheads in runtime, code size, data size,
and energy consumption for the management of the fields of a cache. For this reason, software
caching is extensively regarded as a failure, and almost all recent studies focused on the static
approach and the statically decided dynamic approach.
All current SPM allocation schemes for Java belong to either the static approach or the
partial-runtime dynamic approach, and they are introduced in the following subsections.
2.5.1 Static Approach for Java
The SPM allocation scheme for Java [18][19] proposed by Tomar et al. belongs to the
static approach, meaning that SPM allocation is decided at static time and objects placed in
the SPM do not change at runtime. In their method, the candidates for SPM allocation are
heap objects (data) in a program and profiling is run at static time to acquire the number of
references to each object. Afterwards, the Java compiler inserts annotations into the bytecode
to specify which objects are to be allocated to the SPM. In order to realize this method, the
JVM needs to be modified to have the capability of recognizing those annotations. During
program execution, the JVM preferentially allocates the annotated objects to the SPM till the
SPM is full.
Although this method has the merit of low runtime overhead since the decision on SPM
allocation is made at static time, it has at least the following shortcomings. First, this method
considers the number of references to each object for SPM allocation but pays no attention to
cache misses. In the case of an environment containing a cache, the objects that give rise to
more cache misses probably are not the ones referenced more times because the objects
20
method can only apply to the bytecode produced by their specialized Java compiler. Third,
since Java applications may run on a great variety of platforms, the absence of hardware
information like the SPM capacity at static time makes the SPM allocation possibly unable to
serve the practical execution environment. Last, this method is incapable of regulating SPM
contents with variations in the dynamic program behavior.
2.5.2 Partial-Runtime Dynamic Approach for Java
In addition to the above static approach, an SPM allocation scheme for Java [1]
belonging to the partial-runtime dynamic approach was proposed lately by Nguyen et al. The
candidates for SPM allocation in their method are bytecode, static class variables, Java stacks,
and heap objects (data). The SPM allocation is decided according to the program behavior
during a period of execution time after the start of program execution. At the beginning of
program execution, profiling is run to count the number of times each candidate is accessed
until the first time a method is detected as a hot method. After the profiling is terminated,
SPM allocation is performed according to the collected profile information. The candidates
are allocated to the SPM in the descending order of their LFPB values till the SPM is full. The
LFPB equation is given below.
) ( ) ( Byte Size Frequency Access Latency Latency LFPB slow memory SPM
Even though this method doesn’t need a specialized Java compiler to support and just
needs the JVM to be modified, it doesn’t allow for cache misses for SPM allocation as well.
Moreover, it cannot always adjust SPM allocation exactly according to dynamic program
behavior throughout program execution because it gathers program information only during
the beginning period of execution time. Besides, this method incurs rather high runtime
21
2.5.3 Comparison between Related Work for Java and Our Design
The aforementioned SPM allocation schemes for Java are Tomar’s method (static
approach) and Nguyen’s method (partial-runtime dynamic approach). They are compared with
our design (runtime dynamic approach), and the comparison result is listed in Table 2-2.
Table 2-2 Comparison between Related Work for Java and Our Design
Tomar’s Method (Static Approach) Nguyen’s Method (Partial-Runtime Dynamic Approach) Our Design (Runtime Dynamic Approach) Candidate for
SPM Allocation Data Data Code
Taking Cache Misses into Account No No Yes Need for Specialized Java Compiler Yes No No Runtime
Overhead Low High Medium
Dynamic Adjustment of SPM Allocation
22
Chapter 3 Design of Dynamic SPM Allocation
Our design of dynamic SPM allocation for JIT-compiled code is elaborated in this
chapter. Section 3.1 describes the memory hierarchy utilized in our design, which consists of
SPM, cache, and main memory. Section 3.2 introduces the components related to our design
in the original execution environment. Section 3.3 presents in detail the components in our
design that are modified from or added to the original execution environment and their
respective functions.
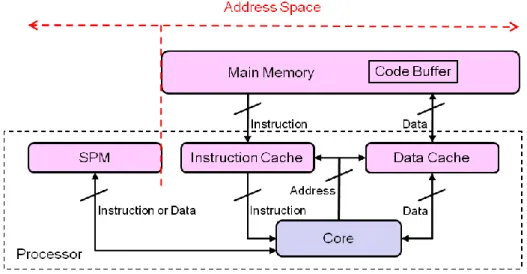
3.1 Memory Hierarchy Overview
The memory hierarchy utilized in our design consists of SPM, cache, and main memory
as depicted in Figure 3-1. The SPM and the main memory occupy the different address ranges
of the address space, signifying that the address range of the SPM is disjoint from that of the
main memory. Any instruction or data whose address is mapped to the main memory’s
address range is read from or written to the main memory. Similarly, any instruction or data
whose address is mapped to the SPM’s address range is read from or written to the SPM.
23
Instructions and data in the main memory are all cacheable. It means that any instruction
must be first loaded into the instruction cache before it can be executed by the processor, or an
instruction cache miss will occur to get instructions loaded from the main memory to the
instruction cache. Similarly, any data read from or written to the main memory must pass
through the data cache (write-allocate policy). In contrast with the main memory, neither
instruction nor data in the SPM is cacheable. Hence, all instructions and data are read from or
written to the SPM directly, and no cache miss will occur at all.
3.2 Components of Original Execution Environment
Figure 3-2 shows the components related to our design in the original execution
environment. The JVM contains a JIT compiler used to compile frequently executed methods
on the fly as mentioned in section 1.2, and the JIT compiler has a method allocator, which is
responsible for allocating the method to the main memory when a method gets compiled. Any
JIT-compiled method is stored in the code buffer in the main memory for future utilization.
Figure 3-2 Components of Original Execution Environment
When a JIT-compiled method is executed, the processor will check whether the
24
can execute it instantly out of the instruction cache. Otherwise, an instruction cache miss will
occur, and the JIT-compiled code will be loaded into the instruction cache. Then, the
processor can proceed with executing it out of the instruction cache.
3.3 Components of Execution Environment in Our Design
Figure 3-3 depicts the components in our design that are modified from or added to the
original execution environment (depicted in red) and the invocation relationship among them.
These components are briefed as follows:
Figure 3-3 Components of Execution Environment in Our Design
Method Allocator
The method allocator is modified from the method allocator in the original execution
environment, and its function is to allocate the JIT-compiled method to the SPM as a method
gets compiled by the JIT compiler. It has to call the SPM space manager (mentioned below) to
allocate an SPM free space to store the JIT-compiled method and has to set some necessary
25
SPM Space Manager
The function of the SPM space manager is to allocate a free space from the SPM for the
JIT-compiled method that is about to be inserted into the SPM during the process of allocation
or reallocation (mentioned after). In case of lack of free space in the SPM for an inserted
method, the SPM space manager needs to perform replacement to evict some method(s) from
the SPM and needs to call the method reallocator (mentioned after) to reallocate the evicted
method(s) to the main memory.
Method Information Profiler
The method information profiler is responsible for gathering instruction cache miss
information on JIT-compiled methods and converting the gathered information on each
JIT-compiled method into a value for estimating the benefit of storing a JIT-compiled method
in the SPM instead of the main memory. Moreover, the method information profiler needs to
make a decision on whether a JIT-compiled method in the main memory is to be reallocated to
the SPM according to the value so that the selection of JIT-compiled methods in the SPM can
be dynamically adjusted with variations in the program behavior. If the method information
profiler decides to reallocate a JIT-compiled method to the SPM, it will call the method
reallocator (mentioned below) to perform this operation.
Method Reallocator
The method reallocator is responsible for reallocating a JIT-compiled method to the main
memory or to the SPM. When a JIT-compiled method is selected to evict from the SPM by the
SPM space manager, the method reallocator needs to reallocate the method to the main
memory. When the method information profiler decides to reallocate a JIT-compiled method
from the main memory to the SPM, the method reallocator needs to call the SPM space
manager to allocate an SPM free space and then reallocate the method to the SPM.
Furthermore, the method reallocator has to modify certain information kept in the JVM during
26
3.3.1 Method Allocator
The method allocator in our design is adapted from the method allocator in the original
execution environment. The original method allocator allocates all methods getting compiled
by the JIT compiler to the code buffer in the main memory, whereas the adapted method
allocator allocates all methods getting compiled to the SPM rather than to the main memory.
There are two reasons for allocating a JIT-compiled method to the SPM instead of the
main memory on method compilation. First, in the original environment, the compiled code
has to be first written into the data cache and then can be written into the main memory. This
probably results in the occurrence of data cache misses, which may eject some useful data
from the data cache. Yet in our design, the compiled code is written into the SPM directly.
This way no longer incurs data cache misses and avoids ejecting useful data from the data
cache.
Second, JIT-compiled methods are those in a program that were executed frequently, so
they are selected to be compiled by the JIT compiler. In general, a JIT-compiled method will
continue being executed rather frequently after being compiled. Therefore, the way of directly
allocating JIT-compiled methods to the SPM can immediately avoid the occurrence of some
instruction cache misses.
In the process of allocating a JIT-compiled method to the SPM, the method allocator
needs to invoke the SPM space manager to allocate a free space from the SPM for the
JIT-compiled method and then stores the JIT-compiled method into the SPM. In addition, the
method allocator has to store a pointer to the start of the compiled code into the method block
of the JIT-compiled method in the method table.
3.3.2 SPM Space Manager
27
JIT-compiled method that is about to be inserted into the SPM. There are two cases in which
the SPM space manager is invoked. The first is that the method allocator calls the SPM space
manager to allocate an SPM free space for the method that is getting compiled by the JIT
compiler. The second is that the method reallocator calls the SPM space manager to allocate
an SPM free space for the JIT-compiled method that is to be reallocated to the SPM. If the
SPM lacks free space, the SPM space manager has to perform replacement to make room for
the inserted method.
As indicated by the previous study [7] introduced in section 2.3, the least-recently
created (LRC) replacement policy, with a low code buffer miss rate, no fragmentation
problem, and the lowest overhead, is the most desirable replacement policy among all the
policies that were investigated in the study. For this reason, the LRC policy is adopted as the
replacement policy for SPM space management in our design.
The SPM is treated as a circular buffer, and JIT-compiled methods in the SPM are
replaced in the same order as they were inserted into the SPM. The way to implement the
LRC policy is to make use of a pointer, referred to as entry pointer in this thesis, to indicate
which method in the SPM is the first victim to evict. In case evicting a victim method does
not generate enough free space, one or more methods subsequent to the first victim will also
be evicted until the space freed is large adequately for the incoming method. If the space freed
is larger than needed by the incoming method, the remainder free space can be used by the
next incoming method. After replacement, the pointer will point to the victim method for the
next replacement.
Figure 3-4 is a case of the LRC replacement policy. Method n+1 is the method that is
about to be inserted into the SPM. The entry pointer indicates that Method 2 is the first victim
method for replacement. Since Method n+1 is larger than Method 2, Method 3 also needs to
be replaced to produce a sufficiently large free space. After evicting Method 2 and Method 3,
28
because the total size of Method 2 and Method 3 is larger than that of Method n+1. At last, the
entry pointer points to the remainder free space, which can be used by the next incoming
method.
Figure 3-4 A Case of LRC Replacement Policy
3.3.3 Method Information Profiler
The three functions of the method information profiler are collecting information about
instruction cache misses caused by JIT-compiled code, calculating the profit from storing a
JIT-compiled method in the SPM rather than in the main memory, and deciding whether a
JIT-compiled method is to be reallocated to the SPM or not.
Figure 3-5 is the work flowchart for the method information profiler. After the start of
program execution, the method information profiler begins to collect information about
instruction cache misses caused by JIT-compiled code. Once the condition of profit
calculation is reached, the method information profiler will start to calculate a JIT-compiled
method’s profit. After finishing calculating a method’s profit, the method information profiler
will check the method’s location and the profit to decide whether to reallocate the method to
the SPM or not. If yes, it will call the method reallocator to reallocate the method to the SPM.
Afterwards, it continues to process another JIT-compiled method until all method’s profits
29
Figure 3-5 Work Flowchart for Method Information Profiler
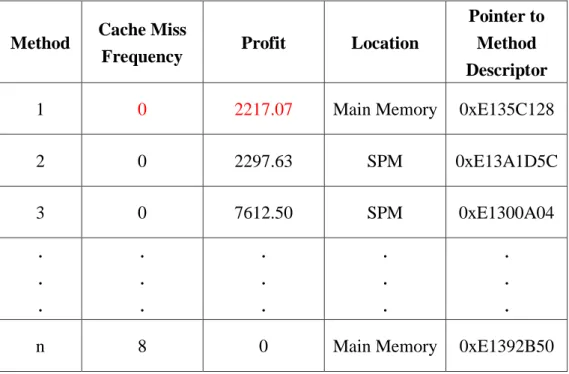
The method information profiler holds a method information table to keep track of some
required information on JIT-compiled methods for our design as shown in Table 3-1. Each
method has the following four kinds of information kept in the method information table:
Table 3-1 Method Information Table
Method Cache Miss
Frequency Profit Location
Pointer to Method Descriptor
1 15 0.02 Main Memory 0xE135C128
2 0 2297.63 SPM 0xE13A1D5C 3 0 7612.50 SPM 0xE1300A04 . . . . . . . . . . . . . . .
n 1 0 Main Memory 0xE1392B50
Cache Miss Frequency
The cache miss frequency represents the occurrence status of instruction cache misses of
30
Profit
The profit is a value used for estimating the benefit that would be gained from storing a
JIT-compiled method in the SPM rather in the main memory.
Location
The location indicates a JIT-compiled method is in the SPM or in the main memory.
Pointer to Method Descriptor
This information is a pointer to the method descriptor of a JIT-compiled method.
If there is any JIT-compiled method evicted from the SPM to the main memory,
instruction cache misses caused by JIT-compiled code will likely begin arising. The method
information profiler is responsible for gathering the instruction cache miss information. It
employs the sample-based profiling technique as the profiling scheme to collect instruction
cache miss information on JIT-compiled methods. It does not keep track of every instruction
cache miss but every sample of instruction cache miss instead. Every time the number of
instruction cache misses reaches a fixed value called Sampling-Triggered Threshold
(determined in chapter 4), the method information profiler will sample the occurring
instruction cache miss and use the current program counter to find out which JIT-compiled
method causes this instruction cache miss.
The way to find out which JIT-compiled method causes this instruction cache miss is to
compare the current program counter with the program counter recorded in the top stack
frame of each Java stack. If the program counter recorded in a certain top stack frame matches
the current program counter, it means the method that owns the stack frame is executing the
instruction that incurs this instruction cache miss, and thus the method causing this instruction
cache miss can be identified. In case that this instruction cache miss is not caused by a
JIT-compiled method, this sample will be thrown away. Otherwise, the cache miss frequency
of the JIT-compiled method causing this instruction cache miss kept in the method
31
The address of a JIT-compiled method’s method descriptor is utilized as the hashing key
for locating the method’s entry in the method information table, and the address can be found
in the method’s stack frame in the Java stack. If the JIT-compiled method whose cache miss
frequency needs to be increased by one hasn’t had an entry in the method information table
(there hasn’t been any sampled instruction cache miss incurred by this method), a new entry
belonging to this method will be inserted. Initially, the cache miss frequency is set as 1, the
profit is set as 0, the location is “main memory” (any method causing an instruction cache
miss is definitely in the main memory), and the pointer to its method descriptor is stored.
In addition to collecting instruction cache miss information, the method information
profiler has to calculate the profit of each JIT-compiled method, which is an estimate of the
benefit gained from storing a JIT-compiled method in the SPM instead of the main memory.
As often as (Nsample × Sampling-Triggered Threshold) reaches a fixed value called
Promotion-Triggered Threshold (determined in chapter 4), the method information profiler will start to calculate the profit, as illustrated in Figure 3-6. Nsample denotes the number of
samples of instruction cache misses caused by JIT-compiled code, so (Nsample ×
Sampling-Triggered Threshold) means the approximate number of instruction cache misses caused by JIT-compiled code. As long as the profit calculation is finished, Nsample is reset to 0
and re-accumulated.
Figure 3-6 Timing for Profit Calculation
Each method that has an entry in the method information table has its own profit. The
profit equation is a weighted average as follows:
) 1 ( ) ( 1
KB Size Method Threshold riggered Sampling-T Frequency Miss Cache Profit ofit Pr n n n32
Profitn-1 denotes a method’s previous profit, currently stored in the method information table.
α is a fixed number larger than or equal to 0, and smaller than 1 (determined in chapter 4). Cache Miss Frequencyn denotes a method’s present cache miss frequency, currently recorded
in the method information table. Hence, the profit implies the number of instruction cache
misses caused by a JIT-compiled method per kilobyte per time interval between every time
profit calculation is launched. Apparently, the higher the profit is, the more benefit storing the
method in the SPM would bring. The reason for adopting the weighted average is to prevent a
sharp variation in the number of instruction cache misses from leading to a great change in the
profit value.
After finishing the calculation of a method’s profit, the old profit stored in the method
information table will be replaced with the newly calculated profit, and the cache miss
frequency of the method will be reset to 0, as shown in Table 3-2, where method 1’s new
profit has been stored, and method 1’s cache miss frequency has been reset to 0. And then the
method information profiler begins to decide whether to reallocate the method to the SPM or
not. It first checks the location of the method recorded in the method information table and
then checks the profit of the method. If the method is in the main memory, and the profit
exceeds Promotion Threshold (determined in chapter 4), the method information profiler will
invoke the method reallocator to reallocate the method to the SPM.
After completing processing a JIT-compiled method, the method information profiler
continues to process the next method until every JIT-compiled method that has an entry in the
method information table has been processed. And then the method information profiler
33
Table 3-2 New Profits are Stored, and Cache Miss Frequencies are Reset to 0, after Profit Calculation
Method Cache Miss
Frequency Profit Location
Pointer to Method Descriptor
1 0 2217.07 Main Memory 0xE135C128
2 0 2297.63 SPM 0xE13A1D5C 3 0 7612.50 SPM 0xE1300A04 . . . . . . . . . . . . . . .
n 8 0 Main Memory 0xE1392B50
3.3.4 Method Reallocator
The method reallocator is responsible for the reallocation of a JIT-compiled method to
the main memory or to the SPM. When a JIT-compiled method is selected to evict from the
SPM by the SPM space manager, the method reallocator needs to reallocate the method to the
main memory. When it is decided that a JIT-compiled method is to be reallocated to the SPM
by the method information profiler, the method reallocator has to reallocate the method to the
SPM.
Reallocation of JIT-compiled methods can be divided into promotion and demotion as
depicted in Figure 3-7. Promotion represents reallocation of a JIT-compiled method from the
main memory to the SPM. On the contrary, demotion represents reallocation of a
JIT-compiled method from the SPM to the main memory.
The process of promoting a JIT-compiled method from the main memory to the SPM
chiefly involves the following four steps:
i. The SPM space manager is invoked to allocate an SPM free space for the promoted
34
ii. The JIT-compiled code of the promoted method is copied from the code buffer in the
main memory to the SPM.
iii. The pointer to the start of the compiled code kept in the promoted method’s method
block in the method table is fixed up in order to maintain the accuracy of program
execution. The way to locate the pointer to the start of the compiled code stored in the
method block is to utilize the pointer to the promoted method’s method descriptor
kept in the method information table and thus the pointer can be located.
iv. The location of the promoted method recorded in the method information table is
modified to “SPM”.
Figure 3-7 Promotion and Demotion
The process of demoting a JIT-compiled method from the SPM to the main memory
mainly involves the following three steps:
i. The JIT-compiled code of the demoted method is copied from the SPM to the code
buffer in the main memory.
ii. The pointer to the start of the compiled code stored in the demoted method’s method
block in the method table is fixed up in order to maintain the accuracy of program
execution. The pointer to the demoted method’s method descriptor kept in the method
information table is used to locate the pointer to the start of the compiled code stored
in the method block in the method table.
![Figure 2-4 Code Buffer Miss Rate of Each Code Buffer Replacement Policy [7]](https://thumb-ap.123doks.com/thumbv2/9libinfo/8262948.172264/27.893.220.674.475.708/figure-code-buffer-miss-rate-buffer-replacement-policy.webp)