國
立
交
通
大
學
光電工程研究所
碩
士
論
文
在鈦酸鉛及氧化鐵鈷的多重鐵性系統中研究受
應力影響之介面聲子與鐵磁特性
Stress-Dependent Interfacial Phonon and
Ferromagnetic Properties in PbTiO
3
-CoFe
2
O
4
Multiferroic System
研 究 生:蔡智雅
指導教授:謝文峰 教授
在鈦酸鉛及氧化鐵鈷的多重鐵性系統中研究受應力
影響之介面聲子與鐵磁特性
Stress-Dependent Interfacial Phonon and
Ferromagnetic Properties in PbTiO
3-CoFe
2O
4Multiferroic System
研 究 生:蔡智雅
Student:Chih-Ya Tsai
指導教授:謝文峰 教授
Advisor:Wen-Feng Hsieh
國 立 交 通 大 學
光電工程研究所
碩 士 論 文
A ThesisSubmitted to Institute of Electro-optical Engineering College of Electrical Engineering and Computer Science
National Chiao Tung University in Partial Fulfillment of the Requirements
for the Degree of Master
in
Electro-optical Engineering June 2009
Hsinchu, Taiwan, Republic of China
i
在鈦酸鉛及氧化鐵鈷多重鐵性系統中研究跟應力相
關的介面聲子及鐵磁特性
研究生:蔡智雅 指導教授:謝文峰 教授 國立交通大學光電工程研究所摘要
在此篇論文中,我們藉由顯微拉曼光譜研究在以鈦酸鉛為基質而含有三種不同幾何 結構的氧化鐵鈷之多重複合鐵性材料中之介面聲子及鐵磁特性與應力的相關性。多重複 合鐵性材料在介面上的聲子能量和鐵磁特性跟應力的關係不只源自於氧化鐵鈷跟鈦酸 鉛基底的晶格大小差異,也跟他們在介面上的化學鍵結強度相關。其中,以 disk-3 型態 的多重複合鐵性材料,即為自組裝的盤狀氧化鐵鈷鑲嵌於鈦酸鉛基質中,顯現出在鐵磁 相與鐵電相間有最強的彈性交互作用力。相較於氧化鐵鈷與鈦酸鉛的層狀結構(2-2)或氧 化鐵鈷粒子懸浮於鈦酸鉛中的結構(0-3)而言,disk-3 的氧化鐵鈷在磁滯曲線上有較低且 較不對稱的矯頑場及難以被飽和的磁化量,這些皆與鈦酸鉛在拉曼光譜中的 A1(2TO)和 A1(3TO)模態有較多的紅位移相吻合。ii
Stress-dependent interfacial phonon and ferromagnetic properties
in PbTiO
3-CoFe
2O
4multiferroic system
Student: Chih-Ya Tsai Advisor: Prof. Wen-Feng Hsieh
Institute of Electro-optical Engineering
National Chaio Tung University
Abstract
Abstract
We report on the relationship between local behavior of interfacial phonon and
ferromagnetic properties in three multiferroics consisting of different geometric shapes of
ferromagnetic CoFe2O4 (CFO) embedded in ferroelectrics PbTiO3 (PTO) studied by
micro-Raman spectroscopy. The energy of interfacial phonon and ferromagnetic properties
depend on stress due to not only the lattice misfit but also the degree of chemical bonding at
the interface between CoFe2O4 and PbTiO3 matrix. In one dimension (1D) embedded in 3D
or disk-3 type structure, the self-assembled CFO disks embedded in a PTO matrix, illustrates
iii
and the absence of saturation magnetization Ms of CFO matche with the more Raman shift of
A1(2TO) and A1(3TO) modes of PTO found in the disk-3 type than the other types of CFO and
vi
Content
Abstract (in Chinese)………. i
Abstract (in English)……….. ii
Acknowledgement……….. v
Content………vi
List of Figures……….... ix
List of Tables………... x
Chapter 1 Introduction
1.1 A review of ferroelectric and ferromagnetic materials………..……... 11.1.1 Ferroelectric materials and piezoelectricity……….…………... 1
1.2.1 Magnetism……… 4
1.2.2 Hysteresis loop of ferromagnetic materials...………...……….. 5
1.2.3 Magnetostriction...………...………... 6
1.3 Multiferroic materials………...……….8
1.3.1 Origin of multiferroics……….……… ..8
1.3.2 Classification of multiferroic materials………..………..….. .11
1.3.2.1 Single-phase multiferroics………...………. 12
vii
1.3.3 Applications of multiferroics………..……… 14
1.4 Motivation……… 15
1.4.1 Why multiphase magnetoelectric materials………. …15
1.4.2 Why micro-Raman system……….………… .15
1.5 Organization of the thesis………....16
References………. 18
Chapter 2 Theoretical Background
2.1 Magnetoelectric effect………...……….. 212.2 Raman scattering...…….…………... 28
2.2.1 Phonon modes of PbTiO3 system………... 33
2.2.2 Phonon modes of CoFe2O4 system…….………... 34
2.3 X-ray Diffraction...………... 36
References………. 40
Chapter 3 Experimental Details
3.1 Thin film preparation………...…413.1.1 0-3 type PTO-CFO system………... 41
3.1.2 2-2 type PTO-CFO system………... 42
3.1.3 1-3 type PTO-CFO system………... 43
viii
3.2.1 X-ray diffraction system……..……….43
3.2.2 Raman detection system…..………. 43
3.2.3 Magnetization measurement system……… 44
3.2.4 FESEM system………. 46
References………. 47
Chapter 4 Results and Discussion
4.1 Results of X-ray diffraction………..……….. 484.1.1 Preference of a-domain……….………... 48
4.2 Raman spectra of PTO-CFO system………... 51
4.2.1 Analysis of Raman spectra………... 51
4.2.2 Raman shift and coupling mechanism………... 53
4.3 Magnetic properties analysis………... 54
4.3.1 Nonsymmetrical Coercive Field………... 55
4.3.2 Magnetic Anisotropy………... 58 4.4 Summary………. 58 References……….……… 60
Chapter 5 Conclusion
5.1 Conclusion………..……….61 5.2 Perspective………...62ix
List of Figures
Fig. 1-1 Stucture of tetragonal perovskite……….. 2
Fig. 1-2 Unstressed and stressed ferroelectric crystal……… 3
Fig. 1-3 Ferroelectricity of threefold symmetry structure……….. 3
Fig. 1-4 Ferromagnetism……… 5
Fig. 1-5 Magnetization curve……….. 6
Fig. 1-6 Schematic illustration of multiferroics………. 9
Fig. 1-7 Schematic illustration of geometrical multiferroics……… 14
Fig. 2-1 Schematic diagram of nanostructure multiferroic types………. 24
Fig. 2-2 Induced polarization as a function of magnetic field………. 27
Fig. 2-3 Diagram of 0-3 composites and ME response……… 28
Fig. 2-4 Structure of magnetite………. 35
Fig. 2-5 Diffraction of x-ray………. 37
Fig. 2-6 Structure of tetragonal……… 38
Fig. 2-7 Simple cubic structure……… 39
Fig. 3-1 Schematic illustration of three connectivity schemes………. 41
Fig. 3-2 Top view of Disk-3 film………. 42
Fig. 3-3 A picture of FESEM……… 46
Fig. 4-1 SEM pictures of Disk-3 film……….. 48
Fig. 4-2 XRD diffraction pattern of multiferroics……… 49
Fig. 4-3 Micro-Raman spectra of multiferroics and PbTiO3 on different substrates………… 52
Fig. 4-4 Raman shift as a function of film types……….. 54
x
List of Tables
Table 1-1 The magnetostriction constants………. 8
Table 1-2 Phonon modes of PbTiO3………. 33
Table 2-2 Assignments of Raman modes in magnetite……… 35
Chapter 1 Introduction
1.1 A Review of Ferroelectric Materials
1.1.1 Ferroelectricity and Piezoelectricity
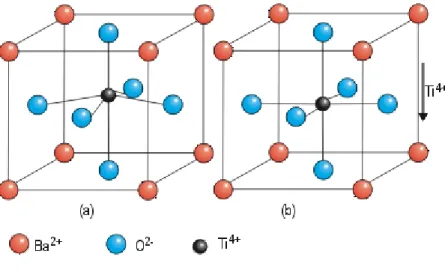
Ferroelectricity is a phenomenon that materials exhibit a spontaneous polarization on cooling below the Curie temperature (TC). It was discovered in the barium titanate (BaTiO3),
one of the pervoskite structure materials, in 1940s. The occurrence of electric diploes below Tc in the perovskite-structure crystals is due to the shift of center positive charge along c-axis
of the crystal. The plot of polarization versus electric field for the ferroelectric state shows a hysteresis loop. Owing to the hysteresis, ferroelectric materials have long been used in bulk form in a variety of fields. Today, ferroelectric materials are deposited in thin films and they are essential materials for a variety of devices such as ferroelectric random access memory (FRAM), infrared pyroelectric sensors, transistors, microwave electronics, electro-optic modulators and other integrated devices. Among many classes of ferroelectric materials, the perovskite compounds such as the lead lanthanum titanate (PLT) [1], lead zirconate titanate (PZT) [2], lead titanate (PT) [3], and barium titanate (BT) [4] have been the most intensively investigated.
Figure 1-1 Structures of perovskites: (a) tetragonal structure below the Curie temperature and (b) cubic structure above the Curie temperature.
All crystals in a ferroelectric state are also piezoelectric; a stress Z applied to the crystal will change the electric polarization. Similarly, an electric field E applied to the crystal will cause it to become strained. In schematic one-dimensional notation, the piezoelectric equations are
;
P
=
Zd
+
E
χ
e
=
Zs Ed
+
,where P is the polarization, Z the stress, d the piezoelectric strain constant, E the electric field, χ the dielectric susceptibility, e the elastic strain, and s the elastic compliance constant. A crystal may be piezoelectric without being ferroelectric; a schematic example of such a structure is given in Fig. 1-3. Quartz is piezoelectric, but not ferroelectric; barium titanate is both. For order of magnitude, in quartz d ≣ 10-7 cm/statvolt and in barium titanate d ≣ 10-5 cm/statvolt. The general definition of the piezoelectric strain constants is
(
k)
ik z ie
d
E
∂
=
∂
,where i ≣ x, y, z and k ≣ xx, yy, zz, yz, zx, xy. To convert to cm/stat-V from the values of dik given in m/V, just multiply by a factor of 3×10⁴[6]. The effect finds useful applications such as the production and detection of sound, generation of high voltages, electronic frequency generation, microbalances, and ultra fine focusing of optical assemblies. It is also the basis of a number of scientific instrumental techniques with atomic resolution, the scanning probe microscopes such as scanning tunneling microscopy (STM), atomic force microscope (AFM), scanning near-field optical microscopy (SNOM) etc.
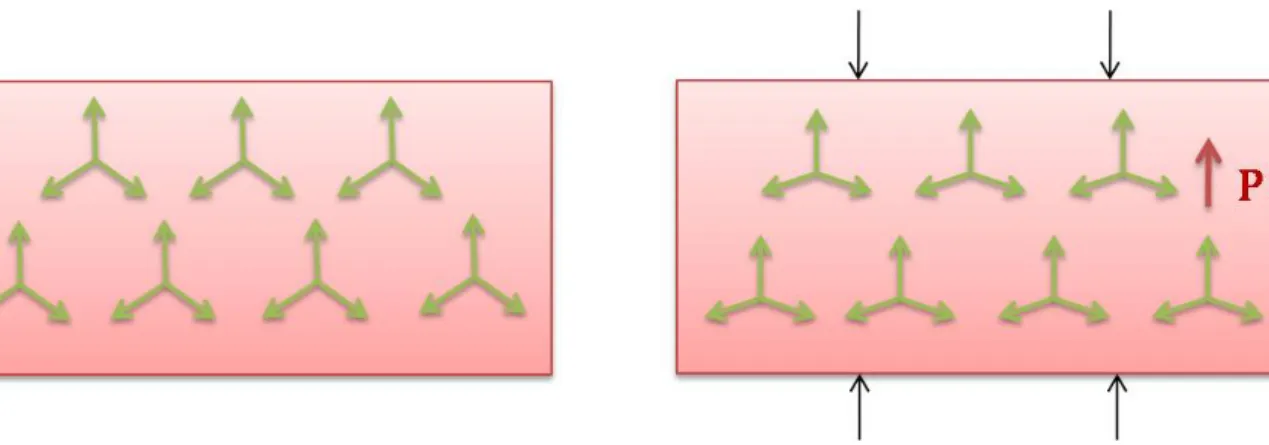
Figure 1-2 Unstressed (a) and stressed (b) ferroelectric crystal. The stress changes the polarization by ΔP, the induc d piezoelectric polarization. e
Figure 1-3 Ferroelectricity of threefold symmetry structure. (a) The unstressed crystal A+ 3B3-
1.2 A Review of Ferromagnetic Materials
1.2.1 Magnetism
The origin of magnetism lies in the orbital and spin motions of electrons and how the electrons interact with one another. The best way to introduce the different types of magnetism is to describe a net magnetization corresponding to the alignment of magnetic moments under an applied magnetic field [5].
“Ferromagnetism" describes the property only when all magnetic moments are strongly coupled and add a positive contribution to the net magnetization after setting the external magnetic field to zero. If some of the magnetic moments are partially anti-aligned and add a net magnetization, then the material is "ferrimagnetic". If the identical moments anti-align completely so as to have zero net magnetization, despite the magnetic ordering, then it is antiferromagnetism. All of the above alignment effects only occur at temperatures below a certain critical temperature, called the Curie temperature (for ferromagnets and ferrimagnets) or the Neel temperature (for antiferromagnets). Paramagnetism happens when the magnetic moments are very loosely coupled so that thermal energy randomizes their orientation. All atoms, including magnetic ones, exhibit diamagnetism, which is a small current induced to oppose the external magnetic field by Lenz’s law [5].
Figure 1-4 Ferromagnetism: (a) Ferromagnetic materials exists a strong coupling between magnetic atoms and the spins align in the same direction even at zero field. (b) An opposite coupled spins in antiferromagnetic materials (NiO, CoO) makes the net moment is zero. (c) Ferrimagnetism such as TbFe and Fe3O4 possesses unequal magnetic moments and hence nonzero moments.
1.2.2 Ferromagnetism and Hysteresis Loop
Ferromagnetic (ferrimagnetic) materials have a large and positive susceptibility to an external magnetic field. They exhibit a strong attraction to magnetic fields and are able to retain their magnetic properties after the external field has been removed. When the individual moments of the atoms are aligned with one another, a uniform magnetized region within a material forms and is called as domain. In these domains, large numbers of atom's moments (1012 to 1015) are aligned parallel so that the magnetic force within the domain is strong. When a ferromagnetic material is in the demagnetized state, the domains are nearly randomly organized and the net magnetic field for the part as a whole is zero. When a magnetizing force is applied, the domains become aligned to produce a strong magnetic field within the part. Iron, nickel, and cobalt are examples of ferromagnetic materials [6].
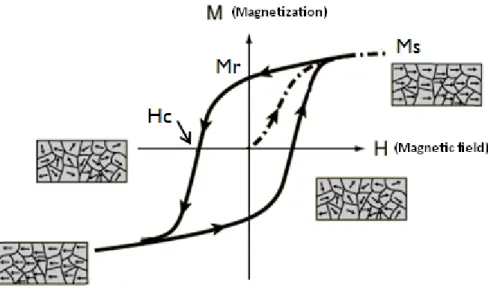
Figure 1-5 is a typical magnetization curve for ferromagnetic materials [6]. Magnetization (emu/cc) is plotted as a function of magnetic field intensity (Oe). In materials
science, the coercivity, also called the coercive field, of a ferromagnetic material is the intensity of the applied magnetic field required to reduce the magnetization of that material to zero after the magnetization of the sample has been driven to saturation. Coercivity is usually measured in oersted or ampere/meter units and is denoted HC. The saturation
magnetization (Ms) means the magnetization M stays constant even when the applied field is increasing continuously. After saturation, the external field is set to zero and the residual magnetization was called Remnant magnetization (Mr) [5].
Figure 1-5 The Magnetization curves and hysteresis loops for ferromagnetic materials.
1.2.3 Magnetostriction
Magnetostriction is the name given to the changes of size and shape of structure which accompany the magnetization of a ferromagnetic. The phenomenon was discovered by Joule J.P. and published in Philosophical Magazine in 1847 [7]. Nearly all ferromagnetic
materials exhibit a change in shape resulting from magnetization change. The fact that magnetization causes mechanical strain implies that mechanical stress will affect the magnetization. It is this inverse effect that gives magnetostriction phenomena, the chief importance, for causing external or internal mechanical stresses to have a profound influence on the magnetic properties of a body [6].
In describing anisotropic magnetostriction in a material one can refer to its magnetostrictive constants, λs, the strains produced at magnetic saturation, or to its
magnetoelastic coupling coefficients, Bij, the magnetic stresses causing λs [6]. In most
common materials, nickel, iron, and cobalt, the change in length is on the order of 10 parts per million. The highest room temperature magnetostriction of a pure element is that of Co which saturates at 60 microstrain. Fortunately, by alloying elements one can achieve "giant" magnetostriction under relatively small fields. The engineering era of magnetostrictive materials began with the discovery of giant (1000’s of ppm) magnetostriction in rare earth alloys during the 1960’s by A.E. Clark and others [8]. The culmination of research into a engineering alloy incorporating rare earth materials was Terfenol-D, a specially formulated alloy of Terbium, Dysprosium, and Iron that exhibits large magnetostriction at room temperature and relatively small applied fields [9].
Table 1-1 Magnetostriction Constrants λ100 and λ111 (×106) at 4.2K and Room Temperature for several materials [5] T = 4.2K Room Temperature λ100(λγ,2) λ111(λε,2) λ100(λγ,2) λ111(λε,2) Polycrystal λs 3d Metals BCC-Fe 26 -30 21 -21 -7 HCP-Cou (-150) (45) (-140) (50) (-62) FCC-Ni -60 -35 -46 -24 -34 BCC-FeCo -- -- 140 30 -- a-Fe80B20 48 (isotropic) -- -- -- +32 a-Fe40Ni40B20 +20 -- -- -- +14 4f Metal / Alloys Gdu (-175) (105) (-10) 0 -- Tbu -- (8700) -- (30) -- TbFe2 -- 4400 - 2600 1753 Tb0.3Dy0.7Fe2 -- -- -- 1600 1200 Spinel Ferrits Fe3O4 0 50 -15 56 +40 MnFe2O4 -- -- (-54) (10) -- CoFe2O4 -- -- -670 120 -110 Garnets YIG -0.6 -2.5 -1.4 -1.6 -2 Hard Magnets Fe1.4Nd2Bu -- -- -- -- -- BaO•6Fe3O4u -- -- (13) -- --
1.3 Multiferroic Materials
1.3.1 Origin of Multiferroics
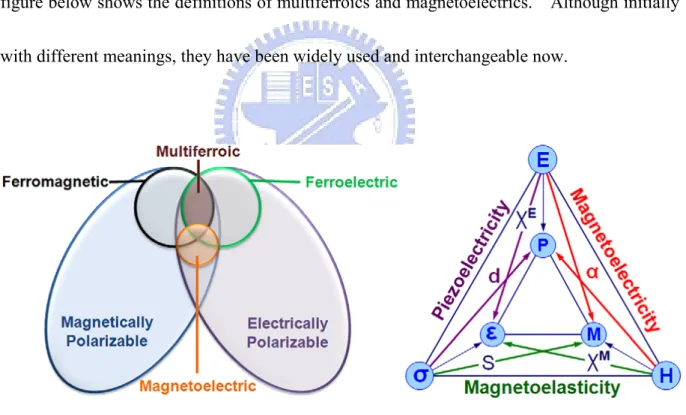
Materials in which ferromagnetism and ferroelectricity occur simultaneously in the same composite and allow coupling between the two order-parameters are known as multiferroics [10]. As a consequence, they have a spontaneous magnetization that can be switched by an applied electric field and a spontaneous electrical polarization that can be switched by an applied magnetic field. This is the famous magnetoelectric effect (ME effect) [11]. The figure below shows the definitions of multiferroics and magnetoelectrics. Although initially with different meanings, they have been widely used and interchangeable now.
Figure 1-6 Schematic illustration of multiferroics. (a) Relationship between multiferroic and magnetoelectric materials illustrates the requirements to achieve both in a material. (b) Schematic illustrating different types of coupling present in materials. Much attention has been given to materials where electric and magnetic order are coupled known as magnetoelectric materials.
laboratory. The first discovered multiferroic material was nickel iodine boracite, (Ni3B2O13I)
[12]. This discovery was followed by the synthesis of several multiferroic boracites compounds, all of which have complex structures with many atoms per formula unit and more than one formula unit per unit cell. The large number of inter-ionic interactions in these materials prevented isolation of the essential factors causing multiferroicity and the nature of the coupling between the magnetic and electric polarization, and structural order parameters. The search for other multiferroics began in Russia as early as the 1950s, with the replacement of some of the B cations contenting zero d-orbital electrons in ferroelectric perovskite oxides by magnetic dn cations [13]. The first synthetic multiferroic material, (1−x)PbFe0.66W0.33O3 – xPbMg0.5W0.5O3 [14], was produced at the beginning of the 1960s.
In this case, Mg2+ and W6+ ions were diamagnetic and caused ferroelectricity whereas d5 Fe3+ ions are responsible for the magnetic ordering. As a result of the dilution of the magnetic ions, these materials all have rather low Curie or Neel temperatures.
In the past few years, there has been renewed interest in studying the perovskite-based multiferroic materials, such as rare earth manganates TbMn2O5, YMnO3, BiMnO3, which
have higher Curie temperatures and large magnetoelectric effects. Furthermore, recently efforts have been made to synthesize the new multiferroic in the form of thin film, by employing ferroelectric and ferromagnetic compounds to make a nanocomposite, a superlattice, or a multilayer structure [18].
However the single-phase ME materials show weak ME coupling due to the basic problem that the electric configurations favoring magnetization are antagonistic to those that favor polarization [19]. Van Suchtelen proposed the concept of a product property in two-phase composite materials in 1972, arising from an elastic coupling between two phases of different properties. The ME effect in a composite material having one magnetostrictive and one piezoelectric phase is one such product tensor property. Scientists in Philips Laboratory experimentally found that large ME effect could be produced in such composites [7]. The ME effect obtained in this way can reach about hundred times larger than that in single-phase multiferroic one.
A milestone in the development of ME bulk composites was the appearance of one containing giant magnetostrictive rare-earth-iron alloy Tb1-xDyxFe2 (Terfenol-D) in 2001.
The Terfenol-D/PZT and Terfenol-D/PVDF composites have been experimentally found to exhibit a giant ME effect [20]. In 2004, Zheng et al. reported a pioneering experiment on nanostructured films of the BaTiO3-CoFe2O4 system with 1-3 connectivity schemes [11]. In
the last two years, a series of experimental and theoretical work on such multiferroic oxides has been reported. Such multiferroic nanostructures have become the topic of the day in the multiferroic composites field, and they promise potential applications of ME composites in microelectronic devices.
1.3.2 Classification of multiferroic materials
Magnetoelectric materials with coexistence of at least two ferroic orders are divided into single-phase and multiphase multiferroics by their composition and phase connectivity.
1.3.2.1 Single-phase multiferroics
Single-phase multiferroics contains only one component but posses both ferroelectric and ferromagnetic properties. However, there is a contra-indication between the conventional mechanism for cation off-centering in ferroelectrics (which require formally empty d orbitals), and the formation of magnetic moments (which usually results from partially filled d orbitals). This is the main challenge in studying single-phase multiferroics since 1960s. For ferroelectricity and magnetism to coexist in a single phase, the atoms that move off center to form the electric dipole moment should be different from those that carry the magnetic moment. Different mechanisms to single-phase multiferroics were studied and the most common routes were listed [18].
In the magnetic perovskite-structure oxides and related materials, multiferroism is most commonly achieved by making use of the stereochemical activity of the lone pair on the large (A-site) cation to provide the ferroelectricity, while keeping the small (B-site) cation magnetic. This is the mechanism for ferroelectricity in the Bi-based magnetic ferroelectrics, the most widely studied of which is bismuth ferrite, BiFeO3. A second route to multiferroism is
provided by “geometrically driven” ferroelectricity, which is compatible with the coexistence of magnetism; the antiferromagnetic ferroelectrics YMnO3 and BaNiF4 fall into this class
To be ferroelectric, a material must be insulating otherwise the mobile charges would screen out the electric polarization. This is a common problem in the case of magnetic ferroelectrics, because magnetic transition metal ions are often able to accommodate a wider range of valence states than their diamagnetic counterparts, leading in turn to non-stoichiometry and hopping conductivity. Clearly many potential combinations of lone pairs and transition metals remain to be explored, but in all cases, the stoichiometry must be carefully controlled so that the transition metal d electrons provide magnetism without also contributing to electronic transport. Therefore, detailed characterization of the domain structure, dynamics for improving magnetoelectric coupling, and reduction of the leakage current density and the coercive field, are critical challenges that need to be addressed before BiFeO3-based films will be candidates for integrated microelectronic devices such as storage
elements in non-volatile ferroelectric memories [7].
1.3.2.2 Multiphase multiferroics
Multiphase multiferroics are investigated as an alternative approach using bonded magnetostrictive and piezoelectric materials to overcome the low ME coupling and low-temperature problems of single-phase multiferroics. The classification of multiphase multiferroics is based on the phase connectivity. They are divided into the following types: As for piezoelectric composites,the ME composites could have various connectivity schemes, but the common connectivity schemes are 0-3–type particulate composites of piezoelectric
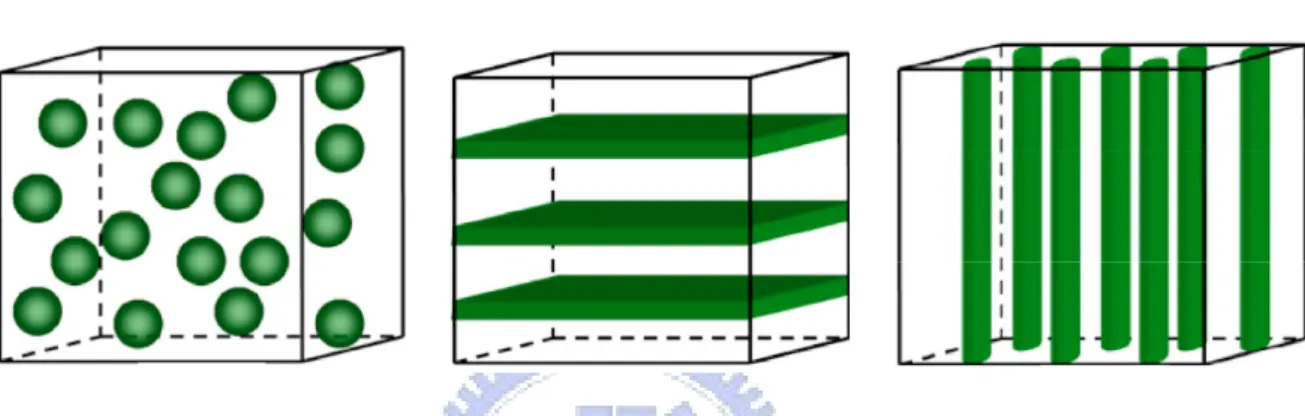
and magnetic oxide grains, 2-2–type laminate ceramic composites consisting of piezoelectric and magnetic oxide layers, and 1-3–type fiber composites with fibers of one phase embedded in the matrix of another phase, as shown in Fig. 1-7. BaTiO3, PZT, PbMgNbO3-PbTiO3, etc.,
are usually chosen as the piezoelectric ceramic phase, and ferrites usually as the magnetic phase. [7]
Figure 1-7. Schematic illustration of three bulk composites with the three common connectivity schemes: (a) 0–3 particulate composite, (b) 2–2 laminate composite, and (c) 1–3 fiber/rod composite.
1.3.3 Applications of multiferroics
Multiferroics are of interest for memory and logic device applications, as the coupling between ferroelectric and magnetic properties enables the dynamic interaction between these order parameters. Recently, Ying-Hao Chu performed an experiment of using electric-field to control local ferromagnetism by making the magnetoelectric multiferroic structure. Their work reveals the possibility to locally manipulate ferromagnetism with an electric field for ultra-thin device-scale uses [22].
Besides, promising applications include magnetic field sensors, transducers, filters, oscillators, phase shifters, memory devices, and so on. At the resonance frequency the ME composite can be used as a transducer which converts the microwave magnetic field into a microwave electric field. Because of the shift in the resonance frequency in a static
magnetic or electric bias field the composite materials hold promise in electrically tunable microwave applications such as filters, oscillators, and phase shifters. Due to the hysteretic nature of the ME effect, the composites may find applications in memory devices. This coupling could, in principle, permit data to be written electrically and read magnetically in memory technologies. [7]
1.4 Motivation
1.4.1 Why multiphase magnetoelectric materials
In a single-phase compound, the magnetoelectric effect requires long range atomic moments and electric dipoles. For this reason, the effect is often very weak. On the other hand, the ME coupling of multi-phase multiferroic mediated by mechanical stress at the interface between two phases in a composite has greatly enhanced the magnetoelectric coupling in thin films based on either nanocomposites or superlattices. In this case, by matching a suitable piezomagnetic and an electrostrictive, it can be a suitable way to obtain a large value of the magnetoelectric coefficient and hold great potential for future applications.
1.4.2 Why micro-Raman system
To obtain a fundamental understanding of multiferroics, the experimental observation of the coupling mechanism between the ferroelectric and ferromagnetic orders is of great importance. For multiphase multiferroics, the physical properties at the interfaces is an important aspect to achieve functional multiferroics as the ME interaction happens here. With a scale of single atomic boundary, the polarization and magnetization will reconstruct by chemical bonding, exchange interactions, and strain effects. On the other hand, one can
directly obtain the information about the polarization states and the variation of structure from the phonons in Raman spectra. Phonons at the interface are sensitive to strain induced by lattice mismatch and the broken symmetries. However, very little is known about the behavior of phonons in magnetoelectric multiferroics, even though investigations of phonons have in the past played a crucial role in the understanding of classic ferroelectrics.
Recently, some studies on behaviors of phonons in multiferroics, the variation of phonon energy in spectrum is not obvious and relations between phonon shifting and coupling mechanism are not investigated [23-25]. In our work, we proposed a micro-Raman detection method in which the micro-focused light is employed to measure the coupled interactions across micro hetero-interfaces. Not only the stress dependence of phonon shifting at the interface was observed in Raman spectrum but also the distinct magnetic properties in M-H hysteresis is studying and discussed in three different geometrical CoFe2O4-PbTiO3
multiferroic systems.
1.5 Organization of the thesis
There are five chapters in this thesis. In Chapter 2, we will introduce the theory of phonon modes in Raman spectra, hysteresis loop of ferromagnetic materials, and X-ray diffraction. Chapter 3 describes the experimental details of sol-gel methods and spin-coating process. We will present the results and discussion about multiphase multiferroics of three geometric structure on the subjects including structure analysis, coupling mechanism induced
phonon modes shifting, and unsaturated magnetization and coercivity. In the last chapter, we conclude the investigations on multiphase multiferroics thin film and proposed several topics worthy of further studying.
References
[1] S. Bhaskar, S. B. Majmder, P. S. Dobal, R. S Katiyar, and S.B. Krupanidhi, J. Appl. Phys.
89, 5637 (2001).
[2] J. Cheng and Z. Meng, Thin solid films 385, 5 (2001).
[3] C. H. Wang and D. J. Choi, J. Am. Ceram. Soc. 84, 207 (2001). [4] H. Kumazawa and K. Masuda, Thin Solid Films 353, 144 (1999).
[5] C. Kittel, Introduction to solid state physics, 8th ed., (Wiley, New York, 2004). [6] R. C. O’Handley, Modern Magnetic Materials, (Wiley, New York, 2000).
[7] C. W. Nan, M. I. Bichurin, S. Dong, D. Viehland and G. Srinivasan, J. Appl. Phys. 103, 031101 (2008).
[8] E.P. Wohlfarth, Ferromagnetic Materials, Volume 2 (North Holland, 1980). [9] Young and D. Hugh, University Physics, 8th Ed., (Addison-Wesley, 1992).
[10] V. M. Petrov, G. Srinivasan, M. I. Bichurin and A. Gupta, Phys. Rev. B 75, 224407 (2007).
[11] Zheng H, Wang J, Lofland SE, Ma Z, Mohaddes-Ardabili L, Zhao T, Salamanca-Riba L, Shinde SR, Ogale SB, Bai F, Viehland D, Jia Y, Schlom DG, Wuttig M, Roytburd A and Ramesh R, Science 303, 661 (2004).
[12] Ascher E, Rieder H, Schmid H and St"ossel H, J. Appl. Phys. 37, 1404 (1966). [13] Smolensky G A, Agranovskaya A I and Isupov V A Sov., Phys. Solid State 1, 149
(1959).
[14] Smolensky G A, Isupov V A, Krainik N N and Agranovskaya A Isv., Akad. Nauk SSSR, Ser Fiz. 25, 1333 (1961).
[15] Brixel W, Rivera J P, Steiner A and Schmid H, Ferroelectrics 79, 201 (1988). [16] Astrov D. N., Alshin B. I., Tomashpolski Y. Y. and Venevtsev Y. N., Sov. Phys. 28, 1123 (1969).
[17] Drobyshev L A, Alshin B I, Tomashpolski Y Y and Venevtsev Y N, Sov. Phys., 14, 634 (1970).
[18] W. Prellier, M. P. Singh and P. Murugavel, J. Phys. Condens. Matter 17, 7753 (2005). [19] Junyi Zhai, Zengping Xing, Shuxiang Dong, Jiefang Li, and Dwight Viehland, J. Am. Ceram. Soc., 91, 351 (2008).
[20] S. Dong, J. F. Li, and D. Viehland, Appl. Phys. Lett. 83, 2265 (2003). [21] R. Ramesh and Nicolaa., Nature Materials, 6, 21 (2007).
[22] Y. H. Chu, Lane W. Martin, Mikel B. Holcomb, Martin Gajek, Shu-Jen Han, Qing He, Nina Balke, Chan-Ho Yang, Donkoun Lee, Wei Hu, Qian Zhan, Pei-Ling Yang, Arantxa Fraile-Rodríguez, Andreas Scholl, Shan X. Wang, and R. Ramesh, Nature Materials, 7, 478 (2008).
[23] J. Barbosa, B. G. Almeida, J. A. Mendes , A. G. Rolo, J. P. Araújo, and J. B. Sousa, J.Appl. Phys. 101, 9 (2007).
[24] N. Ortega, A. Kumar, P. Bhattacharya, and Katiyar, R. S., Phys. Rev. B 77, 10 (2008). [25] H. M. Zheng, J. Kreisel, Y. H. Chu, R. Ramesh, and Lourdes Salamanca-Riba, Appl. Phys. Lett. 90, 3 (2007).
Chapter 2 Theoretical Background
2.1 Magnetoelectric Effect
[1]The magnetoelectric response is the appearance of an electric polarization upon applying a magnetic field and the appearance of magnetization upon applying an electric field. The coupling interaction between ferroelectric and ferromagnetic materials in multiphase multiferroics has been found to be due to elastic interaction as was the case in bulk composites.
Magnetic-field-induced electric polarization (MIEP) in nanostructured multiphase multiferroic composite films was studied by using the Green’s function approach. As the coupled interaction between ferroelectric and ferromagnetic phases in the multiferroic nanostructures is an elastic interaction, the constitutive equations for the coupling magnetic-mechanical-electric interactions in the nanostructured films can be expressed by direct notation for tensors as
T s s
c - e E - c
-
,
D e
E
H P ,
B
( ,E,H)H M ,
ms sσ
ε
ε
ε κ
α
μ ε
=
=
+
+
+
=
+
σ
(2.1-1)where σ, ε, D, E, B, and H are the stress, strain, electric displacement, electric field, magnetic induction, and magnetic field, respectively; c and к are, respectively, the stiffness at constant fields and the dielectric constant at constant strain; the permeability μ strongly depends on ε and electric and magnetic fields; e (eT being the transpose of e) is the piezoelectric coefficient;
and εms is the magnetostrictively induced strain related with the magnetic field dependent magnetostriction constants (e.g., λ001 and λ111) of the ferromagnetic phase; α is the
magnetoelectric coefficient. These are the same as the case for bulk multiferroic composites. However, in comparison to the bulk composites, there exist remarkable residual stress σs (or
residual strain εs), spontaneous polarization Ps and magnetization Ms in the multiferroic films.
The effective properties (denoted by the starred quantities below) of the multiferroic films can still be defined as the averaged fields (denoted by < >), e.g., <D> = e*<ε> + к*<E> + α*<H> + Ps. We considered the ME effect of such nanostructured films. Under only applied magnetic field, the effective polarization in the mechanically clamped films is
22
P
sP
=
α
* H
<
> +
(2.1-2)In a state of static equilibrium,
( )
( )
( )
0
ij i i j i ix
D x
B x
x
x
x
σ
∂
=
∂
=
∂
∂
∂
∂
=
. (2.1-3)By solving the equilibrium equations (2.1-3) under the homogeneous magnetic-mechanical-electric (H0-ε0-E0) boundary conditions in terms of the Green’s function approach [2], the local fields within the composite films can be obtained as
0 0 0 s 0 0 s
G (c c ) G e E G (c
),
E E
G e
G (
)E G ( H P ),
H H
G (
)H G M ,
u o u T u ms s φ φ φ ψ ψε ε
ε
ε
κ κ
α
μ μ
=
+
−
+
−
+
=
+
+
−
+
+
=
+
−
+
σ
(2.1-4)Gu, GФ, and GΨ are the modified displacement, electric and magnetic potential Green’s
functions for the homogeneous medium [2, 3]. Substitution of Eq. (2.1-4)into(2.1-1) directly gives explicit solutions for the local σ, D, and B, also as a function of ε0, E0, and H0. By averaging these solutions for local field quantities and eliminating ε0, E0, and H0 from them, one can get the effective polarization in the mechanically clamped films as
23 33 66 s s 66 33 s
P
P (
*)T G [P eT G (c
)]
(e * e)T G (c
e T G P ) ,
u ms s u ms T s φ φκ κ
ε
σ
ε
σ
=< +
−
−
+
+
−
+
+
>
u p (2.1-5)where T66 and T33 are two so-called t-matrix tensors. This equation is quite general and independent of the models assumed for the topology of the phases in the composite film.
For the (00l)-oriented multiferroic nanostructure, only the volume average is necessary in Eq. (2.1-5). Ferroelectric phase is taken as the homogeneous reference medium, since the ferroelectric phase with high volume fraction is a matrix phase. Furthermore due to the fact that e = 0 and Ps = 0 for the ferromagnetic phase, εms = 0 and Ms = 0 for the ferroelectric phase,
and α = 0 for both phases, Eq. (2.1-5) can be rewritten as
s s s 1
P (1
){P
(
*)G (P e G
)
(e * e )G (
e G P )}
e *[I G (c
c )] (c
),
p p s p u p T s u m p m ms m sf
f
φ φκ
κ
σ
σ
ε
σ
−= −
+
−
−
+
−
+
+
−
−
+
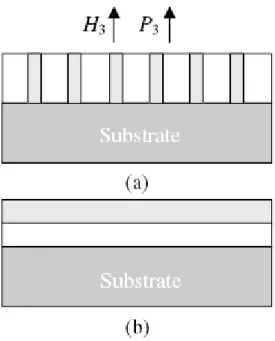
(2.1-6)Fig. 2-1 Schematic illustration of the nanostructured multiferroic BaTiO3-CoFe2O4 films in (a) the 1-3 type
where the CoFe2O4 nanopillars (shaded) are embedded in the BaTiO3 matrix, and in (b) the 2-2 type where
the BaTiO3 layer is first deposited on the substrate SrRuO3 and then the CoFe2O4 layer (shaded) on the
piezoelectric layer.
For the 1-3 type (using the terminology introduced by L. E. Cross and co-workers) nanostructured composite films with (00l) ferromagnetic nanopillars embedded in a ferroelectric matrix, the effective electric polarization P along the symmetric direction is easily obtained from Eq. (2.1-6) as
31 3 3 11 11 11 12
2 (1
)
= (1- ) +
(
).
p p m s p pf
f e
P
f P
k
c
c
σ
σ
−
−
+
−
(2.1-7)In this case that the height of pillars is much larger than their diameter (e.g., 20–30 nm in diameter and 400 nm in height for nanopillars ), where
(
11p 12p) (1
)(
11m 12mk
=
f c
+
c
+ −
f
c
+
c )
;11
p
σ
andσ
11mare in-plane total stresses including residual stresses and magnetostrictively
induced stresses, respectively, in the ferroelectric and ferromagnetic phases, and are expressed as 25 ( ) ( ) ( ) ( ) ( ) ( ) 11
(
11 12)
11 13 33 p m p m p m p m p m p mc
c
c
σ
=
+
ε
+
ε
, (2.1-8) whereε
11p m( ) andε
33p m( )are in-plane and out-of-plane total strains including residual strains (
ε
s11 andε
s33) and magnetostrictively induced strains ( msij
ε
) upon applying the magnetic field, respectively, in the ferroelectric and ferromagnetic phases, e.g., 11m 11ms m11s
ε
=
ε
+
ε
and 33 33 m ms 33 m sε
=
ε
+
ε
. At zero magnetic field,
p ij
ε
andε
ijm are equal to their residual strains, i.e., p(
0)
psij ij
H
ε
=
=
ε
andε
ijm(
H
=
0
)
=
ε
sijm.
For the 2-2 type nanostructured composite films with (00l) ferroelectric and ferromagnetic nanolaminates as shown in Fig. 1(b), the effective electric polarization
P
3 can also be directly obtained from Eq. (2.1-6) as33 33 33 3 3 33 33 33 33 33
(1
)
(1
)
(
),
m p m p m sf
f e
P
f
P
c
κ
κ σ σ
κ
κ
−
= −
+
−
(2.1-9)in the case that the thickness of a layer (e.g., 30 nm [4]) is much less than the macroscopic size of the film plane, where 33 33p
(1
) ,
33mc
=
fc
+ −
f c
33 33p(1
)
33mf
f
κ
=
κ
+ −
κ
;σ
33p and 33 mσ
are out-of-plane total stresses including residual stresses and magnetostrictively induced stresses, respectively, in the ferroelectric and ferromagnetic phases, and are expressed as( ) ( ) ( ) ( ) ( )
33
2
13 11 33 33p m p m p m p m p m
c
c
.
σ
=
ε
+
ε
(2.1-10)At zero magnetic field, 11p m( )
(
0)
p m11( ) sH
ε
=
=
ε
and 33p m( )(
0)
p m33( ) sH
0.
ε
=
=
ε
=
26
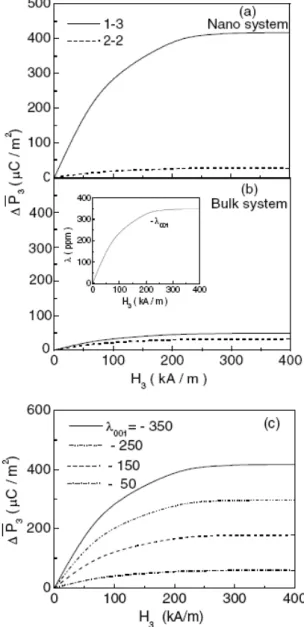
These explicit equations show that the effective electric polarization is sensitive to residual strains and spontaneous polarization in the films, materials constants of the two phases and the ways of their combination, and applied magnetic field. Of particularly interesting to note is that a large ME effect is obtained in the 1-3 films at room temperature. When the applied magnetic field increases from zero up to 240 kA/m (≈ 0.3 T), the ME effect of the 1-3 multiferroic BaTiO3-CoFe2O4 film is about 400 μC/m2, comparable with that in monophase
RMnO3 observed at low temperature and high magnetic field [5]. In comparison, the MIEP in
the 2-2 BaTiO3-CoFe2O4 film is quite low and much less than that in the 1-3 type. The main
reason is attributed to the tremendous clamping effect in the 2-2 type film, where the in-plane gigantic constraint effect greatly inhibits the magnetostriction. For comparison, the 1-3 and 2-2 bulk composites [2] of BaTiO3-CoFe2O4 were calculated as well, as shown in Figure 2-2,
where the residual stress σs and the spontaneous polarization Ps were neglected. As seen, the
1-3 bulk composites exhibit lower MIEP than the 1-3 nanostructured counterparts, and the 2-2 bulk composites also exhibit lower MIEP than the 1-3 type.
Fig. 2-2 Dependence of the magnetic-field-induced polarization P3 on the magnetic field for (a) the
nanostructured films and (b) the bulk composites of BaTiO3= CoFe2O4 with f = 0.35 at room temperature.
The inset in (b) is the magnetostrictive behavior taken for CoFe2O4. (c) Effect of the magnetostriction of the
ferromagnetic phase on P3 for this 1-3 type films. [After Nan ref.1]
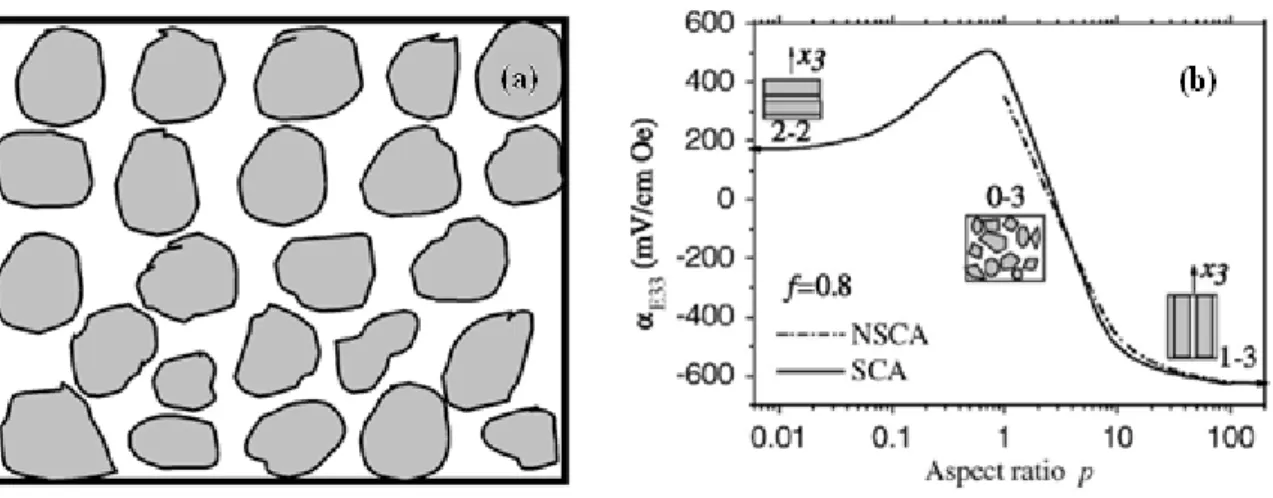
Fig. 2-3 Diagram of 0-3 composite and the ME response: (a) 0-3 multiferroic composite with high concentration of particulate magnetic phase well dispersed in the piezoelectric phase. (b) ME response of CoFe2O4-BaTiO3 ceramics plots as a function of effect of the grain shapes and phase connectivity. [After
Nan ref. 10]
The 0-3 particular composites with ferrite grains in ferroelectric matrix were also calculated by the same method. It is obvious that the grain shape and phase connectivity have a significant effect on the ME response of the composites. Right hand side of the Fig. 2-3 shows the 1-3 type obtains high ME response while the 0-3 type is quite low.
2.2 Raman Scattering Theorem
Infrared (IR) and Raman spectroscopy both measure the vibration energies of molecules but these methods rely on different selection rules. The possible vibrations of a molecule are sensitive to IR absorption if the vibration results in a change in the dipole moment. However, for a vibration to be Raman active, the polarizability of the molecule must change with the vibrational motion. For bonds with a strong dipole moment (which are IR active) the polarizability is usually low. For bonds which have a weak dipole moment (which are IR
inactive) the polarizability is usually high and the vibrational states of the bond are Raman active. IR and Raman activity are complimentary and the two techniques are used to fully characterize the vibrational states of molecules.
For infra-red (IR) wavelengths, absorption must in some way be related to a variation in the dipole moment associated with molecule. One atom of the molecules has a local charge ∆q then the rest of atoms have charge - ∆q and the dipole moment μ, is given by
μ
=
Δ
q l
⋅
,
(2.2-1) where l is the separation of the charges.Electromagnetic wave can be absorbed or emitted by a medium if during its interaction there is a change in the charge distribution within the medium. During the interaction with photon, the dipole moment μ will change, thus can rewrite the dipole moment as
0
Q
Q
,
μ
μ
=
μ
+
∂
∂
(2.2-2) where is the displacement from the equilibrium positions . The total Hamiltonian is described as ( eqm Q = r−r ) req m 0 intH
=
H
+
H
, (2.2-3) where Hint = E⋅μ 0expresses the interaction of an atom with a photon to the unperturbed HamiltonianH .
Thus the transition moment, R can be written as
R =
∫
ψ
iH in tψ
f = 〈i H in t f 〉 (2.2-4) thus, 0 ( ) R i Q E f i E f Q Qμ
μ
μ
∂ ∂ = 〈 + ⋅ 〉 = 〈 ⋅ 〉 ∂ ∂ . (2.2-5)IR absorption occurs as the transitionR ≠0, in other words there must be a change in the dipole moment due to vibration of the molecule which is induced by the applied field E, since the transition probability P is equal to R2. The condition that an IR absorption or emission must be associated with a change in dipole moment is known as the dipole selection rule. The dipole selection rule plays an important role in IR spectroscopy because it tells us whether a molecule will be IR active or not.
When light passes through a medium, most of the light is reflected, transmitted, absorbed, elastic scattered, or inelastic scattered. Raman scattering is an inelastic scattering process. Consider the light encounters the medium, the electromagnetic field of the incident radiation, E, interacts inelastically with a molecule. The electric field may induce an electric dipole in the molecule, given by
,
P
= i
α
E
(2.2-6) where α is referred to as the polarizability of the molecule and P is the polarization, defined as dipole moment per unit volume. The variation of α is correlated to the crystal coordinatesystem in which the molecule vibrates and it can be expressed as: 31 0 0
( )
(
α
) .
α
α
θ
θ
∂
=
+
∂
(2.2-7)If the vibration is simple harmonic oscillating:
0cos 2 mt
θ θ
=πν
, (2.2-8)where θ is amplitude and 0 ν is the vibrational frequency. Assume a monochromatic m
incident EM wave of frequency v0 has electric field:
0cos 2 0
E=E πν t. (2.2-9)
Combing the equations above
0 0 0 0 0 0 0 0 0 0 0 0 0 0 0 0 [( ) ( ) cos 2 ] cos 2 1 ( ) cos 2 ( ) cos 2 ( ) 2 1 ( ) cos 2 ( ) . 2 m m m P t E t E t E E t
α
α
θ
πν
πν
θ
α
tα
πν
θ
π ν ν
θ
α
θ
π ν ν
θ
∂ = + ∂ ∂ = + ∂ ∂ + + ∂ − (2.2-10)From Eq. (2.2-10), the three different scattering processes of linearly electric dipole moments are respectively, Rayleigh scattering possessing the same frequency with incoming light ν , 0 the Stoke scattering with a low frequency of ν ν0− m, and the high frequency ν0+νm known
as anti-Stoke lines. Those lines on the low frequency side of the exciting lines (i.e., υ0 - ∆υi, i
= 1, 2…….) are always matched by lines on the high frequency side (i.e., υ0 + ∆υi, i = 1,
2…….) but the latter are much weaker when the scattering medium is at room temperature. Raman scattering is inherently a weak process, but laser provides enough intensity that the
spectra can be routinely measured.
The incident phonon loses its energy by producing a phonon (Stokes shifted), or gain energy and momentum by absorbing a phonon (anti-Stokes shifted), according to the energy and momentum conservation rules:
s i
h
ν
=
h
ν
±
h
Ω
, (2.2-6)s
i
q
= ±
q
K
, (2.2-7)where υ0 and υs are the incoming and scattered phonon frequencies, qi and qs are the incoming
and scattered phonon wavevectors, Ω and Κ are the phonon frequency and wavevector, respectively.
All the Raman mode frequencies, intensities, line-shape, and line-width, as well as polarization can be used to characterize the lattice and impurities. The intensity gives information on crystallinity. The line-width increases when a material is damaged or disordered, because damage or disorder occurs in a material will increase phonon damping rate or relax the rules for momentum conservation in Raman process. All these capabilities can be used as a judgment for layered microstructure as well as bulk materials, subject only to the limitation that the penetration depth of the exciting radiation range from a few hundred nanometers to few micrometers.
2.2.1 Phonon Modes of PbTiO
3System
PbTiO3 belongs to the (P3m3) space group, with one formula unit per primitive cell, in
the cubic (paraelectric) phase (see Table 2-1 [6]). Thus there are 12 optic modes at the Гpoint of the Brillouin zone. The optic modes transform the 3T1u + 2T2u irreducible representations
of the Oh point group. The T1u modes are infrared active and T2u is the so-called “silent mode”
since it is neither infrared nor Raman active. 1
h
O
In the ferroelectric tetragonal phase [ (P4mm) space group] each triply degenerate T1u
mode splits into two modes transforming as the A1 + E irreducible representations of the C4v
point group. The silent mode also, in principle, splits into B1 + E modes that are Raman
active; so that the single feature that one measures for these phonons is B1 + E modes.
However, because of the long-range electrostatic forces, the situation for the T1u modes is more
complicated. Each of these optic modes can have a polarization transverse to the direction of propagation (TO modes) as well as polarization along the direction of propagation (LO modes).
1 4v
C
Table 2-1 Phonon frequencies (cm-1) in PbTiO
3 single crystal and thin film [After I. Tauchi [9]]
Single crystal Thin film Phonon mode P ~ 0 GPa P ~ 1.35 GPa Pt/Si
E(1TO) 89 80 80 A1(1TO) 127 117 118 E(2TO) 221 201 209 B1+E 290 287 289 A1(2TO) 364 336 334 E(2LO)+A1(2LO) 445 - 443 E(3TO) 508 504 504 A1(3TO) 651 607 604 E(3LO)+A1(3LO) 717 746 728
2.2.2 Phonon Modes of CoFe
2O
4System
Spinel CoFe2O4, a cubic ferromagnetic oxide with high coercivity, moderate saturation
magnetization, as well as remarkable chemical stability and mechanical hardness, has been extensively studied. Spinels can be divided into two kinds according to their structures. One is ‘normal’ spinel, with all the divalent (A) cations on the tetrahedral (T) sites and the trivalent (B) cations on the octahedral (O) sites, which can be represented by the formula A(BB)O4.
The other is ‘inverse’ spinel, B(AB)O4, in which the divalent cations occupy the O-sites and the
trivalent cations are equally divided among the T- and remaining O-sites.
CoFe2O4 has a cubic inverse-spinel structure with
O
7h(F d m3 ) space group, which givesrise to 39 normal modes:
Г = A1g + Eg + F1g + 3F2g + A2u + 2Eu + 4F1u + 2F2u,
where five optic modes are Raman active (A1g + 1Eg + 3F2g) and four are infrared active (4F1u).
35
Shebanova et al., [7] performed polarized experiments on an oriented single crystal providing a new interpretation of the Raman spectrum with the following assignment for symmetries of the observed modes: A1g for 668 cm-1, Eg for 306 cm-1, and T2g for 538, 193, and 450 - 490 cm-1.
Since Fe3O4 with the cubic inverse-spinel structure belonging to the same space group as
CoFe2O4 has been widely investigated, we can take the Raman spectra of Fe3O4 as a reference.
Table 2-2 shown below shows the experimental assignment on the Raman active modes of Fe3O4 from different authors.
The primitive unit cell of magnetite (Figure 2-4) [7] contains one unit where iron atoms are coordinated octahedrally (D3d), and two FeO4 units with the tetrahedral coordination (Td).
Group-theoretical and lattice-vibration analyses based on the quasimolecular description of the spinel structure have led to the following description of normal mode motions of the FeO4
tetrahedron: A1g - symmetric stretch of oxygen atoms along Fe-O bonds, Eg and T2g (3) -
symmetric and asymmetric bends of oxygen with respect to Fe, respectively, T2g (2) -
asymmetric stretch of Fe and O, T2g (1) - translatory movement of the whole FeO4. There are
Figure 2-4 Primitive unit cell of magnetite.
Table 2-2 Summary of the symmetry assignments of Raman modes on magnetite [7]
Raman shift Mode symmetry
Shebanova Gasparov Degiorgi Graves Verble Hart
668 A1g A1g A1g A1g A1g A1g 538 T2g(2) T2g Eg or T2g A1g T2g(2) T2g 450-490 T2g(3) Magnon T2g Magnon 306 Eg T2g T2g Eg T2g(3) Eg 193 T2g(1) T2g T2g
2.3 X-ray Diffraction
X-ray scattering techniques are a family of non-destructive analytical techniques which reveal information about the crystallographic structure, chemical composition, and physical properties of materials and thin films. These techniques are based on observing the scattered intensity of an x-ray beam hitting a sample as a function of incident and scattered angles, polarization, and wavelength or energy.
X-ray diffraction techniques are based on the elastic scattering of x-rays from structures that
have long range order. A crystal consists of a regular array of atoms, each of which can scatter electromagnetic waves. A monochromatic beam of X-ray that falls on a crystal will be scattered in all directions, in certain directions the scattered waves will constructively interfere with one another while others will destructively interfere. The analysis was developed in 1913 by W. L. Bragg. The condition which must be fulfilled for radiation scattered by crystal atoms to undergo constructive interference can be obtained from a diagram like that in Figure 2-5. In the plane wave description, a beam containing x-rays of wavelength λ impinges on a crystal at an angle θ with a family of Bragg planes, whose space is d. The beam goes past atom A in the first plane and atom B in the next, and each of them scatters part of the beam in random directions. Constructive interference occurs only between those scattered rays whose paths differ by exactly λ, 2λ, 3λ, and so on. That is, the path difference must be nλ, where n is an integer. The only rays scattered by A and B for which this is true are those labeled І and J in Figure 2-4.
Figure 2-5 Diffraction of x-ray. Incoming beam causes each scatter to re-radiate a small portion of its energy as a spherical wave. If scatters are arranged symmetrically with a separation d, these spherical waves will add constructively only in directions where their path-length difference 2d sin θ equals an integer multiple of the wavelength λ. In that case, part of the incoming beam is deflected by an angle 2θ, producing a reflection spot in the diffraction pattern.
The first condition on I and J is that their common scattering angle is equal to the angle of incidence θ of the original beam. The second condition is that
38
n
2 sin
d
θ
=
λ
,n =1, 2, 3….,
(2.3-1)where d is the spacing between diffracting planes, θ is the incident angle, n is any integer, and λ is the wavelength of the beam. Since the ray J must travel the distance 2dsinθ farther than ray I. The integer n is the order of the scattered beam. Then considering a tetragonal unit cell as shown in Figure 2-6 which is characterized by lattice parameters a and c. The inter-plane spacing d for the hexagonal structure is given as:
2 2 2 2
1
hklh
k
l
d
a
2 2c
+
=
+
(2.3-2)Combing Bragg’s law with Eq. 2.3-1 2 2 2 2 2 2 2 2
1
4
hklh
k
l
d
a
c
sin
θ
λ
+
=
+
=
(2.3-3) and rearranging Eq. 2.3-3 gives2 2 2 2 2 2 2
sin
{
}.
4
h
k
l
a
c
λ
θ
=
+
+
(2.3-4)The lattice parameters a and c can be determined by simultaneously fitting the diffraction angles of different reflections using Eq. 2.3-4.
For a cubic crystal with lattice constant a, the equation can be written as
2 2 2 2 2 2
sin
{
}.
4
h
k
l
a
λ
θ
=
+
+
(2.3‐5)Fig. 2-7 Simple cubic structure with lattice constants a = b = c.
40
References
[1] C.W. Nan, G. Liu, and Y. Lin, Phys. Rev. Lett. 94 197203 (2005).
[2] C.W. Nan, M. Li, X. Q. Feng, and S. Yu, Appl. Phys. Lett. 78, 2527 (2001); C.W. Nan, M. Li, and J. H. Huang, Phys. Rev. B 63, 144415 (2001).
[3] C.W. Nan, Phys. Rev. B 50, 6082 (1994); C.W. Nan, Y. H. Lin, and J. H. Huang, Ferroelectrics 280, 153 (2002).
[4] H. Zheng et al., Science 303, 661 (2004).
[5] T. Kimura et al., Nature 426, 55 (2003); T. Goto et al., Phys. Rev. Lett. 92, 257201 (2004). N. Hur et al., Nature 429, 392 (2004).
[6] D. S. Fu, H. Iwazaki, H. Suzuki and K. Ishikawa, J. Phys. Condens. Matter 12, 399 (2000). [7] O. N. Shebanova, and P. Lazor, J. Solid State Chem 174, 424 (2003).
[8] Dana ES, Ford WE “A Textbook of Mineralogy,” fourth edition New York: John Wiley & Sons p 28 (1932).
[9] I. Taguchi, a, A. Pignolet, L. Wang, M. Proctor, F. L&y, and P. E. Schmid, J. Appl. Phys. 73, 394 (1993).
[10] C.W. Nan, M. I. Bichurin, Shuxiang Dong, D. Viehland, and G. Srinivasan, J. Appl. Phys.
Chapter 3 Experimental Details
3.1 Thin Film Preparation
3.1.1
0-3 type PTO-CFO system
We used simple solution method to fabricate three different geometric forms of the PbTiO3-CoFe2O4 multiferroics, which are respectively CFO discs aligned in PTO matrix
(disk-3 type), the CFO and PTO multilayered structure (2-2 type), and the CFO particles embedded in PTO matrix (0-3 type) as shown in Figure 3-1.
(a) (b) (c)
The gel of PbTiO3 was produced by dissolving the lead acetate trihydrate and titanium
isopropoxide into the 2-methoxyethanol to stir and heat for 30 min. The 0.3M CoFe2O4 gel
was made from the cobalt nitrate hexahydrate and iron nitrate enneahydrate by the same process. Pure PTO gel was then spin-coated on Si and Pt/Si and CFO on Pt/Si substrate as the reference samples.
The 0-3 type is made of dispersing CFO particles in PTO matrix. First the CFO
Fig. 3-1 Schematic illustration of three thin films with different connectivity schemes: (a) the 0-3 type with CFO particles embedded in PTO matrix, (b) the 2-2 type with CFO and PTO nanolayers, and (c) the disk-3 type with CFO disc aligned in PTO matrix.
particles were obtained by drying solution then grinded, annealed, and grinded again to get granular morphology. The CFO particles about 100 nm were then put into the PbTiO3
solution with molar ratio 0.8:1 and shaken until they were well-mixed in the solution. Finally the resultant solution was spin-coated 5 layers on Pt/Si substrate and the 0-3 film was finished after annealing at 750 ℃ for 1.5 hrs.
3.1.2
Disk-3 type PTO-CFO system
The disk-3 type CFO-PTO samples were prepared by coating four PTO layers then another four CFO layers alternatively. Finally, the 4p/4c/4p/4p/4c/4p/Pt/Si film was annealed at 750℃ for 1.5 hours, where “n”p and “n”c stands for successively coated n layers of PTO and CFO, respectively. The top view images of the disk-3 type by using the optical microscopy (OM) system was found consisting of sub-10 μm CFO disc embedded in PTO matrix rather than nanometer sized CFO rods in PTO matrix [1] due to the higher annealing
F g. 3-2 Top view images of the OM pictures in disk-3 film. PTO and CFO possessing pervoskite and spinel structure individually precipitated in this self-assembled type [7]: the CFO formed disks while the PTO was the matrix. The thickness of the disks was 2 μm and the radius of disk was about 5 μm; hence we named this type as “disk-3” but not “1-3” type.
temperature. After coating CFO layers and heating it on hot plate, the CFO disc formed. The reason is that the cohesion of CFO gel is stronger than the adhesive force between CFO gel and PTO one. It reveals the similar morphology as illustration in Figure 3-1(c).
3.1.3
2-2 type PTO-CFO system
The process of making the 2-2 type with 2p/2c/2p/2c/2p/2c/2p/Pt/Si stacking layers is the same as the disk-3 type except that the every layer was individually annealed at 500 ℃ for 3 minutes and finally annealed at 700 ℃ for 1.5 hours.
3.2 Characterization
3.2.1
X-ray Diffraction System
The study of the samples in the multiferroic systems were accomplished using X-ray power diffraction (XRD) in Shimadzu ZD-5 diffractometer and monochromatic in high intensity Cu-Kα line of wavelength 1.5405 Å. Data were recorded between the angle range 200 < 2θ < 600 with steps of 0.040. The maximum voltage of the system is 30 KV, with the
maximum current 20 mA and rate of scanning is 40/min. The resulting XRD patternts were Gaussian fitted to get the diffraction peak positions and widths. By comparing with the JCPD data, the fitted peak positions and corresponding reflection planes were used to calculate the lattice constants.
3.2.2
Raman Detection System
and computer. An-ion laser (Coherent INNOVA 90) provides an excitation source of a wavelength 488 nm. The unwanted plasma lines were filtered out by a laser-line filter. A biconvex spherical lens with a focal length of 5 cm was used to focus the laser beam onto the sample surface at 45 degree reflection geometry. The laser power on the sample surface is about 30~35 mW with beam spot size of 30~50 μm (in diameter). The scattered light was collected by a camera lens and imaged onto the entrance slit of a spectrograph (Spex triplemate1877C) which is equipped with a liquid-nitrogen cooled charge coupled device (CCD) detector array (Phometrics CC200).
3.2.3
Magnetization Measurement System
The magnetic properties viz. saturation magnetization, coercivity and retentivity of samples have been determined from the magnetic moment versus magnetization curve recorded for various samples with the help of superconducting quantum interference device (SQUID) system.
SQUID is very sensitive magnetometer used to measure extremely small magnetic fields, based on superconducting loops containing Josephson junctions. They are sensitive enough to measure fields as low as 5×10-18 T within a few days of averaged measurements [2]. There are two main types of SQUID: DC and RF. The DC SQUID was invented in 1964 by Arnold Silver, Robert Jaklevic, John Lambe, and James Mercereau of Ford Research Labs
after B. D. Josephson postulated the Josephson effect in 1962 and the first Josephson Junction was made by John Rowell and Philip Anderson at Bell Labs in 1963. The RF SQUID was invented in 1965 by James Edward Zimmerman and Arnold Silver at Ford. The traditional superconducting materials for SQUIDs are pure niobium or a lead alloy with 10% gold or indium, as pure lead is unstable when its temperature is repeatedly changed. To maintain superconductivity, the entire device needs to operate within a few degrees of absolute zero, cooled with liquid helium. "High temperature" SQUID sensors are more recent; they are made of high temperature superconductors, particularly YBCO, and are cooled by liquid nitrogen which is cheaper and more easily handled than liquid helium. They are less sensitive than conventional "low temperature" SQUIDs but good enough for many applications.
Multiferroic samples were measured at room temperature with a maximum magnetic field (H) 20 kO. The magnetization was measured every 250 Oe before H reached 1 kOe and measured every 300 Oe after 1 kOe. All the samples were under both in-plane and out-of-plane conditions. The in-plane measurement means the magnetic field is parable to the surface of the samples while the out-of-plane means the magnetic field is vertical to the surface of the samples.
![Figure 1-5 is a typical magnetization curve for ferromagnetic materials [6]. Magnetization (emu/cc) is plotted as a function of magnetic field intensity (Oe)](https://thumb-ap.123doks.com/thumbv2/9libinfo/8384696.178373/15.892.148.781.126.241/figure-magnetization-ferromagnetic-materials-magnetization-function-magnetic-intensity.webp)
![Table 1-1 Magnetostriction Constrants λ 100 and λ 111 (×10 6 ) at 4.2K and Room Temperature for several materials [5] T = 4.2K Room Temperature λ 100 (λ γ, 2 ) λ 111 (λ ε, 2 ) λ 100 (λ γ, 2 ) λ 111 (λ ε, 2 ) Polycrystal λ s 3d Me](https://thumb-ap.123doks.com/thumbv2/9libinfo/8384696.178373/18.892.121.808.167.1061/table-magnetostriction-constrants-room-temperature-materials-temperature-polycrystal.webp)