附件一 封面格式樣本
國
立
交
通
大
學
科 技 管 理 研 究 所
碩
士
論
文
Cultural Differences in Green Purchase Behavior:
A Study of Taiwanese and Canadian Consumers
研 究 生:Kevin M. Beyer
指導教授:袁建中 教授
附件二 書名頁樣本
A Commitment-based Model Exploring Online Social Networks: Prospects and Problems
研 究 生:凱文 Student:Kevin M. Beyer
指導教授:袁建中 Advisor:Benjamin Yuan
國 立 交 通 大 學
科 技 管 理 研 究 所
碩 士 論 文
A ThesisSubmitted to Graduate Institute of Management of Technology College of Management
National Chiao Tung University in partial Fulfillment of the Requirements
for the Degree of
Master of Business Administration in
Management of Technology
December 2008
Hsinchu, Taiwan, Republic of China
Cultural Differences in Green Purchase Behavior: A Study of
Taiwanese and Canadian Consumers
Author: Kevin M. Beyer Advisor: Dr. Benjamin J.C. Yuan
Institute of Management of Technology National Chiao Tung University
Abstract
Consumers are showing the desire and willingness to purchase eco-friendly products in place of their traditional counterparts. This has resulted in an increase in business opportunities for the producers of green products and an increase in opportunity for policy makers hoping to capitalize on this trend towards ‘eco-friendliness’.
This study first explains what constitutes a green product and identifies different types of green consumers. It then examines the green purchase behavior in Taiwanese and Canadian cultural settings through the application of the Theory of Planned Behavior. To accomplish this, consumers in Hsinchu, Taiwan and Ottawa, Canada were
surveyed and the relevant data was analyzed and showed the overall usefulness of the model to explain eco-friendly purchases. The analysis also showed that attitudes exert the strongest influence on behavioral intention in Canadian and Taiwanese
consumers. The findings suggest the both Taiwanese and Canadian consumers perceive themselves as having a high degree of control over purchasing green products, suggesting the existence if internal locus of control in both samples.
Acknowledgement
This Master’s Thesis would not have been possible without the help of many people. Primarily, I would like to thank Dr. Benjamin Y.C. Yuan, my advisor on this project, for his direction, patience and understanding through out the entire process. I would also like to acknowledge the advice of Dr. Grace Lin during the formal proposal, which provided me with the tools and the structure for conducting a paper of this nature. In addition I would like to thank the all of the instructors in the Management of Technology Institute at National Chiao Tung University for their feedback and help.
Without constant interaction with the intelligent, professional and thoughtful students in MOT, I would not have been able to work through many of the obstacles faced while the researching and writing this paper. I would especially like to thank Chin-Wei Lin and Kun-Ming Kao, two of Dr. Yuan’s PhD candidates, for their help with the statistical analysis of this paper. Without their contribution I could not have finished. I would also like to single out the advice of Tim Mackay and Rachel Grimes who offered insight into the processes needed to complete a thesis at NCTU. I am deeply indebted to Tim’s wife, Janice Chen, for her excellent job in translating the survey from English to Mandarin.
On a personal level, I must thank my parents, Brian and Kathy Beyer, in Canada for always pushing and supporting me in my decisions. I’d also like to thank my little boy, Aidan, for being the inspiration for completing this project. Finally and most importantly, nothing I do is possible without the unwavering support of my wife, Gabriella. For taking care of our son, our home and me, I thank you from the bottom of my heart.
Table of Contents
Abstract... i
Acknowledgement ... ii
Table of Contents... iii
Table of Figures... iv Tables... iv 1. Introduction...1 1.1 Motivation_________________________________________________________________1 1.2 Contribution _______________________________________________________________2 2. Background ...3 2.1 Green Products _____________________________________________________________3 2.2 Identifying Green Consumers __________________________________________________8 3. Literature Review ...10
3.1 Applicability of the Theoretical Model __________________________________________10 3.2 The Theory of Planned Behavior (TPB) _________________________________________12 3.3 Formulation of Hypotheses___________________________________________________18 4. Methodology ...23
4.1 Sample and Procedure ______________________________________________________23 4.2 Measures _________________________________________________________________26 4.3 Data Analysis _____________________________________________________________29 5. Conclusions...40 5.1 Implications_______________________________________________________________40 5.2 Limitations _______________________________________________________________41 5.3 Future Research ___________________________________________________________41 5.4 Concluding Remarks________________________________________________________42 References...43 Journal References ... 43 Other Sources... 45 Appendices...47
Appendix 1: Green Products Identified in Blackburn (2008)... 47
Appendix 2: Online Survey (English)... 48
Table of Figures
Figure 1: EPA Environmentally Preferable Purchasing Guidelines...5
Figure 2: Life Cycle of a Product ...7
Figure 3: Graphical Representation of the Theory of Planned Behavior...12
Figure 4: Hofstede Cultural Dimensions for Canada and Taiwan...17
Figure 5: The Hypothesized Relationships of the Model ...19
Figure 6: Graphical Representation of the Hypotheses Analysis ...37
Tables Table 1: A Comparison of the Demographic Characteristics Between the Taiwanese and Canadian Populations and Samples ...25
Table 2: Descriptive Statistics of the Major Constructs ...30
Table 3: Reliability Statistic...31
Table 4: Combined Sample Model Summary...32
Table 5: Taiwanese Sample Model Summary ...33
Table 6: Canadian Sample Model Summary ...33
Table 7: Coefficients for the Combined Sample...34
Table 8: Coefficients for the Taiwanese Sample ...35
1. Introduction
1.1 Motivation
Nearly everyday we are exposed to audio, video and print media discussing a never ending list of environmental issues, solutions, warnings and debates. For nearly every fact or figure concerning the state of the global environment there is an opposing viewpoint and for every scientist on one side of the issue, there seems to be at least one on the other. Regardless of our own personal stance on the state of the
environment, it is impossible to say that this issue does not, in some way, affect our daily lives. Sustainable energy, organic food, green technology and green products are buzzwords in popular culture, consumer publications and business school course outlines today.
The economic opportunities presented by consumer concern for the environment have begun to influence organizational strategies. Firms are paying attention. Recent research suggests that firms increasingly recognize that environmental issues capture the attention and influence the purchasing decisions of consumers (Hart 1995; Menon & Menon, 1997; Osterhus, 1997). Similarly, a poll of over 500 U.S. senior business leaders found 8 in 10 agreeing that corporate responsibility was extremely or very important in achieving innovation in the design of new products, services, and processes Harris, 2007). Accordingly, many companies are attempting to develop products and processes that are both profitable and environmentally friendly (Arnst et al., 1997). Providing for the environmental concerns of customers is a win-win strategy for the planet and the firm.
Green consumers have been shown to be willing to pay a higher price for environmentally friendly products (Laroche, Bergeron & Barbaro-Forleo, 2001;
Peattie, 2001), which is a huge opportunity for companies as well as governments looking to make eco-friendly policy changes. In fact, the challenge of global
sustainability is described as potentially the biggest commercial opportunity in recent history (Arnst et al., 1997).
The knowledge of the existence of these green buyers is good news for the interested parties, but the task of learning ‘what makes them tick’ becomes greatly important. Even more important might be finding out how consumers can be transformed from people who consider buying green products into green purchasers. When considering all of the factors that make encouraging a desired behavior in consumers difficult, including limited financial resources, understanding what influences consumers’ decisions to purchase green products would be extremely valuable to policy makers, firms and marketers alike.
1.2 Contribution
This study aims to gain a better understanding of how various psychological factors might affect Canadian and Taiwanese consumers’ green purchasing. As will be elaborated on later, the main factors under investigation include consumers’ attitudes towards purchasing green, the effect of their significant others on their decisions, and the degree to which they feel that they have the ability to purchase green products. In addition, their intention to purchase green products will be measured against their actual purchases. Moreover, because there is a cultural aspect to the study, the possible influence of culture will be analyzed in this study.
As the literature has paid limited attention to the issues under investigation, in particular the application of the behavioral model to non-Western cultures and a cross-comparison of Canadian and Taiwanese consumers, it is hoped that the findings
from the present study would provide the foundation for more detailed investigation along the same line in the future. For practical application, it is also hoped that the present study can contribute to policy makers, marketers and businesses’
understanding of the environmentally friendly actions of consumers. Hopefully, such understanding can further advance the idea of green consumption in both Taiwan and Canada.
2. Background
2.1 Green Products
The products that fall under the umbrella of ‘green’ have increased in numbers, sales and variety in the past years. As consumers become more environmentally conscious, manufactures and marketers have kept pace with this trend by offering a wide range of products to suite their needs; such as organic foods, hybrid cars, energy efficient appliances and environmentally/socially screened investment funds. This
development reflects growing consumer concern about a wide range of economic, social, and environmental issues such as climate change, depletion of fossil fuels, rising energy costs, water supply issues, and the global spread of hazardous diseases. As the availability of products increase, the task of understanding which products are eco-friendly becomes a point of the utmost importance for both consumers and producers. As this market segment grows, governments and NGOs around the world need to react fast in order to keep their information flow moving with the
environment of pro-environment. These developments have spawned an explosion of certification programs and labeling geared at the growing number of environmentally and socially conscious consumers. In fact, the U.S. Federal Trade Commission (FTC)
is fast-tracking a review to update its Environmental Guides, also referred to as “Green Guides”, in response to calls for greater regulatory oversight of marketing practices in the face of this “green” boom (Blackburn, 2008).
The first step to buying, and conversely, selling a green product is for the parties involved to gain a greater understanding of what makes a product or service ‘green’? It begins with understanding the terminology used and the acceptable definitions of these products. The terms green, eco-friendly, sustainable, environmentally friendly, environmentally preferable, reduced carbon footprint, clean tech, green tech and others labels are used interchangeably when marketers are trying to attract consumers to their products. In this case, to avoid ambiguity and to avoid the unfavorable
situation of a company finding a loop-hole and claiming greenness while offering none, a standardized definition or this category of products is needed. According to the EPA’s “Environmentally Preferable Purchasing Guidelines” (EPA, 1999) developed for procurement by U.S. executive agencies, an ‘environmentally
preferable’ product or service must have a lesser or reduced effect on human health and the environment when compared with competing products or services that serve the same purpose. This comparison may consider raw materials acquisition,
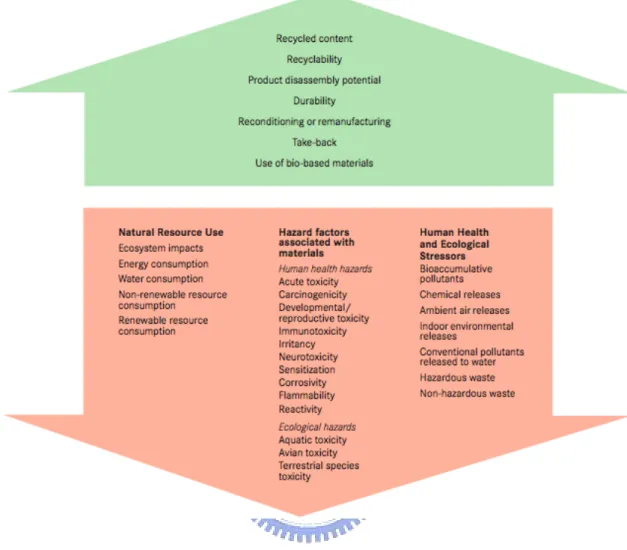
production, manufacturing, packaging, distribution, reuse, operation, maintenance or disposal of the product or service.” Figure 1, below, shows the United States
Environmental Protection Agency’s consumer guidelines for distinguishing between environmentally preferable products and products which do not meet the stated requirements.
Figure 1: EPA Environmentally Preferable Purchasing Guidelines.
Although this definition provides a framework that consumers and companies can use in their strategic decision-making, as well as a standard that developing countries’ can follow when implementing their own environmental policies, some advocates feel that this definition falls short in its attempt to fully capture the aspects of truly ‘green’ products. They contend that a green product must contain all aspects of the ‘triple bottom line”. That is, a product should not only meet environmental needs, but social and economic needs as well (Blackburn, 2008). The three aspects of the triple bottom line (TBL, 3BL) are ‘people, planet, and profit’ and they are meant as an approach public sector full cost accounting; the process of collecting and presenting
information (costs as well as advantages) for each proposed alternative when a decision is necessary. Triple bottom line is also a smart place for firms to aim their corporate social responsibility if they hope to capture the dollars of the ‘greenest’ consumers. In a discussion with ten North American based companies, Blackburn (2008) highlights the panel’s examples of these green products and services. A reproduction of their list can be found in the appendices (Appendix 1).
One of the many challenges facing firms in this area is the difficulty in providing consumers an account of the green processes that go into the making of their final product. The definition stated above does not simply incorporate the highly visible eco-friendly products which are the first to pop into consumers minds when thinking about buying green; bamboo bicycles, electric cars, solar heating, for example. It is broad enough to include products that achieve their greenness throughout the variety of stages of its life cycle. These products are not necessarily marketed as being eco-friendly by the manufacturers and likewise, consumers are unaware of their
greenness. Normally, consumers do not think about the environmental, social and economic impacts of the downstream and upstream process that go into making the products that they feel are green (Locke, 2002). Only when the circumstances reach unprecedented heights and media attention focuses on the life-cycle impacts of products do sensitive consumers take note and change their behavior (Macdougall, 2007). The exploitation of labor by The Gap, Wal-Mart and Nike are examples of consumers taking action against manufacturing practices that do not fit their expectations, although potentially resulting in favorable prices, availability etc. Mark Armitage of the Carbon Neutral company notes, “companies who are actively trying to make a difference balancing internal actions and external communications, often get more scrutiny than those who are doing nothing.” (Blackburn, 2008). The
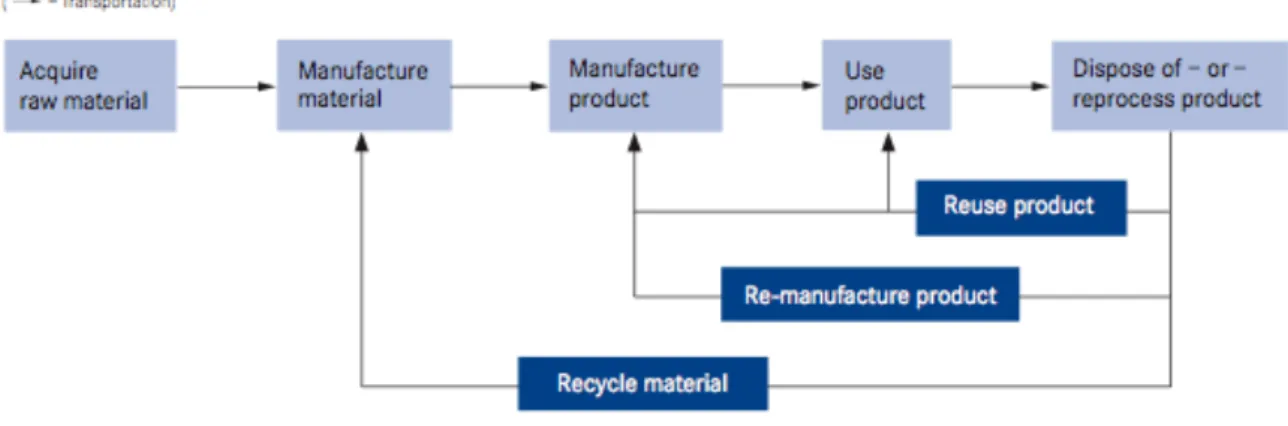
reason this exists may be due to the companies not being completely transparent where is comes to their short comings. ‘Green-washing’ or making claims about a product’s greenness that is either not true, or is not supported, and over-enthusiastic marketing are proving to be barriers for consumers willingness to buy green products. Companies are now using ‘eco-balances’ or life cycle assessments to identify the environmental impacts of their products’ life cycle. This assessment involves a broad study of the sum of impacts of a product, starting at the initial stage of raw material and energy inputs and outputs, moving along the production process to distribution and ultimately to the disposal of the used product (Blackburn, 2008). Figure 2 shows the life cycle of a product and the areas in which it can attain its green status.
Figure 2: Life Cycle of a Product
This approach is a scientific one, but it offers its own set of problems because it is subjective in nature. Its limitations are especially evident when attempting to determine which aspects of the product are most important. For example, compact florescent light bulbs offer increased energy efficiency, but contain mercury. It is difficult for consumers and producers to weigh these effects against each other, but although this approach is not perfect, it allows for a guideline to improving the eco-friendliness of a product or line of products.
2.2 Identifying Green Consumers
Green consumers mean big business, an estimated 500 billion dollars in 2008
(Karpelean, 2007). But according to a recent study released by Experian Local Market Services, only a small segment of green consumers, known as behavioral greens, are likely to spend the extra cash on environmentally friendly products and services. Before marketers and advertisers fully invest in the trend to be green, they need to know how to reach these new green consumers in national and local markets. Previous investigations that were seeking to profile potential eco-consumers have based their methodology on demographic data. However, the results of these research projects are often either inconclusive or inconsistent with each other. For example, in separate projects investigating the impact of education levels, Straughan and Roberts (1999), Vlosky et al. (1999), and Pedersen (2000) all concluded that individuals with ‘higher’ education are more likely to exhibit environmentally positive buying
behavior. However, later evidence from Peattie (2001), and Laroche et al. (2001) found that consumers of ecologically compatible products tended to be less educated. Straughan and Roberts (1999) also concluded that characteristics of age, gender and income, which may have been found to have some correlation to stated ‘green’ consumption in earlier research, on further analysis are unlikely to actually influence positive eco-behavior. Essentially, everyone has the potential to be a green purchaser. As green consumers go, four types have been identified by a recent study (Kaprealian, 2007). The first group is labeled “behavioral greens.” These are consumers who think and act green. They have negative attitudes towards products that pollute the
environment and incorporate green practices on a regular basis. They also tend to research as seek out products that fit their desired needs. The second type is called “think greens” and is made up of consumers who think like behavioral greens but
don’t necessarily act green. They often have a strong awareness of environmental issues and are equally aware of the options available for purchasing green products. In addition, they show positive attitudes and even positive intention to buy green, but stop short of acting on their intentions. Marketers view ‘think greens’ as an
opportunity waiting. “Potential greens” is the third type of green consumers. These are people who don’t behave or think along environmentally conscious lines but remain on the fence about key green issues. Their willingness to act in a green way is typically blocked by uncertainty about the benefits to purchasing green products or the legitimacy of the so called “environmental dooms-day” claims. “True browns” is the last category of green consumers and just as the name indicates, are not green at all. Not only are they not environmentally conscious, but may actually have negative attitudes towards media with a heavy environmental focus. The study suggests that marketers and policy makers ignore “true browns” and focus on converting “think green” and “potential greens” in order to reach their environmental goals.
3. Literature Review
3.1 Applicability of the Theoretical Model
There are numerous theories and models that have been in use since the 1970’s which attempt to examine and explain the reasons people act, or avoid acting, in an eco-friendly way. Faires, A., Cooke, M., Neame, C. (2006) give a list of seven categories of Consumer Behavior Theories that include no less than 27 distinct theoretical models that have been applied to the topic at hand. Clearly there are differing opinions surrounding which models are the most effective and it is suggested that certain models are adequate at understanding specific actions, while limited when applied to other distinct situations Faires, A., Cooke, M., Neame, C. (2006). In addition, there are certain measurement tools within a given model that may
encapsulate the behavior in demand, while others tools within the same model have varying degrees of effectiveness. For example, attitudes are generally viewed to be strong indicators of behavior and attitudinal measurements are found across many of the seven categories of Consumer Behavior Theories identified in Faires, A., Cooke, M., Neame, C. (2006). Ecological knowledge is another commonly applied
measurement tool however the literature has shown contradictory findings on the question of how it relates to ecologically friendly behavior (Arbuthnot and Lingg, 1975; Hines et al., 1987; Grob, 1995; Tanner and Kast, 2003). It is therefore extremely important to apply the right model to the situation and behavior being studied.
As stated, large number of factors influence eco-friendly purchases. These include situational factors such as the economic and regulatory environment, performance of the product, and universality of the product, among others (Lane and Potter, 2007).
However, in addition to such objective factors, there are equally important subjective psychological factors. What makes the psychological factors of particular interest is that, not only do they influence behavior directly, but also they mediate the more objective situational issues. For example, it is often how consumers perceive the economic environment that influences their purchasing behavior rather than the actual costs. Therefore, to more fully understand the importance of the factors influencing consumer behavior, it is enlightening to place these factors in established social-psychological models.
One such model is the Theory of Reasoned Action (TRA) (Fishbein & Ajzen, 1975), which suggests that people consider the consequences of alternative behaviors before engaging in them, and that they choose to perform behaviors they associate with desirable outcomes. Briefly, the model states, behaviors are determined by a person’s intention to perform the behavior. It is suggested that behavioral intent (BI) is derived from two factors: (1) attitude toward the behavior, and (2) subjective norms (or perceived social pressure associated with the behavior). Although previously accepted as a viable model, current literature points out TRA’s inability to capture an
consumers perceived self efficacy – which has been found to be a significant determinant of eco-friendly behavior (Berger and Corbin, 1992; Ellen, Weiner and Cobb-Walgren, 1991). Perceived self-efficacy is defined as people's beliefs about their capabilities to produce designated levels of performance that exercise influence over events that affect their lives. Self-efficacy beliefs determine how people feel, think, motivate themselves and behave. Such beliefs produce these diverse effects through four major processes. They include cognitive, motivational, affective and selection processes (Ajzen, 2006). In light of the limitations of TRA another model must be considered for the current study.
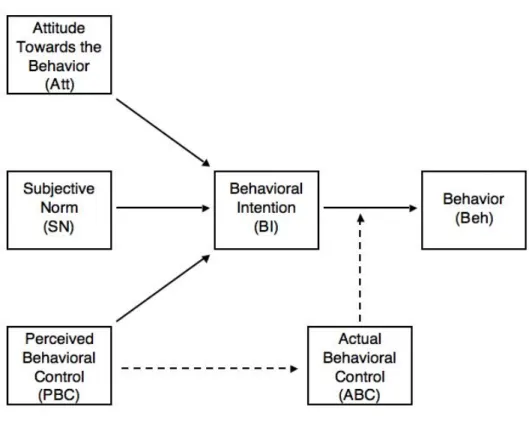
3.2 The Theory of Planned Behavior (TPB)
The most significant model for the current study is Ajzen’s (1991) Theory of Planned Behavior (TPB), which attempts to explain the causal link between values, beliefs, attitudes, intentions and behavior. In simple terms, the theory proposes that when given a behavioral choice, an individual will consider the alternatives and assesses their consequences based on their beliefs relating to the actions and their effects. These beliefs determine an individual’s attitudes regarding the possible actions, which in turn influence the intention to act with behavioral intention being a strong indicator of the actual behavior chosen (Dietz, Dan, Shwom, 2005). Figure 3 below shows the graphical interactions of the belief based attributes and their relationship to intention and finally, behavior. A detailed discussion of each aspect of the model follows.
Attitude Towards the Behavior (Att)
Attitude toward a behavior is the degree to which performance of the behavior is positively or negatively valued. According to the expectancy value model, attitude toward a behavior is determined by the total set of accessible behavioral beliefs linking the behavior to various outcomes and other attributes (Ajzen, 2006). Attitudes have been shown to be driven by behavioral beliefs, which in turn are an individual’s beliefs that the performance of a behavior will result in an expected outcome. The formulation of attitudes is the result of many beliefs but only a certain amount are accessible at any given time. The accessible beliefs are combined with the perceived outcomes of performing the behavior of interest and from there, an attitude towards the behavior is formed (Ajzen, 2006; Fishbein & Ajzen, 1975).
Subjective Norm (SN)
Subjective norm is the perceived social pressure to engage or not to engage in a
behavior. Drawing an analogy to the expectancy-value model of attitude, it is assumed that subjective norm is determined by the total set of accessible normative beliefs concerning the expectations of important referents (Ajzen, 2006). These normative beliefs are the beliefs of the important people in an individual’s life. These people could include family members, friends, spouses, neighbors, co-workers, classmates, teachers, doctors and advisers. The important referents will very depending on the behavior in question and the sample under study. When studying smoking behavior, the normative beliefs of doctors may be a consideration for adults over the age of 45,
while friends and classmates may be important to teenagers. Individual’s subjective norms are a result of their motivation to comply with their referents attitudes towards the behavior.
Perceived Behavioral Control (PBC)
Perceived behavioral control refers to people's perceptions of their ability to perform a given behavior. Drawing an analogy to the expectancy-value model of attitude, it is assumed that perceived behavioral control is determined by the total set of accessible control beliefs, i.e., beliefs about the presence of factors that may facilitate or impede performance of the behavior. These factors may be included a persons perceived ability to physically, mentally or financially perform the behavior. These control beliefs are linked to the person’s perceived locus of control (Chan & Lau, 2001), which refers to a person's belief about what causes the good or bad results in his or her life, either in general or in a specific area. It can either be internal, meaning the person believes that they control themselves and their life, or external, meaning they believe that their environment, some higher power, or other people control their decisions and their life (Rotter, 1990). Unlike TRA, TPB incorporates the idea of self-efficacy through this perceived behavioral control construct (Ajzen, 1991; Bundura, 1982).
Actual Behavioral Control (ABC)
Actual behavioral control refers to the extent to which a person has the skills,
resources, and other prerequisites needed to perform a given behavior (Ajzen, 2006). As stated above, this could be the knowledge needed, the money needed, the time needed, the physical or mental ability needed or other factors that are actually needed
to perform the behavior. Successful performance of the behavior depends not only on a favorable intention but also on a sufficient level of behavioral control. This means that although intention is widely viewed as a direct indicator of behavior, the person must be able to perform the behavior they intend to perform. If perceived behavioral control is accurate, it should indicate the actual control a person has over the
behavior. Likewise, it can be used with intention to predict the behavior. If however, the perceived behavioral control is not correct, then the actual behavioral controls will trump intention and the individual will be unlikely to perform the behavior under study.
Behavioral Intention (BI)
Intention is an indication of a person's readiness to perform a given behavior, and it is considered to be the immediate antecedent of behavior (Fishbein & Ajzen, 1975). The intention is based on attitude toward the behavior, subjective norm, and perceived behavioral control, with relation to the behavior and population of interest (Ajzen, 2006). Where a person has positive attitudes towards a behavior and its expected outcomes, who also has the important people in their life mirroring those attitudes and who feels that they have a reasonable amount of control over the performance of the behavior, their intention to perform the behavior should be strong. If the opposite is true, then intention should be low.
Behavior (Beh)
Behavior is the manifest, observable response in a given situation with respect to a given target (Ajzen & Fishbein, 2005). In the Theory of Planned Behavior intention,
combined with actual behavioral control, is a predictable variable for behavior. Simplified, if an individual intends to perform the behavior and has the ability to perform it, that should be a reliable prediction of them actually performing the behavior. If they intend to perform the behavior but do not have the means to do so, they will not.
Cultural Dimension
Over the past decade, the amount of literature that explores the complex relationship between culture and consumer behavior has grown dramatically. One of the lessons learned from studying social psychology is that cultural variations have significant impact on the way people view the world and that these views ultimately affect behavior (Manstead 1997). Seemingly, there is agreement in the marketing literature that culture greatly influences the way consumers perceive and behave (Hall 1977; McCracken 1988; Clark 1990). Gabreyna and Hwang (1996) argue that the system of relational norms, specifically family-based or family-like relationships, supporting social interaction in Chinese society manifests a form of rationality very different to that of the Western societies which the discrete individualistic, formal rationality and exchanges commonly invoked in economic analysis. Research has confirmed that Asians and Westerners differ in locus of control (Kleinman & Lin 1981; Sastry & Ross, 1998) and the differences have been associated with differences in the value orientations of these cultures. It has been argued that the individualist orientation of Western culture entails a focus on the pursuit of personal goals and, consequently, attention is devoted to the development of the individual (e.g., Hui and Triandis, 1986). On the other hand, Asian culture focuses on collectivist ideals, such as loyalty to the family and to the community and, consequently, it encourages subordination of
individual goals to the goals of the greater group (e.g. Traindis, 1989). Notably, Yang (1988) finds that Asians are more situation-centered and are more externally oriented, compared with their Western counterparts.
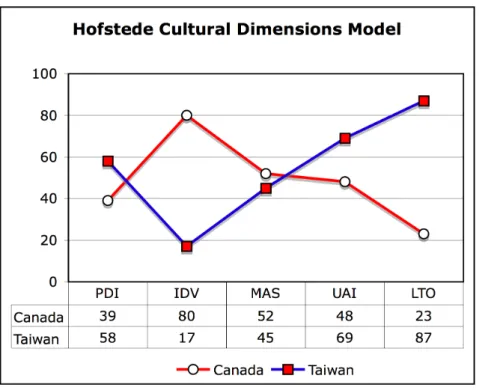
With the use of Hofstede’s Cultural Dimensions Model (HCDM), figure 4 below, it is clear that there are several areas where Taiwanese and Canadians differ. The
relationship between these differences and their interaction within the Theory of Planned behavior will be addressed later in the paper in the ‘Formulation of Hypotheses’ section.
Figure 4: Hofstede Cultural Dimensions for Canada and Taiwan
It must be noted that in their empirical study on the applicability of TPB, Chan and Lau’s (2001) results indicated that TPB was competent in indicating the green purchase behavior of both Chinese and American consumers. Although primarily used to measure behavior in Western and particularly, American settings, the results
in Chan and Lau (2001) indicated the universality of the model and also add credibility to its ability to cross cultural dimensions.
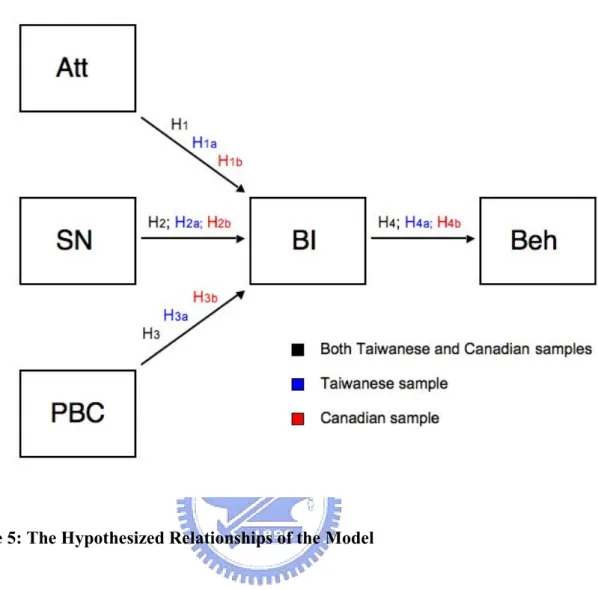
3.3 Formulation of Hypotheses
This study will test the hypothesized relations set out by the TPB as discussed in the previous literature for both the Taiwanese and Canadian consumers, the Taiwanese consumers alone and the Canadian consumers alone. Those relationships being; Att, SN and PBC will exert an influence on BI, which itself will be tested as an indicator of Beh (indicated by the arrows in Figure 3). There will be four separate hypotheses for the Canadian/Taiwanese samples combined, four for the Canadian samples and four applying to the Taiwanese samples.
Figure 5: The Hypothesized Relationships of the Model
In addition, three other hypotheses were developed to measure the influence of culture on BI of Canadian and Taiwanese consumers. The two additional hypothesis focuses on the cultural orientation of collectivism v. individualism. As a country influenced by both Chinese, Japanese and other Confucian cultures, Taiwan can be viewed to be very collective in nature (Li, 1997; Yua, 1994). Collectivism refers to a society which values close ties between individuals. These cultures reinforce extended families and collectives where everyone takes responsibility for fellow members of their group (Hofstede, 1980). Lee (1990) says that people from Confucian nations, such as Taiwan, have a strong propensity to conform to the norms of their reference groups and are highly concerned whether their actions will make them “lose face”. As shown
in Figure 4 above, Taiwan ranks very low in Individualism on Hofstede’s cultural dimension model, scoring a 17 out of 100. In comparison, China, known for it’s uniquely collective nature, scores three points higher with a 20. Due to this highly collective nature, Taiwanese should exhibit a strong tendency to subordinate their individual interests in pursuit of group interests (Hofstede, 1983; Trandis, 1989; Trandis et al., 1988). In turn, the less individualistic an individual is, the more likely that that person will be to value the views of those people within their social circles; family, friends, coworkers; the major referents described above. In relation to ecological preservation, McCarty and Shrum (1994) show that collective individuals tend to be more co-operative than individualists. The implication here is, if an action is deemed to be beneficial by the group, then that action will be viewed as being worthy. Therefore, the first additional hypothesis is worded;
H5: Given Taiwanese collective nature, subjective norm rather than attitude will
exert a stronger influence on behavioral intention to purchase green products.
Canadians on the other hand score extremely high on Hofstede’s scale for
individualism. As their highest of the five dimensions of culture, Canadians have a score of 80, which is common for Western cultures (compared to U.S.A.’s 91). In comparison to the Taiwanese scores, Canadians can be viewed to be highly individualistic in nature. In similar cultures, individuals are expected to stand out from the group and to be more concerned with the fulfillment of individual rather than group goals (McCarty and Shrum, 1994; Triandis, 1989). According to Marjus and Kitayama (1998) this individualism is linked to confidence, reliance and self-interest. That being so, it naturally follows that an individualistic person will value
their own beliefs over those of others, regardless of the relationship. As stated above, beliefs are central to a person’s attitudes towards a behavior and where a person values the beliefs, which they have formed themselves, their attitudes should have a strong influence on their intention. Following this logic, the second additional hypothesis is stated;
H6: Given Canadian’s individualistic nature, attitude rather than subjective norm
will exert a stronger influence on behavioral intention to purchase green products.
The development of the third hypothesis relates to the central premise of the TPB, that being, perceived behavioral control and comes from the work done by Chan and Lau (2001). If an individual views himself as having a high degree of volitional control over the performance of the behavior in question (Ajzen, 1991), then the explanatory power of PBC will become marginal (Chan and Lau, 2001). Explained another way, if the performance of a particular act is regarded as highly controllable, the power of attitude and subjective norm to explain that act will be much stronger than that of perceived behavioral control.
In their previous study comparing Chinese and American consumers, Chan and Lau (2001) hypothesized and showed to a satisfactory degree, that the highly
individualistic American consumers would feel that they had more volitional control over purchasing green products than their Chinese counterparts. The rationale behind this idea is based on the locus of control literature, introduced earlier. In this sense, Li and Karakowsky (2001) argue that the collectivist nature of Asian culture reduces the sense of personal control. While according to Hsieh, Shybut and Lotsof (1969),
Westerners were more likely to attribute an individual’s success or failure on his own skill and effort. It is assumed based on these findings, that the Taiwanese would have a lower perception of volitional control and therefore, PBC would have a greater part to play in explaining green purchase behavior. In regards to this rationale the third additional hypothesis is stated as:
H7: Given Taiwanese external locus of control, perceived behavioral control will
be shown to have a greater influence on intention to purchase green products in comparison to Canadian consumers.
Section four of this paper will describe the method used to for data collection, statistical measurement and data analysis.
4. Methodology
4.1 Sample and Procedure
This study was designed to collect the views of adult (20 or older) consumers in Taiwan and Canada. Measurements were made using the TPB to capture the green purchase behavior of the respondents. Due to the cross-cultural nature of populations under study, modifications were necessary to conduct the study.
Since people within a single culture often have differing opinions as to what constitutes a green product, a concise definition was needed in order to provide consistency for the respondents as a frame of reference. This definition was based on the green products definition used in Chang & Lau (2001) and is based on Peattie’s (1995) classification of green products as well as the EPA definition mentioned earlier. This study specifically defines green products as “products that either through
their manufacturing or usage have a reduced negative impact on the environment when compared to their traditional counterparts.” This definition was set out in the
reference section of the questionnaire and was meant to provide a frame of reference for respondents. The terms “green products”, “environmentally friendly products” and “eco-friendly products” were used interchangeably in the questionnaire and
respondents were reminded of this fact.
The data for the present study was collected via a two-part online survey from respondents in Hsinchu (Taiwan) and Ottawa (Canada). The survey instrument was first developed in English and then translated into Traditional Mandarin Chinese to aid the Taiwanese respondents understanding of the instructions and terminology. Applying the back translation technique ensured the equivalence of the English and Chinese versions. Potential respondents from Hsinchu were solicited at various
English school in the Hsinchu Science and Industry Park. They were approached and asked if they would be interested in participating in the study at hand. Two hundred willing participants were given a paper copy of the Chinese survey’s web address and asked to fill in the form. Respondents from Ottawa were solicited through the author’s contacts in that city and 200 willing participants were emailed the link to the English version of the online survey. Participants in both Hsinchu and Ottawa were informed that the survey was part of a Master’s thesis and that all of the information provided would be used strictly for the purposes of this project and would be deleted upon completion. Due to some of the sensitive demographic information, namely personal income, respondents were not asked to provide their name. Instead they were asked to provide an email address where they could be reached for a follow-up questionnaire. It was also made clear to the respondents that if any of the required information was something that they were unwilling to share, they simply had to exit the online survey.
Consequently, 113 and 138 useful responses from the first survey were gathered from Canada and Taiwan respectively. Twenty days after receiving the responses to the first survey, the follow-up with the behavior measurement tool was emailed to the exact email addresses derived from the first part of the survey. In total, 154
respondents completed the second part of the survey and their data was matched with their data from the first survey. Of the 154 responses, 82 were from Canadians and 72 were from Taiwanese.
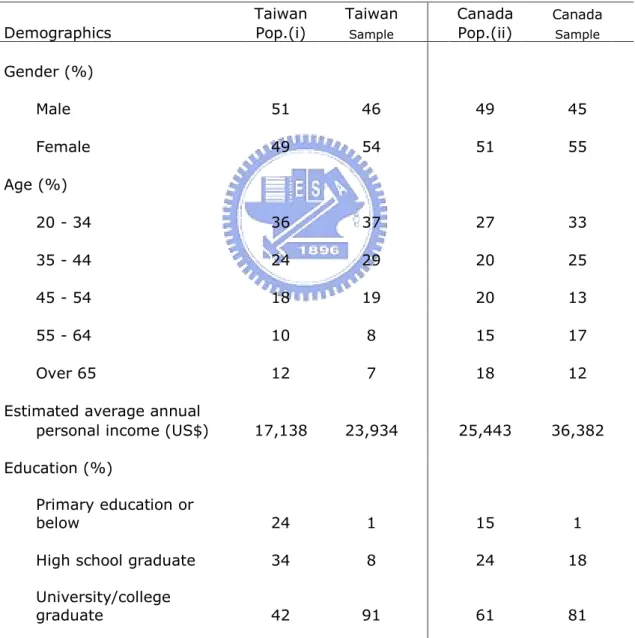
Overall, 55% of the Canadian respondents were female and the median age was between 35 and 44 years old. Their education backgrounds were relatively constant with 81% university achieving the level of a college graduates and their estimated annual income range was between $36,382USD. As for the responses from Taiwan,
54% were female and the median age also fell in the 35 - 44 age group. The average estimated annual income was $23,934USD and 91% of the highest achieved
education level was that of a college or university graduate. The total demographic information of both the Taiwanese and Canadian populations and samples can be found in table 1 below.
Table 1: A Comparison of the Demographic Characteristics Between the Taiwanese and Canadian Populations and Samples
Taiwan Taiwan Canada Canada
Demographics Pop.(i) Sample Pop.(ii) Sample
Gender (%) Male 51 46 49 45 Female 49 54 51 55 Age (%) 20 - 34 36 37 27 33 35 - 44 24 29 20 25 45 - 54 18 19 20 13 55 - 64 10 8 15 17 Over 65 12 7 18 12
Estimated average annual
personal income (US$) 17,138 23,934 25,443 36,382 Education (%) Primary education or below 24 1 15 1
High school graduate 34 8 24 18
University/college
graduate 42 91 61 81
(i) Source: National Statistics Bureau, Republic of China (Taiwan); http://eng.stat.gov.tw (ii) Source: Statistics Canada; http://statcan.gc.ca
4.2 Measures
In order to conduct the research at hand, the survey and model conducted following the procedures set out in the literature surrounding TPB (Ajzen and Fishbein, 1980; Ajzen, 1991; Chang, 2000; Chang, 2001, Shrimp and Kavas, 1984). The following are the global attributes measured in the current study.
Global Measure of Attitudes Towards Green Purchases (Att)
Following the guidelines set out by Isac Ajzen (Ajzen, 1991), Professor of
Psychology at the University of Massachusetts, respondents were asked a series of three questions which were designed to indicate their attitudes towards purchasing green products in the coming 20 days. Participants were given three statements coded by a 7-point semantic differential scale (1 to 7) and the questions were anchored by:
unenjoyable/enjoyable (Att1), bad/good (Att2), and harmful/beneficial (Att3),
respectively.
Global Measure of Subjective Norm Towards Green Purchases (SN)
Again, participants were given three statements coded by a 7-point semantic differential scale (1 to 7): Most people who are important to me think I should
not/should purchase green products for personal use in the next 20 days (SN1). Most
people who are important to me purchase green products for personal use. This statement is false/true, (SN2). The people in my life whose opinions I value would
disapprove/approve of me purchasing green products for personal use in the next 20
days (SN3). (Ajzen and Fishbein, 1980; Chan and Lau, 2001; Shrimp and Kavas, 1984).
Global Measure of Perceived Behavioral Control Towards Green Purchases (PBC)
With reference to Chan and Lau (2001) and Ajzen (1991; 2005), PBC was measured by these three items: (PBC1) For me to purchase green products for personal use in the next 20 days would be impossible/possible. (PBC2) I have complete control over my ability to purchase eco-friendly products for personal use in the next 20 days,
True/False. (PBC3) It is mostly up to me whether or not I purchase eco-friendly
products for personal use in the next 20 days, agree/disagree. All three items were measured on a 7-point semantic differential scale with the indicated poles.
Behavioral Intention Towards Green Purchases (BI)
Based on Ajzen (1991) Chan (2001), and Chan and Lau’s (2001) procedure, respondents intention to purchase green products in the coming 20 days were measured by the following three statements measured 7-point semantic differential scale with the indicated anchors; Over the next 20 days I intend to purchase eco-friendly products for personal use, unlikely/likely (BI1); Over the next 20 days and for the purposes of personal use, I will try to purchase eco-friendly brands, false/true (BI2); Over the next 20 days and for the purposes of personal use, I plan to purchase a green version of a product, disagree/agree (BI3).
Note Regarding the 7-point Semantic Scale
While running a pre-test of the measurement tool, participants expressed some confusion and ambiguity when it came to responding within the anchor scores; wanting to express an answer between 1 = false and 7 = true and not understanding the values within. After consulting Ajzen (1991), the author decided to prescribe values to each of the questions and statements in the measurement tool. For example,
Att1 is anchored by bad/good, but has the additional explanatory adjectives; 1 = extremely bad; 2 = quite bad; 3 = slightly bad; 4 = neither good nor bad; 5 = slightly good; 6 = quite good; 7 = extremely good. The use of these additional descriptive adjectives was universally used on all of the scales in the survey and the
corresponding Chinese adjectives were applied to the Chinese version of the survey.
Green Purchase Behavior (GPB)
To examine the participants’ actual green purchase behavior respondents were contacted via the email address provided with their survey results and sent a link to three follow-up questions. Three measures were used to determine if the intended behavior was completed (Chan and Lau, 2001; Homer and Kahle, 1988; Taylor and Todd, 1995): (Beh1) a 7-point semantic differential scale anchored by never/at every
opportunity; indicate the frequency of shopping for green products in the twenty days.
(Beh2) a 7-point scale anchored by none/much money; indicate the amount of money spent on green products in the past twenty days. Finally, (GPB3) respondents were asked to indicate the total number of green products purchased in the past 20 days as a means of verification. To add an additional measure of verification and to encourage truthful answers, respondents who indicated they purchased green products were asked to provide information about the location, price and type of product bought. It must be noted that the products indicated were not scrutinized for their greenness. As this model is intended to measure behavior based on beliefs, it stands to reason that if a person believes they have completed the behavior, then that satisfies the behavioral requirement. Likewise, people who may have purchased a green product
inadvertently, without making the cognitive decision to do so, should not be considered as having performed the behavior.
4.3 Data Analysis
The raw data collected from the online questionnaire was analyzed with the
application of three types of statistical measurements. First, the relevant descriptive statistics of the two cultures were looked at and compared with the data from both samples combined. The means and standard deviations for attitudes, subjective norms, perceived behavioral control, behavioral intent and behavior appear in table 2, below, and contain data from all three samples. Next, each variable in the model was tested using Cronbach’s Alpha,a coefficient of consistency and measures how well a set of variables or items measures a single, uni-dimensional latent construct (Alen & Yen, 2002). Finally, linear regression was used to measure the relationships between the variables in the model. Linear regression is used to determine if there is a relationship between two or more variables and if so, the strength of that relationship. The
descriptive statistics, reliability statistic (Cronbach’s Alpha) and regression are discussed separately, but each contains data from all three samples.
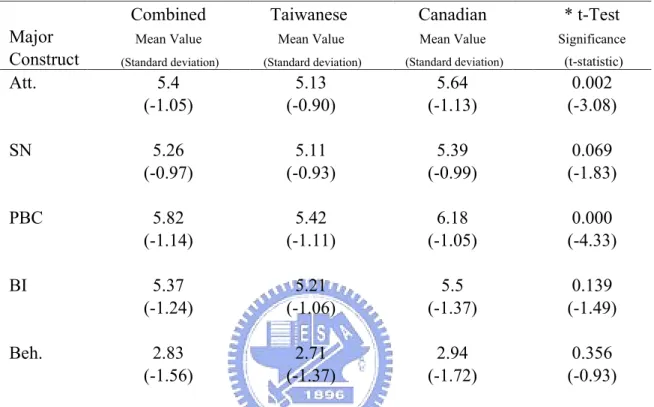
Descriptive Statistics
Descriptive statistics were used to provide an overview of the major constructs under investigation. As noted in Table 2, the Canadian sample had a higher mean score on attitude (Att) and perceived behavioral control (PBC) in comparison to the Taiwanese sample. These descriptive statistics provide initial support for H5 and H7. On the other
hand, the mean subjective norm scores for the Taiwanese sample are below those of the Canadian sample. This contradicts the expected results of H6, based on the
previous literature. A two-tailed t-test for equality of means with equal variances not assumed was performed and showed statistically significant results for Att., SN, and
PBC at p < 0.10 between the Taiwanese and Canadian samples. However, upon testing BI and Beh., significance between the two samples could not be shown.
Table 2: Descriptive Statistics of the Major Constructs
Combined Taiwanese Canadian * t-Test Major Mean Value Mean Value Mean Value Significance
Construct (Standard deviation) (Standard deviation) (Standard deviation) (t-statistic)
Att. 5.4 5.13 5.64 0.002 (-1.05) (-0.90) (-1.13) (-3.08) SN 5.26 5.11 5.39 0.069 (-0.97) (-0.93) (-0.99) (-1.83) PBC 5.82 5.42 6.18 0.000 (-1.14) (-1.11) (-1.05) (-4.33) BI 5.37 5.21 5.5 0.139 (-1.24) (-1.06) (-1.37) (-1.49) Beh. 2.83 2.71 2.94 0.356 (-1.56) (-1.37) (-1.72) (-0.93)
Notes: the mean values are based on a 7-point scale between 1 and 7.
* A two-tailed t-test for equality of means with equal variances not assumed between the Taiwanese and Canadian samples.
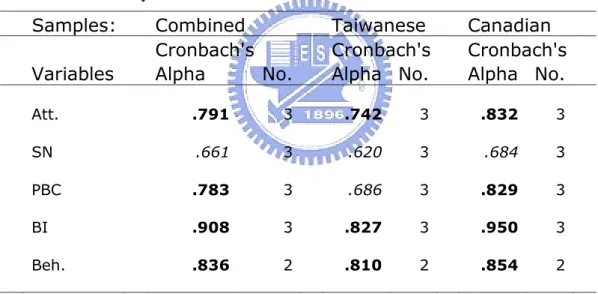
Reliability
In this next section the data from all three samples was tested to measure the overall reliability of each variable. Technically speaking, Cronbach's alpha is not a statistical test - it is a coefficient of reliability (SPSS FAQ). Essentially, if you increase the number of items being measured, you increase the alpha; the reliability. Also, if there is high correlation between the inter-items there is evidence that the items being measured have the same underlying construct. This reliability is codified with the terms; “high’, “good” and “low” reliability. They are referring to how well their
items measure a single uni-dimensional latent construct. This measure is useful for understanding the data from this model.
As is indicated by the bold font in Table 3, Att., BI and Beh. from all three samples were shown to have a “high” level of inter-item reliability with a Cronbach’s alpha of greater than .70. The items in italics, however fall below that level and should be viewed as having a “good” or “medium” level of reliability (Cronbach, 1951; Lord & Novick, 1968; Allen & Yen, 2002), designated with levels between greater than .35 but less than .70. There could be differing reasons why these items do not reach the recommended levels.
Table 3: Reliability Statistic
Samples: Combined Taiwanese Canadian
Cronbach's Cronbach's Cronbach's
Variables Alpha No. Alpha No. Alpha No.
Att. .791 3 .742 3 .832 3 SN .661 3 .620 3 .684 3 PBC .783 3 .686 3 .829 3 BI .908 3 .827 3 .950 3 Beh. .836 2 .810 2 .854 2
The first reason may be due to low sample size and this would apply to the Taiwanese sample’s PBC scores. As stated above, as the number of responses increases, so does the Cronbach alpha. The mark of .686 is just below the level of high reliability and when the Taiwanese scored were combined with the Canadian scores, the level of high reliability is achieved. Were the responses for the Taiwanese survey higher, it is possible that the level of reliability may also have increased.
It is also possible that sample size has an impact on SN, however because of the lower scores from the combined sample, it is unlikely that this is the main cause of the reliability issue. Also, the consistency of low scores across each of the samples indicated that there may be another cause in play. It is likely that these low scores are due to a low level of consistency between the items in the SN construct. One might assume that a translation problem may have existed between the English and
Mandarin surveys, but due to the consistency of scores between the two samples, that is unlikely. Regardless of the reasons, the Cronbach alpha still indicates the reliability of the SN variable, but at a diminished level.
Global Fit of the Model
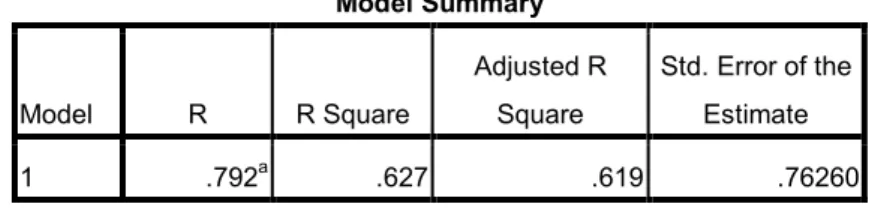
Tables 4 through 6 show the overall global fit of the model and represent the data of the combined sample, Taiwanese sample and Canadian sample respectively. The existence of lower scores on the R Square test suggests that the model needed more data and that the sample size was too low. The combined sample (Table 4) had an R Square value of .627 between Att., SN, PBC and BI. The relationship between BI and Beh., had a greater degree of residual variability with an R Square value of .244. Table 4: Combined Sample Model Summary
Model Summary Model R R Square Adjusted R Square Std. Error of the Estimate 1 .792a .627 .619 .76260 a. Predictors: (Constant), Att, SN, PBC
1 .494a .244 .239 1.36465 a. Predictors: (Constant), BI
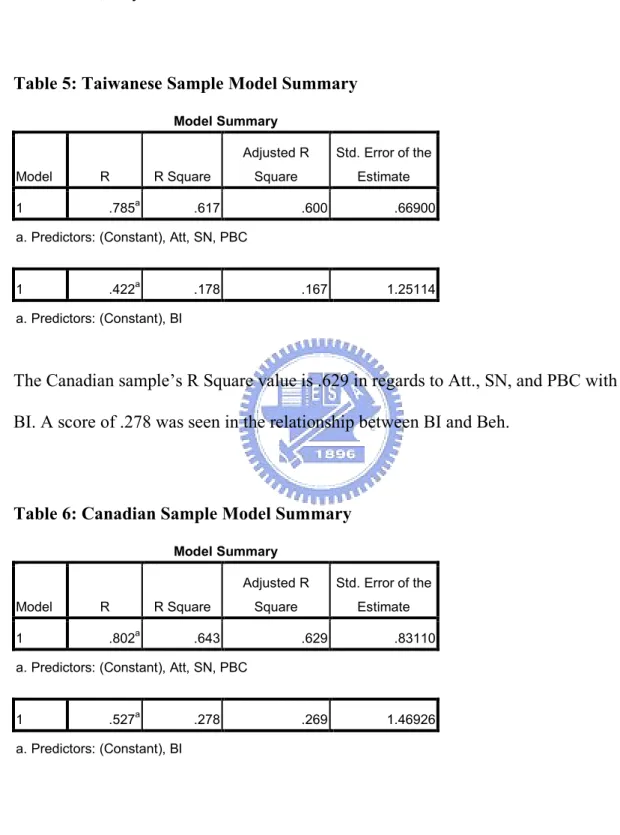
Table 5 shows the R Square value for the Taiwanese sample. The relationship between Att., SN, and PBC with BI has a value of .617 and the relationship between BI and Beh., only scores .178.
Table 5: Taiwanese Sample Model Summary
Model Summary Model R R Square Adjusted R Square Std. Error of the Estimate 1 .785a .617 .600 .66900
a. Predictors: (Constant), Att, SN, PBC
1 .422a .178 .167 1.25114 a. Predictors: (Constant), BI
The Canadian sample’s R Square value is .629 in regards to Att., SN, and PBC with BI. A score of .278 was seen in the relationship between BI and Beh.
Table 6: Canadian Sample Model Summary
Model Summary Model R R Square Adjusted R Square Std. Error of the Estimate 1 .802a .643 .629 .83110 a. Predictors: (Constant), Att, SN, PBC
1 .527a .278 .269 1.46926 a. Predictors: (Constant), BI
TPB Hypothesized Relationships
Table 7: Coefficients for the Combined Sample
Coefficients
Unstandardized Coefficients
Standardized Coefficients
Model B Std. Error Beta t Sig. (Constant) -.192 .384 -.499 .618 Att. .726 .083 .620 8.740 .000 SN .154 .083 .121 1.862 .065 1 PBC .142 .071 .131 1.987 .049 a. Dependent Variable: BI (Constant) -.529 .492 -1.076 .283 1 BI .626 .089 .494 7.011 .000 a. Dependent Variable: Beh.
Table four shows the results from H1, H2, H3, and H4, all relating to the combined
Taiwanese and Canadian samples. Overall, except for the SN->BI, the relationships under investigation were significant at a p < 0.05. Even the SN->BI relationship (H2),
was significant at a p value of < 0.10, which adds some credibility to the notion that sample size may be impacting the results. Attitudes (Att.) had the strongest
significance in relation to behavioral intent (BI) with a p value of 0.000 (H1) and BI
was shown to be equally significant in predicting behavior (Beh.) (H4). Finally,
perceived behavioral control (PBC) was significant to p < 0.05 in its ability to predict BI (H3).
Table 8: Coefficients for the Taiwanese Sample
Coefficients
Unstandardized Coefficients
Standardized Coefficients
Model B Std. Error Beta t Sig. (Constant) .107 .516 .207 .837 Att .630 .129 .537 4.898 .000 SN .161 .104 .142 1.539 .128 1 PBC .193 .107 .204 1.816 .074 a. Dependent Variable: BI (Constant) -.146 .747 -.195 .846 1 BI .548 .140 .422 3.899 .000 a. Dependent Variable: Beh.
The Taiwanese sample and its corresponding hypotheses analysis are summarized in Table 5. Again the model shows its ability to measure the BI->Beh relationship (H4a),
with a significance of 0.000. The model’s capacity to measure the Att.->BI (H1a) is
equally as strong, however the strength of this relationship will be addressed further when discussing the cultural hypotheses (H5, H6, H7). There is a statistically
significant relationship between PBC->BI (H3a), however the relationship is only
significant at the reduced level of p < 0.10. The impact of this result will also be discussed in regards to culture. Finally, the relationship between SN->BI (H2a) cannot
be shown at all. Once again, this may be due to the sample size or ambiguity in the measurement tool.
Table 9: Coefficients for the Canadian Sample
Coefficients
Unstandardized Coefficients
Standardized Coefficients
Model B Std. Error Beta t Sig. (Constant) -.791 .619 -1.277 .205 Att .791 .115 .652 6.883 .000 SN .113 .128 .082 .885 .379 1 PBC .198 .106 .153 1.873 .065 a. Dependent Variable: BI (Constant) -.714 .678 -1.054 .295 1 BI .664 .120 .527 5.550 .000 a. Dependent Variable: Beh.
The Canadian sample results are similar to the Taiwanese sample, and can be found in Table 6. Although similar, other than the SN->BI relationship, the results were
predicted. The predicted outcomes were achieved for the Att->BI (H1b) and BI->Beh
(H4b) relationships at p < 0.05 significance. As with the Taiwanese sample, the
PBC->BI relationship (H3b) was only significant at p < 0.10. The strength of this
relationship was predicted due to the Canadian consumers strong perception of
control over purchasing green products. Once again, SN->BI is not shown at all (H2b),
providing more evidence that the reliability issues with this variable are at play, not necessarily proof that the relationship does not exist between the variables.
The entire analysis for the model, including the hypothesized relationships and their analysis, can be found in Figure 6.
Figure 6: Graphical Representation of the Hypotheses Analysis
Cultural Hypotheses
As the previous tables have shown, the reliability of the SN variable is below the recommended level. Subsequently, its ability to measure the affects of important referents on an individual’s intention to purchase green products would also be reduced. In this situation it is impossible to draw any underlying conclusions as to the impact culture has on the relationship SN plays in the decision making of Taiwanese consumers. The fifth hypothesis (H5), re-stated; given Taiwanese collective nature,
subjective norm rather than attitude will exert a stronger influence on behavioral intention to purchase green products, can clearly not be rejected with the available
literature to the contrary, it is highly unlikely that this study has uncovered a new behavioral pattern for Taiwanese consumers.
The unpredicted strength of the relationship between Att->BI, as shown in Figure 6, may be due to the beliefs involved with forming attitudes. Specifically, the notion that collectivism and individualism play a part in the formation of attitudes, as shown in the work done by Chan (2001). In that study, several variables were measured to predict the positive eco-friendly attitudes of Chinese consumers. The collective nature of the consumers was shown to have statistically significant impact on attitudes at p < 0.05. The strength of the Taiwanese Att->BI relationship may be somewhat explained by the presence of the SN beliefs within attitudes and through the limitations of the SN measurement.
The sixth hypothesis (H6), given Canadian’s individualistic nature, attitude, rather
than subjective norm, will exert a stronger influence on behavioral intention to purchase green products, was proven in this study. Although there were issues with
the SN data, Att is clearly the most statistically significant indicator of BI at p = 0.000. These findings support the previous literature, which indicated that attitudes are the strongest predictors of intent for Western consumers (Bond & Forgas, 1984; Chan, 2001; Chan & Lau, 2001; Hofstede, 1983; Hsieh, Shybut & Lotsof, 1969; Lee & Green, 1991; Postrel, 1993; Wrightson, 1997).
Finally, (H7) the hypothesis associated with perceived behavioral control is not
supported by the data and cannot be rejected. Stated; given Taiwanese external locus
of control, perceived behavioral control will be shown to have a greater statistical influence on intention to purchase green products in comparison to Canadian consumers, the Taiwanese p value was 0.074 and the Canadian p value was 0.065.
interesting results. As indicated by their high mean scores for PBC (found in Table 2), 6.18 out of 7, Canadians feel they have a great deal of control over purchasing green products. As the literature previously pointed out, high scores in PBC not only indicates a high level of internal locus of control, but also results in a diminished influence on intention. To review, if an individual feels they have a great deal of control over the performance of a behavior, then the predictive ability of PBC is reduced and either Att or SN will have the strongest influence on BI. This situation was anticipated and held true for the Canadian sample, with p = 0.065 for the PBC->BI relationship.
What was not expected was the existence of the same relationship, in fact a less significant relationship, within the Taiwanese sample. Although this contradicts the notion put forward by the locus of control literature (Cheung, 1993; Hines,
Hungerford & Tomera, 1986/7; Tseng, 1972), it may be explained by one of PBC’s theories. That is, the influence of PBC would be even more apparent if the behavior involved was one in which people had little experience performing (Ajzen, 1991). This was the case in Chan & Lau (2001), where PBC was much stronger in Chinese consumers than their American counter parts. The rationale in this study was that the Chinese did not have the resources (knowledge, money and time) or the opportunities (availability of green products). It can be argued that the same is not true for
Taiwanese consumers. Their annual income, education levels and the availability of green products in the Taiwanese market lend support to the idea that Taiwanese may have external locus of control where it comes to purchasing green products.
5. Conclusions
5.1 Implications
The above analysis has produced several interesting results. First, through the
examination of green purchase behavior in Canadian and Taiwanese cultural settings, it provides additional validity to the use of TPB as a tool to measure eco-friendly behavior. Although limitations exist when the model is applied to the Canadian and Taiwanese samples individually, the combined samples provide overall statistically significant validity for the model.
Second, this study shows the causal link between green purchase intention and its corresponding behavior. In all three samples, behavioral intention was a direct indication of the performance of the behavior. This not only suggests that the Taiwanese and Canadian respondents perform on their intentions, but also that they have a significant level of ‘actual behavioral control’. The influence of the actual control was not present in the finding of the study suggesting that both samples perceived control was accurate.
Third, the research points out the strong relationship between attitudes and behavioral intention, regardless of culture. In both the Taiwanese and Canadian samples,
attitudes towards green purchase behavior were the most statistically significant variable for predicting intention to purchase green products. It also implies that in Canadian consumers, subjective norms have little to do with intention, providing further evidence to the notion the North American’s are highly individualistic in nature. These results can provide some direction for green marketers looking to capitalize on the changing opportunities in the marketplace.
Finally, the evidence in this study further supports the notion that perceived behavioral control is a less significant predictor of intention when used to measure individuals who have a high level of perceived control. The results of both cultures in this area show a relationship between high scores in PBC and lessened predictability. In addition, the high level of perceived control by the Taiwanese respondents
indicates that they differ from other Asian consumers studied in the literature. This is potentially an area where marketers and policy makers could make eco-friendly and financial gains.
5.2 Limitations
Although the results of this study offer support for the implications mentioned above, it is not without its limitations. First, since it was conducted as an online survey, the verification of the respondents’ results is limited. This opens the door for positive respondent bias, as respondents might overstate their environmental concern (Rice, Wongtada & Leelakulthanit, 1996). The self-reporting nature of this study is limited in comparison to a tool for measuring actual behavior. Second, because the survey was conducted in only two cities, one in each country, the findings may not capture the overall ecological variations that exist throughout the each country. Clearly, the greatest limitation to this study was its size and scope. The limited sample size for both Canadians and Taiwanese manifested itself most notably in the subjective norm variable. Without have a true indication of the influence SN exerts on behavioral intention, it is difficult to qualify the other findings in this study.
5.3 Future Research
From the results and limitations of this study there are three areas suggested for future research. First, the effects of subjective norm should be looked at again for both
samples. The reason for this would be to eliminate the unreliability experienced in this study and to gain a true measure of the affects of referents on decision-making. Attitudes and their influence on intention should be further studied. With regards to the overwhelming evidence supporting attitudes being a strong indicator of intent, it would be useful to look closely at what variables influence attitudes in order to gain a greater understanding of behavior. Finally, the relationship of internal and external locus of control should be investigated regarding Taiwanese consumers. Further study would provide insight into their perceived sense of control and would aid in
predicting behavior.
5.4 Concluding Remarks
While the Theory of planned behavior has been shown to provide a satisfactory level of external validity in predicting green purchase behavior, the model had rarely been used to measure non-Western cultures. Although the results of its application to Taiwanese and Canadian consumers were mixed, in general it was able to capture the relationships that influence behavioral intent, save subjective norm. The application of this model to Taiwanese and Canadian cultures failed to support the hypothesis that the collective nature of Taiwanese consumers would have a strong impact on decision to purchase green products. It did highlight the individualistic nature of Canadian consumers and suggested that when it comes to purchasing green products, Taiwanese are shown to have an internal locus of control.