* Corresponding author. Fax: 886-2-2362-6092. E-mail address: [email protected] (K.-K. Liu)
Continental Shelf Research 20 (2000) 493}523
Cross-shelf and along-shelf nutrient #uxes derived
from #ow "elds and chemical hydrography
observed in the southern East China Sea o!
northern Taiwan
Kon-Kee Liu
!,*, Tswen Yung Tang!, Gwo-Ching Gong",
Liang-Yu Chen
!, Fuh-Kwo Shiah#
!Institute of Oceanography, National Taiwan University, P.O. Box 23-13, Taipei, Taiwan, ROC "Department of Oceanography, National Taiwan Ocean University, Keelung, Taiwan, ROC
#Center for Ocean Research, National Taiwan University, Taipei, Taiwan, ROC
Abstract
Cross-shelf exchange of nutrients (N, P and Si) o! northeastern Taiwan and along-shelf transports just north of the Taiwan Strait was assessed using chemical hydrography and velocity "elds observed in August 1994 (summer) and March 1997 (winter). The summer survey was conducted along the periphery of a triangle. The velocity "eld was determined by phase-averaged current velocities measured with ship-borne ADCP on two rounds separated by 3.5 cycles of the dominant M2 tide. Nutrient distributions were derived from phase-averaged hydrographic data. Although the in#owing and out#owing volume transports were mis-matched by 14% largely due to poorly estimated surface #ow that carried little nutrients, the inputs and outputs of nutrients agreed within 2}5%. Such consistency lends support to the adopted approach for estimating nutrient #uxes. The winter survey, which provided observa-tions on two transects, one along-shelf and one cross-shelf, was conducted using two ships separated by 1/2 cycle of the M2 tide. Results from the two ships allowed determination of the phase-averaged #ow "elds and chemical hydrography. The two surveys indicated that the Kuroshio upwelling provided rather constant nutrient #uxes to the shelf, which were compara-ble to the total nutrient in#uxes from slope waters to the Mid and South Atlantic Bight and considerably larger than the riverine sources. Signi"cant amounts of nutrients from the shelf leaked back into the surface layer of the Kuroshio, replenishing its impoverished nutrient reserves. Along-shelf nutrient #uxes from the Taiwan Strait changed drastically between seasons, ranging from less than half to more than double the Kuroshio inputs. In the light of the
0278-4343/00/$ - see front matter ( 2000 Elsevier Science Ltd. All rights reserved. PII: S 0 2 7 8 - 4 3 4 3 ( 9 9 ) 0 0 0 8 3 - 7
variability of the shelf environment, more observations are needed to better determine the mean condition of this transport. ( 2000 Elsevier Science Ltd. All rights reserved.
Keywords: Nutrients; Transport; Upwelling; Shelf currents; Kuroshio; Southern East China Sea
(25}26.53N, 120}1233E)
1. Introduction
The continental margins of the ocean sustain an enhanced primary productivity due to rich supply of nutrients from terrestrial and marine sources (Walsh, 1991; Wollast, 1991, 1993). Much attention has been given recently to the marginal seas with special emphasis on nutrient budgets in order to better constrain the continental margin carbon #uxes (Gordon et al., 1996; Hall et al., 1996; Liu et al., 1999).
The East China Sea (ECS) shelf receives a rich supply of nutrients from Changjiang (the Yangtze River) and other rivers as well as from the Kuroshio (Gong et al., 1996). The total runo! from major rivers to the ECS shelf is about 1.1]1012 m3 yr~1, 85% of which is from Changjiang (Zhang, 1996). The riverine discharges are rich in nitrogenous nutrients and silicate but low in dissolved phosphate (Edmond et al., 1985; Zhang, 1996), such that wide spread excess in nitrate exists in the shelf water relative to phosphate (Wong et al., 1998).
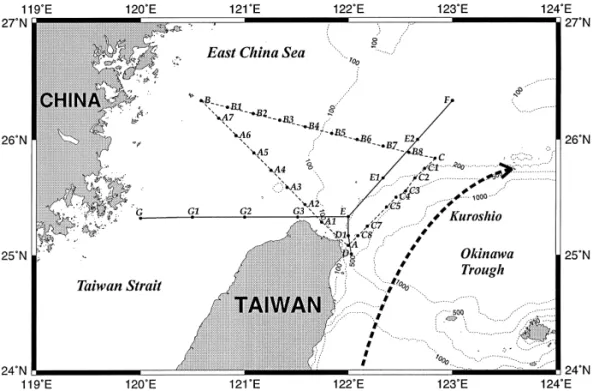
The Kuroshio is a strong western boundary current that #ows northward o! eastern Taiwan and turns northeastward as it enters the Okinawa Trough (Fig. 1). The main stream of the Kuroshio shifts its path seasonally (Sun, 1987). During the northeast monsoon (often referred to as the winter condition) from mid-September to mid-April, the current path is closer to the shelf break; during the southwest monsoon (often referred to as the summer condition) in the rest of the year, the current path shifts seaward (Sun, 1987; Chao, 1991).
As the Kuroshio impinges on the shelf break northeast of Taiwan, some of the surface water intrudes onto the shelf forming a Branch Current (Qiu and Imasato, 1990; Hsueh et al., 1992) and some of the subsurface water forms a Countercurrent hugging the slope (Chuang et al., 1993). The Countercurrent mentioned here is mainly a localized feature, which is not to be confused with the one observed between the Kuroshio main stream and the Ryukyu Islands (Qiu and Imasato, 1990). The Countercurrent apparently feeds the Kuroshio Subsurface Water (KSSW) which intrudes onto the shelf forming a cold dome at the shelf break (Chern et al., 1990; Liu et al., 1992b; Chuang et al., 1993). This subsurface intrusion, often called the Kuroshio upwelling, exists all year around and is considered a major nutrient source to the shelf (Wong et al., 1991; Liu et al., 1992a; Gong et al., 1995). In winter, as the Kuroshio's path shifts shelfward the position of the upwelling center also shifts shelfward (Gong et al., 1997). A cyclonic eddy around the upwelling center has been observed in summer (Tang et al., 1999). The out#owing limb of the eddy is probably responsible for exporting of the shelf water to the Kuroshio as low-salinity "laments (Chern et al., 1990).
Fig. 1. Cruise tracks and hydrographic stations of surveys reported in this study. The thick dashed curve indicates the mean path of the Kuroshio main stream o! northeastern Taiwan (Sun, 1987; Qiu and Imasato, 1990). Cruise tracks forming the triangle ABC were surveyed during the summer cruise August 1}7, 1994. Transects AC, AB and BC are designated as the eastern, southern and northern transects. Cruise tracks D}E, E-F and E}G were surveyed during the winter cruise March 3}13, 1997.
The purpose of this study is to determine quantitatively as to how important the contribution of Kuroshio upwelling is to the nutrient budget of the ECS shelf and how it may change in di!erent seasons. This study also provides estimates of nutrient in#uxes from the Taiwan Strait Water (TSW) to the ECS shelf, and nutrient exports from the shelf to the oligotrophic Kuroshio Surface Water in the exchange process. These estimates are based on hydrography, nutrient distributions and #ow "elds obtained in two seasons under di!erent prevailing winds in the southern ECS.
2. Materials and methods
This study reports observations from two surveys, one in mid-summer and the other in late-winter in the sea o! northern Taiwan. The summer cruise (No. 361 of
Ocean Researcher I) took place during August 1}7, 1994. The cruise tracks (Fig. 1)
formed a closed triangle (ABC) with the three sides denoted, respectively, as the eastern (AC), the southern (AB) and the northern (BC) transects. The winter survey involved a two-ship operation (Cruise No. 478 of Ocean Researcher I and Cruise No.
309 of Ocean Researcher II) conducted during March 3}13, 1997. The data reported in this study are from cruise tracks DEF and EG (Fig. 1).
During the summer cruise, the current was measured underway with a ship-borne 153 kHz Acoustic Doppler Current Pro"ler (ADCP). Measurements were recorded every minute in depth bins of 8 m from 16 to 304 m below the surface. The earth-referenced current velocity was calculated by subtracting the ship velocity from the ADCP measurement (Joyce, 1989). The ship velocity was determined in turn from GPS positioning. The cruise track (ABC) was repeated with a time separation of 43.47 h, exactly 3.5 times the period of the M2 tide, which is dominant in this region (Tang and Lee, 1996). The current data were calculated for every 8 m starting at a depth of 16 m and averaged over every 9 km (5 NM) along the cruise track. Because the current velocity in the top 16 m was not measurable by the ship-borne ADCP, the velocity of the surface layer was assumed to be the same as that at 16 m. Averaging of the two measurements at the opposite phase of the M2 tidal cycle yields a low-frequency current velocity, which has an estimated mean error of 2.5 cm s~1 (Tang et al., 1999). During the winter survey, the two research vessels steamed on the same tracks (DEF and EG). The Ocean Researcher II, which was equipped with a 75 kHz ADCP, followed the Ocean Researcher I with a delay of 6.21 h, exactly one half of the period of the M2 tide.
The chemical hydrography of the study area was obtained at the hydrographic stations shown on the cruise tracks (Fig. 1). Temperature and salinity were measured with Seabirdt SBE9/11 CTD systems, and water samples were collected with Go-#o bottles mounted on the Rosette Assemblies (General Oceanict). For the summer cruise, nutrient samples were obtained only on the "rst round; for the winter survey, nutrient samples were obtained on both ships. Nutrients were measured colorimetrically with an FIA system (Strickland and Parsons, 1972; Gong et al., 1995). The precision is 0.3, 0.03 and 1lM for nitrate, phosphate and silicate, respectively.
3. Results
3.1. The summer cruise
3.1.1. Flow xeld
The phase-averaged velocities along the cruise track are shown by the vertical sections of the normal and the tangential component on the three transects (Figs. 2}4). For the normal component, the inward direction is de"ned as positive so that its surface integration along the three transects yields the net in#ow, which should be zero for a steady state. For the tangential component, the positive direction is to the right of an observer who faces the inside of the triangle. Results from the eastern and southern transects, representing the upstream conditions, are described "rst, and then results from the northern transect are described.
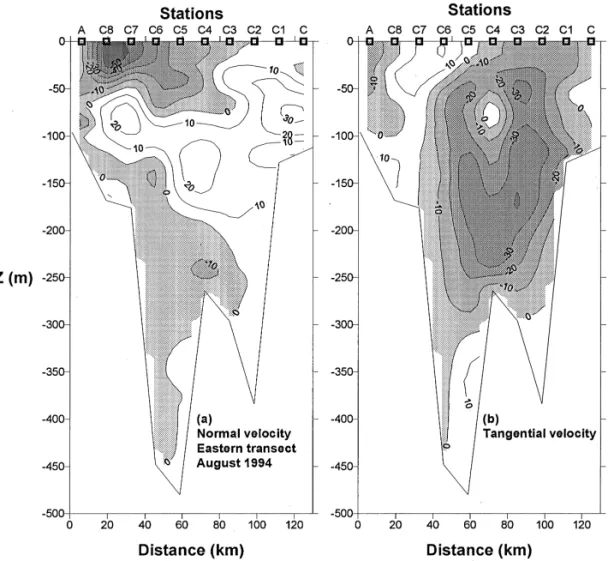
On the eastern transect (Fig. 2(a)), the surface layer with a thickness of about 70 m contained the two limbs of a cyclonic eddy (Tang et al., 1999) with in#ow on the
Fig. 2. Vertical section of phase-averaged velocities on the eastern transect on the summer cruise. The shaded areas indicate negative velocities. (a) Velocities normal to the section with inward as the positive direction. (b) Tangential velocities with rightward as the positive direction.
northern side (Stations C}C3) and out#ow on the southern side (Stations A}C3). In the middle layer from about 70 m to about 200 m, the #ow was mostly towards the shelf indicating onwelling. Below 200 m, the current #owed into the canyon on one side and exited on the other side with the tangential component (Fig. 2(b)) mostly to the left (southwestward), depicting the Kuroshio Countercurrent that #ows close to the slope along isobaths (Chuang et al., 1993).
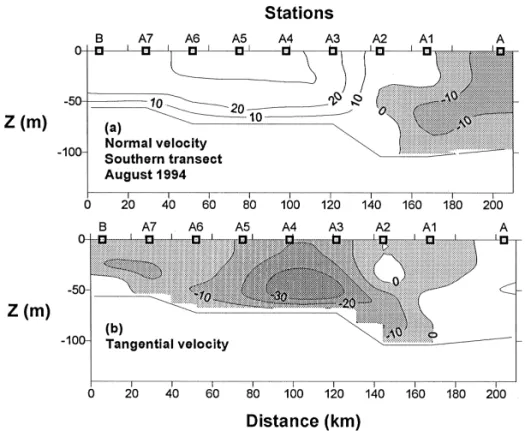
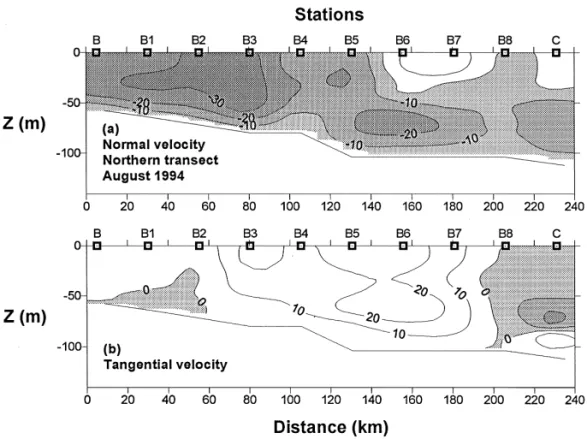
The #ow pattern on the shelf was simpler (Figs. 3 and 4). On the southern transect, the water directly to the north of the Taiwan Strait (Stations A2}B) #owed along the shelf, while the water o! the northern tip of Taiwan (Stations A and A1) #owed seaward to the southeast (Figs. 3(a) and (b)). On the northern transect, most water #owed to the north or northeast, but the outermost portion (Stations B8 and C) #owed to the northwest (Figs. 4(a) and (b)), representing the intruding Kuroshio
Fig. 3. Same as Fig. 2 except for the southern transect.
Surface Water as indicated by its high salinity (see next section). A weak southward #ow observed in the surface layer at Stations B6 and B7 (Fig. 4(a)) probably resulted from recirculation of the northward #owing shelf water, as indicated by the T}S properties.
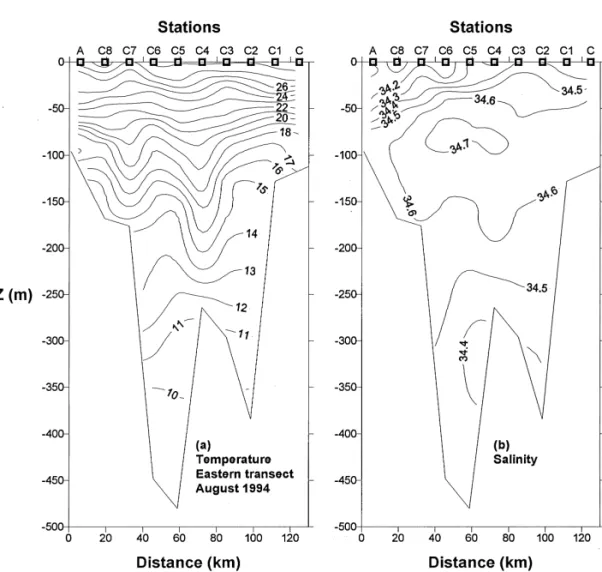
3.1.2. Hydrography
The phase-averaged temperature and salinity distributions along the three transects are shown in vertical sections (Figs. 5}7). In the surface layer (0}80 m) of the eastern transect (Fig. 5(b)), the salinity distribution showed a contrast between the two limbs of the cyclonic eddy with the out#ow (S"34.0}34.5) less saline than the intruding Kuroshio Surface Water (S"34.4}34.6), while the temperature ranged between 22 and 293C with little di!erence between the two limbs of the eddy. The onwelling water in the subsurface layer of the eastern transect showed rather a uniform salinity (34.5}34.7), but a fairly strong vertical gradient (15}223C), which are characteristic of the KSSW (e.g., Gong et al., 1995).
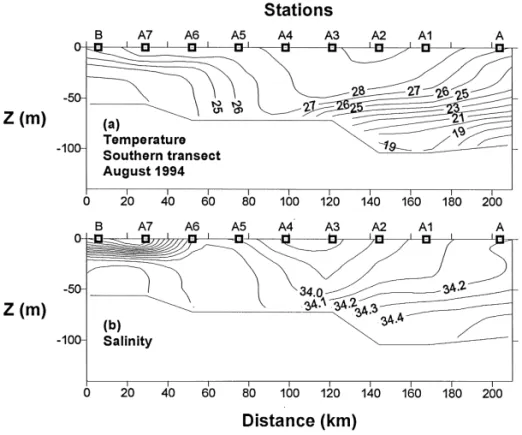
The southern transect exhibited wide ranges of temperature (19}293C, Fig. 6(a)), and salinity (33.2}34.6, Fig. 6(b)). The very low salinity indicated the presence of the Continental Coastal Water in the inner shelf, where the water column was highly strati"ed. By contrast, the middle part of the southern section was weakly strati"ed with rather a uniform temperature as well as salinity. Such a spatial variation in water column structure was consistent with previous "ndings in the Taiwan Strait reported
Fig. 4. Same as Fig. 2 except for the northern transect.
by Wang and Chern (1992), who attribute it to the topography-controlled #ow condition in the Strait. The rather cool and saline bottom water in the outer shelf indicated intrusion of KSSW.
The temperature and salinity distributions of the northern transect (Figs. 7(a) and (b)) were similar to those of the southern transect except in the bottom water of the outer shelf, where considerably higher salinity ('34.7) was observed. The high salinity marked the presence of the intruding KSSW, whereas the slightly lower salinity on the outer shelf of the southern transect was indicative of mixing with the TSW.
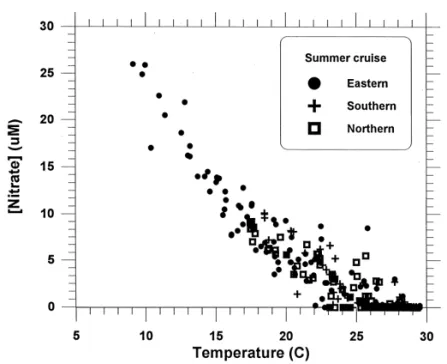
3.1.3. Nitrate distribution
Because nitrate was analyzed only during the "rst round on the summer cruise, the phase-averaged nitrate distribution was calculated from the phase-averaged temper-ature and salinity distributions using relationships established between nitrate con-centration and hydrographic properties. Nitrate concon-centration has been shown to follow temperature variation closely in the southern ECS (Gong et al., 1995). A similar relationship was also observed in this study (Fig. 8). In order to optimize the correlation, we treated each transect separately. For the eastern transect, we further divided the waters into three types according to the temperature. The results of regression analyses are described below.
Fig. 5. Vertical section of phase-averaged distributions of temperature (a) and salinity (b) for the eastern transect on the summer cruise.
The three types of waters on the eastern transects are those with temperatures higher than 26.53C, those between 15.5 and 26.53C and those below 15.53C, respective-ly. The regression functions are, respectively:
N"!1.570 ¹#45.2 for ¹*26.53C, R2"0.41, RMS of residual"0.9 lM, (1) N"0.0777 ¹2!4.047¹#56.5 for 26.53C'¹*15.53C, R2"0.88, RMS of residual"2.1 lM, (2) N"!2.231 ¹#46.5 for ¹(15.53C, R2"0.94, RMS of residual"1.8 lM. (3)
Fig. 6. Same as Fig. 5 except for the southern transect.
For the southern and northern transects, salinity is also used in the regression analyses because of the wide salinity range. The regression functions are, respectively:
N"1.756 ¹#1060/¹#15.2 S!603.9,
R2"0.85, RMS of residual"1.2 lM, (4)
N"!0.0094 ¹2!0.483 ¹!3.112 S#127.1,
R2"0.73, RMS of residual"1.3 lM. (5) The phase-averaged nitrate data on the three transects were calculated from the phase-averaged temperature and salinity data using regression functions. All these functions predict an inverse relationship between temperature and nitrate. In a few cases, negative values of [NO~3] are generated from regression functions usually due to rather high temperatures. Then, the concentrations are set to zero. At the apexes of the triangle, di!erent nitrate concentrations were obtained from the two regression functions, one for each side. The mean di!erences between the two sets of values for the three stations were all less than 1.5lM, within the range of the root mean square (RMS) of the regression residuals. As far as the estimation of nitrate #uxes is
Fig. 7. Same as Fig. 5 except for the northern transect.
Fig. 8. Plot of nitrate vs. temperature observed during the "rst round of the summer cruise. 502 K.-K. Liu et al. / Continental Shelf Research 20 (2000) 493 }523
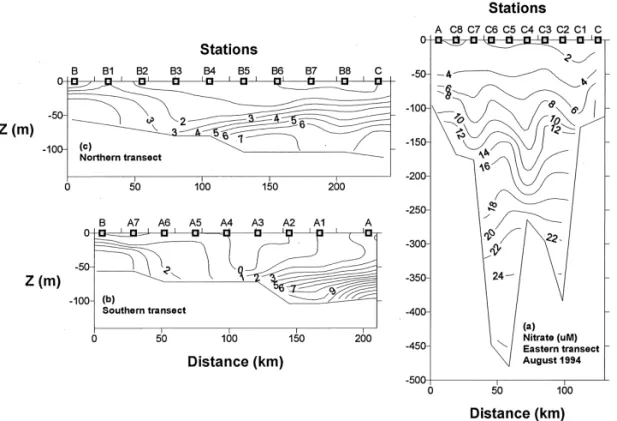
Fig. 9. Vertical section of phase-averaged distributions of nitrate on the eastern (a), southern (b) and northern (c) transects on the summer cruise.
concerned, little additional error would be introduced by the non-unique nitrate to ¹and S relationships. The calculated results of phase-averaged nitrate distributions are shown in Fig. 9.
As expected, the nitrate distributions resemble the temperature distributions. The nitrate concentrations at the depth of 200 m (Fig. 9(a)), which was at the base of the onwelling water, ranged between 13 and 16lM, which are consistent with those of the source upwelling water derived from hydrographic data (Liu et al., 1988; Wong et al., 1991; Gong et al., 1995). The out#ow from the shelf in the surface layer (0}ca 70 m at Stations C3}C8 and A (Fig. 9(a)) had nitrate concentrations less than 5lM. On the southern transect (Fig. 9(b)), nitrate was enriched in the bottom waters in the inner shelf and o! northern Taiwan, and depleted in the middle. The northward #owing bottom water in the inner shelf had relatively high salinity ('34.1) in comparison to typical Continental Coastal Water, indicating its origin from the deep channel in the southern Taiwan Strait (Wang and Chern, 1992). The nitrate-laden seaward #owing bottom water in the outer shelf was apparently infused with the intruding KSSW. The low nitrate concentration in the middle part of the section was associated with the destrati"ed warm water from the eastern half of the Taiwan Strait (Wang and Chern, 1992). The nitrate distribution on the northern transect (Fig. 9(c)) was similar to that on the southern transect, except that the nitrate-laden bottom water in the middle and
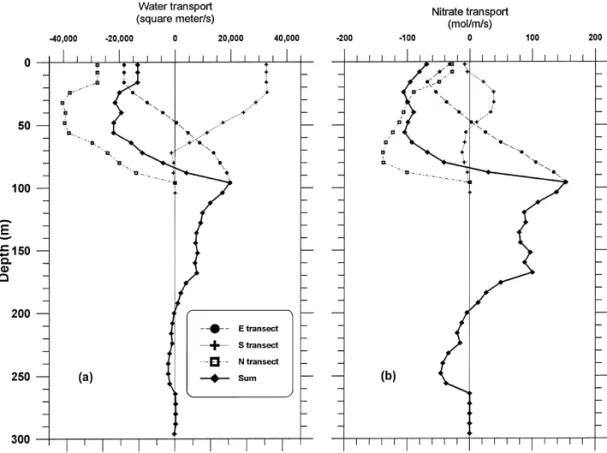
Fig. 10. Integrated volume transport (a) and nitrate #ux (b) as functions of depth on the three transects on the summer cruise. Also shown are the total transports at each depth.
outer shelf mostly #owed to the north, indicating in#ow from the Kuroshio to the shelf.
3.1.4. Water and nutrient transports
The volume transport of the phase-averaged #ow was calculated for each transect from the phase-averaged current velocity in the direction normal to the transect. The current velocity near the bottom was interpolated from the deepest measured value with the velocity at the bottom assumed as zero. The result of integration for each section together with the net transport is shown as a function of depth in Fig. 10(a). The northern transect showed net out#ow in the entire water column; the southern transect showed net input in the top 70 m, and net export in the deeper part; the eastern transect showed net export in the top 50 m and net export between 50 and 200 m. Generally speaking, the top 90 m of the triangular study area showed net export of water, while the subsurface water between 90 and 200 m provided water onwelling towards the shelf. However, the input and output did not match with a de"cit of about 0.6 Sv, which is further elucidated in the Discussion.
The transports of heat, salt and nutrients were also calculated by integrating the #uxes, which were the products of velocity and the respective volumetric properties, namely, the heat content, salt content, and nutrient concentrations. The salt content of the water was calculated from the salinity assuming the speci"c gravity to be 1.03 g cm~3. The heat content was calculated from the temperature (using 03C as the reference level) with the additional assumption of a speci"c heat of 0.933 cal g~1 (Sverdrup et al., 1942). The heat and salt transports are reported in units of TW (1012 W) and kt s~1 (109g s~1), respectively. The nitrate transport was calculated from the phase-averaged nitrate distributions (Fig. 9). For phosphate and silicate distribu-tions, their concentrations were calculated from their respective correlation with nitrate as shown below:
[PO3~4 ]"0.0606[NO~3]#0.07, R2"0.969, (6) [Si]"0.0459[NO~
3]2#0.7403[NO~3]#3.7, R2"0.954, (7) where concentrations are expressed inlM.
The transports of nitrate on the three transect and the net transports are shown as functions of depth in Fig. 10(b). Because of the relatively low concentrations of nitrate in the surface waters, their contributions to the nitrate transport are less important than the contributions of the subsurface waters. Similar to the volume transport, the top 90 m of the control volume showed a net out#ow of nitrate, while the subsurface waters (90}200 m) were the main providers of the upwelled nitrate. Although the input and output still mismatched, the de"cit was relatively small as illustrated later.
3.2. The winter survey
Currents and chemical hydrographic parameters were measured on both ships used for the winter survey. The hydrographic samples were collected at the hydrographic stations shown in the "gures. The phase-averaged data were calculated by averaging the gridded interpolation (using Golden Software's Surfert) of data obtained on each ship.
3.2.1. Shelf edge transect
Flow conditions observed in March 1997 were typical of the winter conditions. The currents measured along a section similar to the eastern section (AC) of the summer cruise reached over 100 cm s~1, indicating the shelfward shift of the Kuroshio#ow path. In order to depict the subsurface intrusion of the Countercurrent onto the shelf, we present observations along a more shelfward transect (DEF) and a transect (EG) across the shelf at the northern end of the Taiwan Strait (Fig. 1).
Transect DEF cuts across the head of the canyon shown in the eastern transect of the summer cruise. The normal component of the current velocity observed on this transect showed intensi"ed #ows of opposite direction within the canyon, indicating
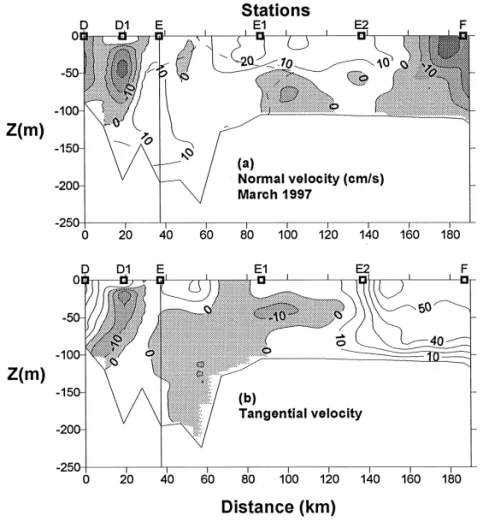
Fig. 11. Same as Fig. 2 except for Transect DEF on the winter cruise. The dashed curves enclose the region designated as the intruding KSSW.
the existence of the cyclonic eddy in winter (Fig. 11(a)). The onwelling #ow was on the northeastern side of the canyon and extended beyond the canyon wall. The seaward #ow was on the southern side of the canyon (Stations D and D1) with a low-salinity core near the surface at Station E (Fig. 12(b)), which indicated a shelf origin of the out#ow.
The tangential component (Fig. 11(b)) between Stations E and E2 was noticeably negative, i.e., #owing to the southwest, suggesting this #ow as a limb of the Counter-current. The temperature distribution (Fig. 12(a)) showed a prominent dome structure over the canyon, which is a persistent feature of the Kuroshio upwelling (Liu et al., 1992a,b). At the base of the canyon, the water had ¹}S properties (¹"153C and
S"34.6) characteristic of the upwelling source water (Wong et al., 1991; Gong et al.,
1995). The high nitrate concentration (up to 12lM) suggested that it is the major nutrient carrier.
Further to the northeast, the tangential velocity increased to over 60 cm s~1 (between Stations E2 and F), which was considerably higher than the normal
Fig. 12. Vertical section of phase-averaged distributions of temperature (a), salinity (b) and nitrate (c) for Transect DEF on the winter cruise.
component, indicating this #ow to be essentially northeastward. The high salinity (up to 34.8) and high temperature (up to 253C) identi"ed it as a part of the intruding Kuroshio surface layer. The nitrate concentration was typically low. Transports of the
Fig. 13. Same as Fig. 2 except for Transect EG on the winter cruise.
surface intrusion are not considered in this study because its nutrient loading is low and it tends to rejoin the Kuroshio (Qiu and Imasato, 1990).
3.2.2. Cross-shelf transect
Section EG extends across almost the entire shelf just o! the northern end of the Taiwan Strait. The meridional velocities (Fig. 13(a)) within the Taiwan Strait (Stations G}G3) were all northward with a high velocity core in the middle, corresponding to a water of high temperature, high salinity and low nitrate (Figs. 14(a) and (b)). The #ow "eld and hydrographic structure were similar to summer conditions, but the core was more intensi"ed in winter. The outer shelf had a weak southward #ow hugging the slope beneath the surface, which represented the Countercurrent.
The zonal velocities (Fig. 13(b)) in the outer shelf seemingly indicated shelfward intrusion from the Kuroshio from the surface to the bottom, but the low salinity in the surface layer (Fig. 14(b)) suggested shelf origin of these waters. Therefore, they must have been re-cycled back from the shelf water export. The positive zonal velocities (Fig. 13(b)) of the TSW could facilitate seaward export of some low-salinity water.
The rather high nitrate concentration (6lM) associated with the low-salinity water (33.6) in the outer shelf (Station G3) is noteworthy because it could have contributed signi"cantly to the export of nutrients. The origin of this nutrient-laden water is not known. The China Coastal Water found in the western end of the section was
Fig. 14. Same as Fig. 12 except for Transect EG.
characteristically low in salinity and high in nutrients and could have been the source of the nutrient-laden water in the outer shelf, but how it was transported across the shelf is not clear.
3.2.3. Nutrient yuxes
The nutrient #uxes were calculated from the product of the phase-averaged velocity normal to the transect and the phase-averaged nutrient concentrations. The nitrate distributions along Transects DEF and EG are shown in Figs. 12(c) and 14(c). Similar data for phosphate and silicate are also available but are not shown. The nitrate #uxes
Fig. 15. Nitrate #uxes (mmol N m~2 s~1) calculated from#ow "elds and nitrate distributions on Transects DEF (a) and EG (b) on the winter cruise.
calculated for the two transects are shown in Fig. 15. The highest in#ux of nutrients (2.1 mmol N m~2 s~1, 0.15 mmol P m~2 s~1, and 3.2 mmol Si m~2 s~1) from the KSSW was in the mid-depth within the canyon (Fig. 15(a)), while the highest seaward nitrate #ux (2.6 mmol Nm~2 s~1, 0.23 mmol P m~2 s~1and 4.5 mmol Si m~2 s~1) was on the southern side of the canyon adjacent to the strong in#ux. The nitrate #uxes associated with the intruding Kuroshio Surface Water were less important despite their rather high velocity.
The nitrate #uxes across Transect EG were weak on the eastern half and strong on the western half. The highest #ux (6 mmol N m~2 s~1, 0.24 mmol P m~2 s~1 and 9.2 mmol Si m~2 s~1) was associated with the China Coastal Water as a result of the high nitrate concentration (up to 14lM) and rather high velocity (up to 52 cm s~1). The Kuroshio Countercurrent in the outer shelf carried nutrient #uxes with maximum values of 0.5, 0.04 and 0.7 mmol N m~2 s~1.
4. Discussion
The closed cruise track and the more tightly spaced hydrographic stations of the summer cruise provided su$cient data to check the conservation of water and
materials achieved by the observations. Therefore, the summer transports are dis-cussed in greater detail to show the e!ectiveness of the approach. The winter survey, though providing less densely distributed hydrographic data, still revealed important features in the region. The estimated major transports in summer and winter are discussed for their di!erences and compared to other studies.
4.1. Summer transports
In order to di!erentiate waters from various sources and to trace their fates, we divided the eastern and the southern sections into subsections with di!erent water characteristics (Table 1). The volume transport and the associated nutrient transports of each type were estimated and discussed. Then, the nutrient inputs from Kuroshio upwelling and the nutrient outputs due to shelf water out#ow were calculated from these components (Table 2).
4.1.1. Transports of diwerent water types
The ¹}S diagram (Fig. 16) shows a gap of data points at thepT"24 isopycnal among samples from the southern and northern transects. This isopycnal corresponds to a temperature of about 223C for shelf waters, which is consistent with previous "ndings of the minimum temperature in the Taiwan Strait in summer (Wang and Chern, 1992). Any water with a lower temperature must have originated from sources outside the shelf, such as the Kuroshio upwelling. In this study, we adopted this temperature as the upper limit of temperature of the intruding KSSW. For the lower limit, we used the minimum temperature (15.53C) observed in the onwell-ing slope water near the shelf break. Thus, waters on the eastern transect were classi"ed according to temperature into three types (H: *223C, M: 15.5}223C, L:(15.53C), corresponding to the surface, the subsurface and the slope waters (Table 1).
The TSW was the major water mass observed on the southern transect, but did not account for all waters on it. The water column in the Taiwan Strait in summer is usually strati"ed in the western half, but well mixed with rather high temperature and low salinity in the eastern half (Wang and Chern, 1992). Accordingly, all the waters on the western half of the southern transect (Stations A4}B, Fig. 6) were considered TSW, while, on the eastern half (Stations A}A4, Fig. 6), only those waters with high temperature and low salinity (¹'273C and S(34.1) were considered TSW. The rest of the water on the eastern half was a mixture of the TSW and the intruding KSSW. The mixed waters were also classi"ed according to temperature in the same way as for the eastern transect (Table 1).
Following the classi"cation scheme, we identi"ed four in#ows and seven out#ows (Table 1). There were three in#ows from the Kuroshio (on the eastern transect) and one from the Taiwan Strait (on the southern transect). There were three out#ows on the eastern transect and three on the southern, all of which #owed back to the Kuroshio, and one on the northern, which #owed along the shelf to the north. For the southern and eastern transects, in#ows and out#ows were integrated for each water type (Table 1). For the northern transect, the net transport was integrated for
Tab le 1 T ra n spo rt s of wat er, heat ,s alt a n d ni tr a te a cross eac h tran sec t o f th e su m m er crui se .E a ch tr a n sp o rt is d esi g nat ed b y a sy m b o l whi ch d en o tes th e tra n se ct (E ,So r N ), te m per a tu re ran g e o r w a ter type (H : * 22 3 C, M: 15 .5 } 22 3 C, L : ( 15 .5 3 C ; T: TS W * se e tex t for de " nit ion ), a n d in # ow (i ) o r o u t# ow (o ) Tr a n se ct Water typ e C ri ter ia S ym bo l In # ow /o u t# ow W a te r H ea t S alt N P S i (S v) (T W ) (k t s~1 )( k m o l s~1 )( k m o l s~1 )( k m o l s~1 ) Surf a ce ¹* 22 3 CE H* In # o w 0.3 8 38 14 1.1 2 0.0 9 2.4 E H0 Ou t# o w 0.9 5 97 33 2.9 3 0.2 4 6.0 E a st Sub -s urf a ce 2 2 '¹ * 15 .5 3 CE M* In # o w 1.2 1 91 43 9.3 5 0.6 5 1 4 .7 E M0 Ou t# o w 0.1 0 7 4 0.8 1 0.0 6 1.3 Sl o p e ¹( 15 .5 3 CE L* In # o w 0.5 2 29 18 8.2 6 0.5 4 1 4 .0 E L0 Ou t# o w 0.3 4 18 12 6.0 3 0.3 9 1 0 .6 Sou th T S W S T* In # o w 1.8 8 2 0 1 6 6 1 .9 0 0 .2 5 8 .4 S T0 Ou t# o w 0.0 2 2 1 0.0 5 0.0 0 0.1 Mixed ¹* 22 3 CS H0 Ne t o u t# o w 0.2 4 23 9 0 .8 2 0 .0 7 1 .5 Mixed ¹( 22 3 CS M0 Ne t o u t# o w 0.0 8 6 3 0.9 1 0.0 6 1.4 N o rt h Shel f N 0 Ne t o u t# ow 2 .88 27 8 1 0 1 9 .56 0 .78 19 .4 T o tal In # o w 4 .00 35 9 1 4 1 20 .6 3 1 .5 3 3 9 .5 Ou t# o w 4 .62 43 2 1 6 2 21 .1 0 1 .6 0 4 0 .31 Im ba la nc e ! 0.6 2 ! 73 ! 21 ! 0.4 7 ! 0.0 7 ! 0.8 %o f m ea n th ro ugh p ut ! 14% ! 18% ! 14% ! 2% ! 5% ! 2%
Table 2
Comparison of transports in summer and winter in the southern East China Sea
Transport type Water Heat Salt N P Si
(Sv) (TW) (kt s~1) (kmol s~1) (kmol s~1) (kmol s~1)
Exchange at shelf edge ow northeastern Taiwan
Summer Onwelling of KSSW 1.21 89 43 9.8 0.68 15.4 Shelf-water out#ow! 0.83 84 29 2.7 0.22 5.3 Net Input" 0.83 61 30 7.1 0.46 10.1 Winter Onwelling of KSSW 0.69 45 25 6.3 0.51 9.2 Shelf-water out#ow# 0.22 15 8 1.7 0.13 2.7 Net Input" 0.59 38 21 5.5 0.39 7.9
Input from Taiwan Strait
Summer$ 1.88 201 66 1.90 0.25 8.4
Winter% 2.74 193 94 12.9 0.85 22.6
!Although the out#owing shelf water consisted of Taiwan Strait Water (TSW) and Kuroshio Subsurface Water (KSSW), nutrients in the out#ow are assumed to originate entirely from the KSSW. The escaped nutrients accounted for 32% of inputs from the onwelling KSSW.
"The net inputs of water, heat, salt and nutrients from the Kuroshio upwelling are calculated by subtracting the out#owing fraction from the onwelling transports of KSSW.
#Half of the nutrients in shelf water out#ow are assumed to originate from the KSSW and the rest from TSW.
$As observed on Transect A2}B. %As observed on Transect G}G3.
the whole section. The largest in#ow was the northward transport of TSW on the southern transect (ST*), 1.88 Sv, which was characterized by very high temperature (mean"26.63C) and very low salinity (mean"34.02). Among in#ows from the Kuroshio on the eastern transect, the subsurface in#ow (EM*) was the largest. This in#ow with fairly high mean nutrient concentrations (7.7lM NO~
3, 0.54lM PO3~4 and 12.1lM Si) carried the highest nutrient loading (Table 1).
The northern out#ow dominated the total out#ow with a transport of 2.88 Sv. The second largest out#ow was the eastern surface out#ow (EH0) with a transport of 0.95 Sv, much larger than the Kuroshio surface in#ow (EH*). Its considerably lower salinity (34.32) than that of the in#ow (34.57) suggests a contribution from TSW. The surface out#ow on the southern transect (SH0) had ¹}S properties similar to EH0, suggesting a similar origin. Three of the smaller out#ows, the eastern and southern subsurface out#ows (EM0 and SM0) and the eastern slope out#ow (EL0) resembled, as suggested by ¹}S properties, the in#ows of the subsurface and slope waters on the eastern transect, i.e., EM* and EL*. They represented the fraction of the Countercurrent that returned to
Fig. 16. ¹}S diagram for the summer cruise. The dashed curves are isopycnals withpT values denoted. The rectangular box indicates the ¹}S range of the intruding Kuroshio Subsurface Water.
the Kuroshio. The out#ow of TSW (ST0) was the smallest, but it represented only the unaltered TSW. Some of the TSW must have mixed with the intruding Kuroshio water and left the shelf along with the out#owing mixed water (SH0 and SM0).
4.1.2. Transport errors
The total water in#ow to the study area amounted to 4.0 Sv, and the total out#ow to 4.6 Sv. The de"cit of 0.6 Sv represents 14% of the mean throughput. Consequently, the heat and salt budgets also ended up in de"cits. The most pronounced de"cit was that (18%) of the heat transport. By contrast, the total input and output of nitrate almost balanced each other with only a 2% de"cit (Table 1). This seems counter-intuitive, as one may expect nitrate de"cit to be more pronounced due to uptake by phytoplankton, while heat de"cit to be more reduced due to solar heating. Simple calculations give estimates of sea surface nitrate uptake and heat transport at 170 mol s~1 and 9.4]1011 W based on the observed mean nitrate uptake #ux of 1.25 mmol N m~2 d~1 (Chen et al., 1999) and estimated heat #ux of 80 W m~2 calculated from the mean air}sea conditions in August taken from Comprehensive Ocean-Atmosphere Data Set. The total nitrate uptake was less than 1% of the mean
throughput of nitrate in the study area. The sea surface heat #ux was even less important, less than 0.3% of the advective heat #uxes.
The di!erence in the degree of imbalance in the heat and nitrate budget is apparently a consequence of the di!erent carriers of heat and nitrate. The warm surface water dominated the heat transport, whereas the cold nitrate-laden subsurface water dominated the nitrate transport. The near balance of the nitrate budget suggests the volume transport estimated for the subsurface water to be nearly correct, whereas the ampli"ed de"cit in the heat budget indicates that the error mostly is lying in the warm surface layer. The mean ¹}S properties of the water responsible for the de"cits may be calculated from the de"cits in volume, heat and salt transports. As expected, the calculation gave high temperature (28.83C) and low salinity (34.07), which are evidently the properties of the surface water on the shelf. Therefore, the errors were most likely associated with the currents in the surface layer on the shelf, which were insigni"cant in nitrate transport.
4.1.3. Major inputs and outputs
The Kuroshio upwelling was manifested as onwelling of the KSSW provided by the Countercurrent at the slope. Some of the incoming water returned to the Kuroshio without ascending. The onwelling transport of the KSSW may be calculated as
KSS"EM*#EL*!EM0!EL0!SM0, (8) where the symbols of water types stand for their respective transports of water and nutrients. The results are listed in Table 2. After intruding onto the shelf, the up-welled water mixed with other in#ows mostly from the Taiwan Strait. Some of the mixed shelf water left the shelf in the out#ow o! northeastern Taiwan, while the rest #owed along the shelf to further north. The transports of out#owing shelf water may be estimated as
X4"EH0#ST0#SH0!EH*, (9)
where the surface input on the eastern transect (EH*) is subtracted from the sum, because most of it may have been recycled back from the out#ow.
Since most of the nutrients in the TSW were in the inner shelf and had little chance of escaping from the shelf, all the nutrients in the shelf water out#ow probably came from the intruding KSSW. They represent about 32% of the upwelled nutrients. If the out#owing volume transport of the upwelled KSSW accounted for the same fraction as the nutrient #uxes, the out#ow would have amounted to 0.39 Sv. The rest of the upwelling transport (0.83 Sv) must have remained on the shelf. Then, the net input of nutrients from the Kuroshio upwelling to the shelf may be calculated by subtracting the export #uxes from the onwelling #uxes (Table 2). The heat and salt transports were calculated under the assumption that they were proportional to the volume transport (Table 2).
Besides Kuroshio upwelling, northward #ow from the Taiwan Strait also provided nutrients to the northward #ow on the shelf (Table 1). The combined inputs
Fig. 17. Same as Fig. 16 except for the winter cruise. Samples from Transect EG (crosses) represent TSW spreads along a trend subparallel to isopycnals. Some low-salinity waters on Transect EG, representing coastal waters, are not shown.
of nutrients from TSW and Kuroshio upwelling yield nutrient transports (9.0 kmol N s~1, 0.71 kmol P s~1 and 18.5 kmol Si s~1) fairly close to the observed values across the northern transect (9.6 kmol N s~1, 0.78 kmol P s~1 and 19.4 kmol Si s~1).
4.2. Winter transports
In contrast to the well-strati"ed water column structure observed on the eastern transect during the summer cruise, the winter conditions as revealed in Transect DEF were characterized by lateral segregation. The hydrographic structure of Transect DEF may be considered as three lateral segments: the onwelling KSSW sandwiched between the intruding Kuroshio Surface Water to its north and the out#ow of shelf water to its south (Fig. 12). The transports of the onwelling water and the shelf water export were estimated.
The region with doming isotherms (Fig. 12(a)) encompassed the two limbs of the cyclonic eddy. The #ow "eld clearly de"ned the intruding and outgoing limbs of the eddy, but some of the intruding water was recycled shelf water as indicated by the low salinity centered around Station E (Fig. 12(b)). Therefore, the isohaline of 34.2 psu was used as a boundary to separate the intruding KSSW and the recycled shelf water (see dashed curve near Station E in Fig. 11(a)). The KSSW was distinguished from the Kuroshio Surface Water by two conditions: temperature lower than 18.53C and salinity lower than 34.7 (see the dashed curve near Station E1 in Fig. 15(a)). The ¹}S
Table 3
Mean properties of major water masses calculated from mean transports observed in the southern East China Sea
Transport type Season ¹(3C) S [NO~
3] (lM) [PO3~4 ] (lM) [Si] (lM) Kuroshio Subsurface
Water (intrusion onto shelf)
Summer 18.2 34.68 8.1 0.56 12.7
Winter 16.1 34.55 9.2 0.66 13.3
Shelf Water o! north-eastern Taiwan (out#ow from shelf)
Summer 25.3 34.19 3.3 0.27 6.4
Winter 16.7 34.16 7.8 0.59 12.1
Taiwan Strait Water (northward #ow)
Summer 26.6 34.02 1.0 0.13 4.5
Winter 17.5 33.34 4.7 0.31 8.3
diagram (Fig. 17) shows the characteristics of typical Kuroshio water and the trend of the Taiwan Strait waters (Transect EG) which is subparallel to the isopycnals beginning near thepT"24 isopycnal. Between the two trends is the domain of the intruding KSSW, which includes samples distributed near the upwelling source water (with ¹"153C and S"34.6}34.7) from the Kuroshio.
The integrated #uxes of the intruding KSSW and the out#ow of the shelf water are listed in Table 2. The shelf edge out#ow was most likely a mixture of the shelf water and the intruding KSSW. Since the shelf water was fairly enriched in nutrients as observed at Stations G}G3, it could have contributed signi"cantly to the nutrient exports. Assuming half of the nutrients in the out#ow were provided by the KSSW, we calculated the net inputs of nutrients from the KSSW (Table 2). The net in#ows of water, heat and salt were also calculated as proportional to the nutrient #uxes. The transports of the TSW were calculated by integrating the #uxes from Station G to Station G3 (Table 2).
4.3. Comparisons between summer and winter conditions
The major transports estimated for summer and winter are listed in Table 2. The mean properties of major water masses were calculated from transport data and listed in Table 3 for comparison. Most transports show considerable variations. The water exchanges associated with the cyclonic eddy appear to be much reduced in winter, while the transport of TSW appeared to be strengthened in winter. Because the cruise tracks for the summer and winter cruises are di!erent, the comparison must be taken with caution. The di!erences should be considered to indicate trend rather than to provide precise measurement of seasonal changes.
Among all transports, the net intrusion of KSSW showed the least change, indicat-ing a rather constant strength of Kuroshio upwellindicat-ing. The water properties of the KSSW also showed the least change among the three water masses listed in Table 3. However, the intrusion from the Kuroshio to the shelf is not con"ned to the KSSW, but the Kuroshio Surface Water also intrudes onto the shelf, especially in winter. Because its contribution to the nutrient #uxes is limited due to its low nutrient concentrations, it is not considered in this study.
The much reduced shelf-water out#ow in winter was probably caused by the shelfward shifting of the Kuroshio main stream. Nevertheless, the nutrient #uxes carried in the out#ow were not as much reduced as the volume transport due to much higher nutrient concentrations in the out#owing water in winter (Table 3). The observed nutrient exports (1.7}2.7 kmol N s~1, 0.13}0.22 kmol P s~1 and 2.7}5.3 kmol Si s~1) were comparable to the nutrient transports in the top 100 m of the Kuro-shio (Chen et al., 1995). The persistent supply of nutrients to the oligotrophic surface layer of the Kuroshio could have raised primary productivity and new production in the Kuroshio adjacent to the ECS shelf.
The observed fairly high northward volume transport (2.74 Sv) from the Taiwan Strait in winter was quite a surprise. Previous studies have suggested that the #ow in the Taiwan Strait in winter should be southward (e.g., Fan, 1979) or partly southward along the western wall (Nitani, 1972). Because Station G of the winter cruise was fairly close to the Chinese coast and a rather strong northward #ow (up to 52 cm s~1) was observed therein, a southward coastal jet hugging the coast seemed unlikely and it is more unlikely that it would o!set the strong northward transport. Therefore, our observations do not support a persistent southward #ow in the Taiwan Strait in winter. On the contrary, a northward transport seems to prevail in the Taiwan Strait even in winter, which is consistent with previously observed persistent northward #ow in the southern part of the Strait (Chuang, 1985).
Our observations showed that not only was the TSW transport in winter north-ward but the nutrient #uxes were also much greater than those in summer (Table 2). The high nutrient #uxes were attributed to higher volume transport (Table 2) and higher nutrient concentrations (Table 3). Since the transects (AB and EG) which provided estimates of transports of the TSW did not cover the full width of the Strait (Fig. 1), the shortfall undoubtedly lead to errors in the estimates. The higher transport in winter might be partially due to the winter cruise track (EG) extending closer to the Chinese coast than the summer cruise track (AB).
On the other hand, the relatively high variability of the TSW transports may simply re#ect the sensitivity of the shelf circulation to external forcing and the strong seasonality of the hydrographic conditions (Table 3) resulting from water mass movement. Chao (1991) has demonstrated how wind forcing may alter the #ow pattern on the shelf, which may in turn move riverine e%uents in di!erent directions on the shelf (Beardsley et al., 1985). Chao (1991) and Chao et al. (1995) illustrated the possible #uctuating #ow directions along the southeastern shelf of China that may result from the alternating intensi"cation and relaxation of the northeast monsoon. Therefore, more frequent surveys are called for to better determine the mean #ow and hydrographic conditions on the shelf.
Fig. 18. Nitrate}phosphate relationship in seawaters observed on the winter cruise. The straight line is the regression line for samples (points not shown) from Transect DEF, which represents the normal open sea conditions. The slope corresponds to an N/P ratio of 15.1. The data points clearly demonstrate the existence of`excess nitratea in the shelf water.
4.4. Signixcance of the Kuroshio upwelling
The nutrient inputs from the Kuroshio upwelling, as estimated from this study, are 173}224 Gmol N yr~1, 12}14 Gmol P yr~1 and 250}320 Gmol Si yr~1, which are apparently more important than the riverine contribution of 66 Gmol yr~1 of dis-solved inorganic nitrogen, 0.6 Gmol yr~1 of dissolved phosphate and 120 Gmol yr~1 of dissolved silicate (Zhang, 1996). But the e!ect of riverine nutrients appears to be more immediate to the marine biota, because riverine e%uents stay in the surface layer due to buoyancy. Such is the case in the Changjiang plume, where very high phytoplankton biomass has been observed in a fairly large area (e.g., Gong et al., 1996). However, the Changjiang runo! has an N/P ratio as high as 46}84 (Edmond et al., 1985; Zhang, 1996). Indirect evidence indicated that upward supply of phos-phate from the subsurface water in the Changjiang plume might have the ultimate control over primary productivity (Gong et al., 1996).
Nitrogen-rich but phosphate-poor discharges are commonly found in runo!s to the ECS shelf. Among the eight larger rivers that discharge into the ECS shelf, seven of them show strong depletion in phosphate with N/P ratios greater than 40 (Zhang, 1996). The mean N/P ratio for river runo!s is 105. Consequently, serious N/P imbalance is evident in the ECS shelf water as shown by the wide-spread distribution of `excess nitratea, which is de"ned as the concentration of [nitrate#nitrite] in excess of what may be utilized by marine phytoplankton at the observed concentra-tion of phosphate (Wong et al., 1998). Hence, primary productivity in some areas on the ECS shelf may be phosphorus-limited rather than nitrogen-limited (Wong et al., 1998). In fact, marked excess nitrate was also witnessed during our winter survey (Fig. 18). In the plot of N}P relationship, most shelf waters fell to the right
of the regression line for the Kuroshio waters observed on Transect DEF. Some of the samples from the inner shelf exhibited excess nitrate concentrations as high as 6lM. However, excess nitrate was not evident in the waters studied in summer. This is consistent with observations in the southern ECS reported by Wong et al. (1998).
In contrast to the high N/P ratio found in riverine discharges, the N/P ratios of Kuroshio's nutrient supply (14.0}15.4) are slightly lower than the Red"eld ratio of 16/1. The relative enrichment of phosphate in the Kuroshio nutrient supply is probably an important supplement to the riverine nutrients. The combined nutrient inputs from the Kuroshio and riverine sources yield a mean supply of 265 Gmol N yr~1 and 15 Gmol P yr~1, yielding an N/P ratio of 17.7/1, which is quite close to the Red"eld ratio.
Compared to cross-shelf nutrient #uxes in other western boundary current systems, the observed nitrate #ux from Kuroshio upwelling is quite notable. The nitrate in#ux from the Gulf Stream to the Georgia Bight during upwelling events was estimated to be 5}16 Gmol N yr~1 (Lee et al., 1981; Lee and Atkinson, 1983), which is much smaller than the nitrate in#ux of KSSW intrusion by at least one order of magnitude. The nitrate in#ux from Kuroshio upwelling is similar in strength to the total in#ux of nitrate (220 Gmol N yr~1) to the South and Mid Atlantic Bight from the slope water (Walsh, 1994).
5. Conclusions
Cross-shelf nutrient #uxes of N, P and Si o! northeastern Taiwan and along-shelf nutrient #uxes from the Taiwan Strait to the ECS shelf were successfully calculated from nutrient distributions and phase-averaged #ow "elds obtained in summer (August 1994) and winter (March 1997). The reliability of the estimation was checked by integrating the #uxes over the periphery of a closed triangular study area surveyed on the summer cruise. Although the input and output of water mismatched by 14%, total inputs and outputs of inorganic nutrients, namely nitrate, phosphate and silicate, agreed within 2}5%. The discrepancy in volume transport was attributed to errors in the surface #ow, which contributed little to nutrient transport.
Kuroshio upwelling manifested itself as intrusions of nutrient-laden KSSW on both cruises. The intruding transports were estimated at 0.6}0.8 Sv. Nutrient in#uxes from the Kuroshio upwelling to the shelf were estimated to be 5.5}7.1 kmol N s~1, 0.39}0.46 kmol P s~1 and 7.9}10.1 kmol Si s~1 with the upper and lower limits stand-ing for the summer and winter transports, respectively. The small changes in the nutrient #uxes observed in summer and winter suggest a rather persistent contribu-tion from the Kuroshio upwelling.
The observed nutrient inputs from the Kuroshio upwelling are considerably larger than riverine inputs to the ECS. More importantly, the rich supply of phosphate from the Kuroshio results in an N/P ratio of 18 in the combined nutrient #uxes. Therefore, the Kuroshio nutrient source may play an important role in remedying the N/P imbalance in the shelf water incurred by the injection of phosphate-depleted riverine nutrients.
Out#ows of shelf water were observed on both cruises, con"rming the existence of the cyclonic eddy o! northeastern Taiwan in contrasting seasons. Signi"cant nutrient exports from the shelf (1.7}2.7 kmol N s~1, 0.13}0.22 kmol P s~1 and 2.7}5.3 kmol Si s~1) were observed in the out#owing limb of the cyclonic eddy. This out#ow of nutrients to the oligotrophic surface layer of the Kuroshio may be important in raising its primary productivity as well as new production. A large fraction of the exported nutrients must have originated from the upwelled KSSW.
Besides Kuroshio's contribution, we also observed sizable nutrient #uxes from the Taiwan Strait to the ECS. However, these #uxes changed drastically in the two surveys, suggesting highly variable #ow as well as hydrographic conditions on the shelf. More observations are warranted for a more accurate estimation of the along-shelf nutrient #uxes, which could prove signi"cant to the nutrient budget of the ECS shelf.
Acknowledgements
The cooperation and assistance of the captains and crew of research vessels Ocean
Researcher I and II during the two surveys of this study are deeply appreciated. Special
thanks are due to J.H. Tai, S.H. Lu and M.J. Tsai who helped with shipboard operation and/or data processing. This manuscript has bene"ted from comments of two anonymous reviewers. This work was supported by grants, 88-2611-M002-001 to KKL, 85-2611-M002A-019-K2 to TYT and 85-2611-M019-018-K2 to GCG, from the National Science Council of the Republic of China. It was also supported by the Horn Point Laboratory, University of Maryland Center for Environmental Science during KKL's sabbatical leave in 1997}1998.
References
Beardsley, R.C., Limeburner, R., Yu, H., Cannon, G.A., 1985. Discharge of the Changjiang (Yangtze River) into the East China Sea. Continental Shelf Research 4, 57}76.
Chao, S.-Y., 1991. Circulation of the East China Sea, a numerical study. Journal of Oceanographic Society of Japan 46, 273}295.
Chao, S.-Y., Shaw, P.-T., Wang, J., 1995. Wind relaxation as a possible cause of the South China Sea Warm Current. Journal of Oceanography 51, 111}132.
Chen, C.T.A., Liu, C.T., Pai, S.C., 1995. Variations in oxygen, nutrient and carbonate #uxes of the Kuroshio current. Lamer 33, 161}176.
Chen, Y.L.L., Lu, H.B., Shiah, F.K., Gong, G.C., Liu, K.K., Kanda, J., 1999. New production and f-ratio on the continental shelf of the East China Sea: comparisons between nitrate inputs from the subsurface Kuroshio current and the Changjiang River. Estuarine, Coastal and Shelf Science 48, 59}75. Chern, C.-S., Wang, J., Wang, D.-P., 1990. The exchange of Kuroshio and East China Sea shelf water.
Journal of Geophysical Research 95, 16 017}16 023.
Chuang, W.S., 1985. Dynamics of subtidal #ow in the Taiwan Strait. Journal of Oceanographic Society of Japan 41, 65}72.
Chuang, W.-S., Li, H.-W., Tang, T.Y., Wu, C.-K., 1993. Observations of the Countercurrent on the Inshore side of the Kuroshio northeast of Taiwan. Journal of Oceanography 49, 581}592.
Edmond, J.M., Spivack, A., Grant, B.C., Hu, M.-H., Chen, Z., Chen, S., Zeng, X., 1985. Chemical dynamics of the Changjiang estuary. Continental Shelf Research 4, 17}36.
Fan, K.L., 1979. On upwelling o! the Peng-Hu islands. Acta Oceanographica Taiwanica 9, 50}57. Gong, G.-C., Chen, Y.-L.L., Liu, K.-K., 1996. Chemical hydrography and chlorophyll distribution in the
East China Sea in summer: implications in nutrient dynamics. Continental Shelf Research 16, 1561}1590.
Gong, G.-C., Liu, K.-K., Pai, S.-C., 1995. Prediction of nitrate concentration from two end member mixing in the southern East China Sea. Continental Shelf Research 15, 827}842.
Gong, G.-C., Shiah, F.-K., Liu, K.-K., Chuang, W.-S., Chang, J., 1997. E!ect of Kuroshio intrusion on the chlorophyll distribution in the southern East China sea north of Taiwan during Spring, 1993. Continen-tal Shelf Research 17, 79}94.
Gordon, D.G., Boudreau, P.R., Mann, K.H., Ong, J.E., Silvert, W.L., Smith, S.V., Wattayacorn, G., Wul!, F., Yanagi, T., 1996. LOICZ Biogeochemical Modelling Guidelines. LOICZ Reports and Studies No.5, 96pp.
Hall, J., Smith, S.V., Boudreau, P.R., 1996. Report on the International Workshop on Continental Shelf Fluxes of Carbon, Nitrogen and Phosphorus. LOICZ Reports and Studies NO. 9 (JGOFS Report No. 22), LOICZ Core Project O$ce, Texel, The Netherlands, 50pp.
Hsueh, Y., Chern, C.-S., Wang, J., 1992. The intrusion of the Kuroshio across the continental slope northeast of Taiwan. Journal of Geophysical Research 97, 14 323}14 330.
Joyce, T., 1989. On in-situ `calibrationa of shipboard ADCPs. Journal of Atmospheric and Oceanic Technology 6, 169}172.
Lee, T.N., Atkinson, L.P., 1983. Low-frequency current and temperature variability from Gulf Stream frontal eddies and atmospheric forcing along the southeast U.S. outer continental shelf. Journal of Geophysical Research 88, 4541}4567.
Lee, T.N., Atkinson, L.P., Legeckis, R., 1981. Observation of a Gulf Stream frontal eddy on the Georgia continental shelf, April 1997. Deep-Sea Research 28, 347}378.
Liu, K.-K., Gong, G.-C., Lin, S., Yang, C.-Y., Wei, C.-L., Pai, S.-C., Wu, C.-K., 1992a. The year-round upwelling at the shelf break near the northern tip of Taiwan as evidenced by chemical hydrography. Terrestrial, Atmospheric and Oceanic Sciences 3, 243}275.
Liu, K.-K., Gong, G.-C., Shyu, C.-Z., Pai, S.-C., Wei, C.-L., Chao, S.-Y., 1992b. Response of Kuroshio upwelling to the onset of northeast monsoon in the sea north of Taiwan: observations and a numerical simulation. Journal of Geophysical Research 97, 12 511}12 526.
Liu, K.-K., Iseki, K., Chao, S.-Y., 1999. Continental margin carbon #uxes. In: Hanson, R.B., Ducklow, H., Field, J.G. (Eds.), The Dynamic Ocean Carbon Cycle. Cambridge University Press, Cambridge, pp. 187}239.
Liu, K.-K., Pai, S.-C., Liu, C.-T., 1988. Temperature-nutrient relationships in the Kuroshio and adjacent waters near Taiwan. Acta Oceanographica Taiwanica 21, 1}17.
Nitani, H., 1972. The beginning of the Kuroshio. In: Stommel, H., Yoshida, K. (Eds.), Kuroshio. University of Tokyo Press, Tokyo, pp. 129}156.
Qiu, B., Imasato, N., 1990. A numerical study on the formation of the Kuroshio Counter Current and the Kuroshio Branch Current in the East China Sea. Continental Shelf Research 10, 165}184.
Strickland, J.D.H., Parsons, T.R., 1972. A Practical Handbook of Seawater Analysis. Fisheries Research Board of Canada, Ottawa, 310pp.
Sun, X.-P., 1987. Analysis of the surface path of the Kuroshio in the East China Sea (In Chinese with English abstract). In: Sun, X.-P. (Ed.), Essays on the Investigation of the Kuroshio. China Ocean Press, Beijing, pp. 1}14.
Sverdrup, H.U., Johnson, M.W., Fleming, R.H., 1942. The Oceans. Prentice-Hall, Englewood Cli!s. Tang T.Y., Hsueh, Y., Yang, Y.J., Ma, J.C., 1999. Continental slope #ow northeast of Taiwan. Journal of
Physical Oceanography 29, 1353}1362.
Tang, T.Y., Lee, D.W., 1996. Semi-diurnal tide on the shelf break in northeast of Taiwan. Terrestrial Atmospheric and Oceanic Sciences 7, 133}148.
Walsh, J.J., 1991. Importance of continental margins in the marine biogeochemical cycling of carbon and nitrogen. Nature 350, 53}55.
Walsh, J.J., 1994. Particle export at Cape Hatteras. Deep-Sea Research II 41, 603}628.
Wang, J., Chern, C.-S., 1992. On the distribution of bottom cold waters in Taiwan Strait during summer-time. Lamer 30, 213}221.
Wollast, R., 1991. The coastal organic carbon cycle: #uxes, sources, and sinks. In: Mantoura, R.F.C., Martin, J.-M., Wollast, R. (Eds.), Ocean Margin Processes in Global Change. Wiley, New York, pp. 365}381.
Wollast, R., 1993. Interactions of carbon and nitrogen cycles in the coastal zone. In: Wollast, R., Mackenzie, F.T., Chou, L. (Eds.), Interactions of C, N, P and S Biogeochemical Cycles and Global Change. Springer, Berlin, pp. 195}210.
Wong, G.T.-F., Gong, G.C., Liu, K.-K., Pai, S.C., 1998.`Excess nitratea in the East China Sea. Estuarine Coastal and Shelf Science 46, 411}418.
Wong, G.T.-F., Pai, S.-C., Liu, K.-K., Liu, C.-T., Chen, C.-T.A., 1991. Variability of the chemical hydrogra-phy at the frontal region between the East China Sea and the Kuroshio northeast of Taiwan. Estuarine Coastal and Shelf Science 33, 105}120.
Zhang, J., 1996. Nutrient elements in large Chinese estuaries. Continental Shelf Research 16, 1023}1045.