行政院國家科學委員會專題研究計畫 期中進度報告
質子交換膜燃料電池中熱質傳輸現象對其性能之研究(1/3)
計畫類別: 個別型計畫 計畫編號: NSC92-2212-E-009-011- 執行期間: 92 年 08 月 01 日至 93 年 07 月 31 日 執行單位: 國立交通大學機械工程學系 計畫主持人: 曲新生 報告類型: 精簡報告 處理方式: 本計畫可公開查詢中 華 民 國 93 年 5 月 24 日
質子交換膜燃料電池中熱質傳輸現象對其性能之研究(1/3)
Effects of Heat and Mass Transport Phenomena on the Performance of the
Proton Exchange Membrane Fuel Cell (1/3)
計畫編號:NSC 92-2212-E-009-011
執行期限:92 年 8 月 1 日至 93 年 7 月 31 日
主持人:曲新生 國立交通大學機械系教授
中文摘要 本研究第一年主要針對質子交換膜燃料 電池中薄膜電極裝置內部傳輸現象進行分析 與研究。假設系統為穩態、等溫,且氣體僅 考慮擴散效應,並將氣體擴散層中因電化學 反應產生的液態水,所造成氣體擴散層內部 孔隙度的變化,對整體電池效能的影響,考 慮進數學模式中。本研究引入四種不同孔隙 度分佈的連續函數來進行探討。 研究結果顯示,在較大的表面過電壓下 不同孔隙度分佈對於氧氣質量分率的影響非 常顯著而不可忽視。而對於電池整體效能的 影響,在高表面過電壓時是不可忽視的。此 外,極化曲線的極限電流密度值會隨著氣體 擴散層中孔隙度的增大而遞增,而功率密度 曲線的最高值亦會隨著氣體擴散層中孔隙度 的增大而遞增。因此,在對陰極氣體擴散層 孔隙度的限制條件下,陰極氣體擴散層中孔 隙度越大,所得到電池的效能就越高。 關鍵詞:質子交換膜、燃料電池、孔隙度、 氣體擴散層、電流密度 ABSTRACTThe primary concern of this study deals with the prediction of fuel cell performance with variable porosity of gas diffuser layer owing to the presence of liquid water in the gas diffuser layer. The half-cell model comprising ex- pressions for the oxygen mass fraction distribution in the gas channel, gas diffuser, and catalyst layer, and current density and membrane phase potential in the catalyst layer and membrane derived from oxygen transport equations and Ohm’s law for proton migration
is investigated with the finite-difference scheme numerically.
Four different continuous models of porosity distribution are demonstrated. It is found that the differences of oxygen mass fraction among of Four models become significant as the surface overpotential increases. The limiting current density increases as the porosity of gas diffuser layer is increased. The peak power density occurs at larger current density as the porosity of gas diffuser layer is increased. The higher the porosity of gas diffuser layer is, the better cell performance can be obtained.
Keywords: Proton exchange membrane; Fuel cell; Porosity; Gas diffuser layer; Current density
1. Introduction
Proton exchange membrane fuel cells are considered to be promising and environmentally friendly power sources for both mobile and stationary applications. This because of the attributes of high energy density at low operating temperature (70–90◦C), good per- formance in intermittent operation, quick start-up capability, zero emissions, and minimal problems from component corrosion or electrolyte leakage. Nevertheless, polarization occurs during operation of PEM fuel cells and this influences dramatically both the per- formance and the commercialization of the technology. Accordingly, the development of a theoretical model of the PEM fuel cell, as well as corresponding analyses, are crucial to gain a good understanding of the effect of the operating conditions on the cell potential so that the polarization level can be well controlled. An extensive review of the development of such a
model is provided in [1–3].
Most of the studies mentioned above have assumed for simplicity that the porosity of the GDL is constant. This, however, may not reflect the importance of GDL porosity on fuel cell performance. In fact, the GDL is composed of a thin layer of carbon black mixed with poly- tetrafluoroethylene (PTFE), a carbon paper consisting of rigid carbon fibbers with a diameter of about 10 µm, and a porous structure formed by carbon fibbers with a pore size of 20–50 µm and 70–80% porosity of volume. Any change in the composition or the morphology of the GDL can lead to a substantial influence on fuel cell performance owing to a porosity change [4–7]. In practice, the presence of water generated in the GDL during fuel cell operation can also change the effective porosity, and this change may vary with time and position. Although it has been recognized that the change of content and morphology of the GDL can influence significantly the optimum performance of the fuel cell, relevant studies, especially those with a systematical approach, are still rarely reported in the literature. Accordingly, to consider the effect of the porosity change in terms of the non-uniformity of porosity in GDL on fuel cell performance, it is necessary for work to be done for a precise fuel cell design.
To consider the non-uniformity of the porosity of the GDL, Gurau et al. [8] developed a one-dimensional half-cell model in which the concept of the so-called effective porosity was employed to account for the fact that the pores may be partially filled with liquid water. To simplify the problem so that an analytical solution could be obtained, the authors divided the GDL into a series of parallel layers, in each of which the porosity was considered to be uniform but of a different value. The results showed that the value of the limiting current density decreased when the GDL was flooded with water (a smaller porosity). In the present study, fuel cell performance is investigated by considering the so-called ‘half-cell model’ [8]; special attention is paid to the effect of non-uniform porosity on fuel cell performance in terms of physical parameters such as oxygen consumption, current density, power density,
etc. The non-uniformity of the porosity is accounted for by four different continuous functions of position, each of which has a different averaged value of porosity and a different type of distribution across the GDL.
In the following, the mathematical model and corresponding assumptions are given in Section 2, in which the governing equations and associated boundary conditions for both the oxygen mass fraction and the membrane phase potential are presented. Mathematical models of porosity are also discussed. In Section 3, the computational results are presented to illustrate the effect of non-uniform porosity on the distribution of the oxygen mass fraction across the GDL and the catalyst, as well as on the current density and membrane phase potential across the catalyst layer and the membrane. In Section 4, the performance of the fuel cell in terms of the polarization curve is discussed by again focusing on the effect of porosity. It is also shown that the present numerical results serve well to explain the physical meaning of the performance model proposed previously. Finally, in Section 5, several concluding remarks are made, where the relation between fuel cell performance and the porosity of the GDL is explicitly identified.
2. Mathematical model and assumptions
A schematic of the positive electrode (cathode) side of a PEM fuel cell is shown in Fig. 1. This consists of four different regions, namely, the gas channel, the GDL, the catalyst layer, and the membrane. In the GDL (usually a carbon fiber paper), the morphology varies widely, as determined by the proportions of the constituents. Moreover, in order to consider the presence of the water in the GDL, the effective porosity is taken into account. Since the presence of liquid water is intrinsically non- uniform in the GDL, the porosity of the GDL will be a function of position, instead of a uniform porosity or a piece-wise uniform model as considered by previous studies, see for example [8,9]. In the present paper, four different models of the porosity of the GDL are considered, and are described by four different mathematically continuous functions (Fig. 2).
(1) Model 1 represents constant porosity and the mean porosity of the GDL εd(x) = 0.4 is
considered.
(2) Model 2 is a linear function described by
εd(x) = −1.143 × 10⁻³x + 0.7, which is a
mean porosity equal to 0.523.
(3) Model 3 is a convex exponential function described by εd(x) = exp[−7.5 × 10−6x2 −
2.04 × 10⁻⁴x − 0.357], which is a mean porosity equal to 0.551.
(4) Model 4 is a concave exponential function described by εd(x) = exp[7.5 × 10−6x2 − 5.05
× 10−2x − 0.357], which is a mean porosity
equal to 0.472.
Model 1 of uniform porosity allows a comparison to be made between the present numerical results and the analytical results of Gurau et al. [8]. The other three models are chosen to account for the effective porosity influenced by the presence of water in the GDL during fuel cell operation. The use of an exponential function is primarily due to the convenience of the mathematical derivation. There are no existing experimental data by which the real change of porosity with the presence of water in the GDL can be confirmed. Accordingly, no model is thought to be particularly suitable for a cell under a certain operational condition. The present exponential models are therefore believed to be able to account for real conditions to a certain extent.
The mathematical model of the present system is made on the basis of several assumptions [8]: (a) the model is one- dimensional; (b) the system is isothermal and steady; (c) the air is taken as an ideal gas; (d) the air is fully saturated with water vapor; (e) the membrane is maintained in a fully hydrated condition; (f) oxygen is transported to the catalyst site as a gaseous component; (g) diffusion is the only mode of transport.
2.1.Governing equations of oxygen mass fraction
The species are transported through the gas channel, the GDL and the catalyst layer only by diffusion. The governing equation for the oxygen mass fraction in the gas channel is:
0 2 = dx dY D dx d g O ρ , 0≤x≤Lg (1)
where ρ is the density of mixed gases, DO2the diffusion coefficient of oxygen, Yg the oxygen
mass fraction in the gas channel and x the position. In the GDL, the equation is
[
( )]
2 =0 dx dY D x dx d d O d dρ ε τ , Lg ≤x≤Ld (2) where εd(x) and τd are the porosity function andtortuosity factor of the GDL, respectively, and
Yd is the oxygen mass fraction in the GDL.
Since the GDL is a porous medium, a Bruggeman-type correction [10] can be applied to account for the effective diffusion coefficient. In the catalyst layer, the oxygen is consumed and the governing equation is:
2 2 4 O c O c M F j dx dY D dx d c = ετ ρ , c d x L L ≤ ≤ (3)
where εc and τc are the uniform porosity and
tortuosity factor of the catalyst layer, respectively, Yc is the oxygen mass fraction in
the catalyst layer, F = 96,487 the Faraday constant, MO2 =32 the molecular mass of oxygen, j = 2FκYcexp[2αFη/RT] the cathode
transfer current density, in which κ is the
reaction rate constant, α the transfer coefficient, η the surface overpotential, R = 8.314 is the
universal gas constant, and T is the absolute
temperature.
The boundary conditions at different posi- tions accounted for by the oxygen mass fraction are: Yg = Y0, x = 0 (4a) dx dY D x dx dY D d O d g O2 [ ( )]d 2 τ ε = , x = Lg (4b) Yg = Yd, x = Lg (4c) dx dY D dx dY D x c O c d O d( )]d 2 c 2 [ε τ =ετ , x = Ld (4d) Yd = Yc, x = Ld (4e) 0 = dx dYc , x = Lc (4f)
The density ρ is calculated from the ideal gas law [10], i.e.
RT PM
=
ρ (5) where P is the pressure and M the molecular mass. The molecular mass of the gas mixture is
obtained by: ) / ) 1 (( ) / ( ) / ( 1 2 2 W W W i N O i M Y M Y Y M Y M − − + + = , i = g, d, c (6) where Yw is the water vapor mass fraction, the
subscripts O2, w and N2 mean oxygen, water
vapor and nitrogen, respectively. The mass fraction of the saturated water vapor is given by: PM M P Y Wsat W W = (7)
where the water saturation pressure sat W
P is
calculated from the following expression [11]:
) ln( ) 5459673 . 6 ( 10 14452093 . 0 ) 10 41764768 . 0 ( 048640239 . 0 3914993 . 1 2206 . 5800 ) ln( 3 7 2 4 T T T T T Psat W + × − × + − + − = − − (8) The oxygen diffusion coefficient is a function
of the binary diffusion coefficients, namely:
M M D Y Y M D Y Y D N N O i W W W O W i O 1 )) /( ) 1 (( )) /( ( 1 2 2 2 2 2 − − + − − − = , i = g, d, c (9) The binary diffusion coefficients DO−W
2 and 2
2 N
O
D − are then calculated by using the Slattery and Bird estimation [10]:
where a, b are the constants in the Slattery and Bird estimation for the binary diffusion coefficients and the subscript cr accounts for the critical values.
2.2. Governing equations of membrane phase potential
The membrane phase potential exists in the membrane and the catalyst layer, and accounts for the difference between the surface over- potential and the potential of electronically conductive carbon. In the present system, the averaged surface overpotential across the catalyst layer is considered constant, and is used as a parameter of the model. In the membrane, the governing equation of the phase potential is given as: 0 = Φ dx d dx d σ m , Lc ≤ x ≤ Lm (11)
where σ is the ionic conductivity of the
membrane and Φm the membrane phase
potential in membrane. In the catalyst layer, the equation becomes: j dx d dx d ion c = ετ σ Φ , L d ≤ x ≤ Lc (12)
where ε and τion are the porosity and tortuosity
of the ionomer in the catalyst layer, res- pective1y, Φc the membrane phase potential in
the catalyst layer.
The boundary conditions applied at different positions are: 0 = Φ dx d c , x = Ld (13a) dx d dx d c m ion Φ = Φ τ ε , x = Lc (13b) Φc = Φm, x = Lc (13c) Φm = 0, x = Lm (13d)
In above equations, the membrane ionic con- ductivity σ can be obtained by the empirical expression [12]: − − = T 1 303 1 1268 exp ) 326 . 0 5139 . 0 ( λ σ (14)
where λ is the membrane water content at the interface. A typical function form of λ measured
(10) for Nafion 117 can be found in [12], and has a
value between 14 and 22, as dictated by the temperature of water.
2.3.Governing equations of current density
In the membrane and the catalyst layer, the current density is governed by Ohm’s law for proton migration. The equations are written as:
dx d i c c ion Φ =ετ σ , L d ≤ x ≤ Lc (15) dx d i m m Φ =σ , Lc ≤ x ≤ Lm (16)
where i is the current density; the subscripts c and m mean catalyst layer and membrane, respectively, After obtaining the values of the membrane phase potential, the calculation for
P M M T T P P T T T a D crk crm crk crm k m b m cr k cr m k 2 1 12 5 , , 3 1 , , , , , )) / 1 ( ) / 1 (( ) ( ) ( ) / ( 13 . 10 × + =
current density can be carried out easily from Eqs. (15) and (16) without employing boundary conditions. The above equations are the same as those used by Gurau et al. [8], except that the porosity of the GDL is considered as a function of position, as shown in the beginning of Section 2.
3. Effects of change of porosity
The resulting steady-state, non-linear, di- fferential equations shown in the previous section are solved by a finite difference nu- merical approach. The central differencing scheme is applied, which is a routine procedure and is described many numerical textbooks. Thus, it is not necessary to show explicitly the discretized equations. The base case conditions are the same as those used by Gurau et al. [8]; the reader is referred to their Table 1 for the details.
3.1. Effects on oxygen mass fraction
The effects of porosity change on the oxygen mass fraction across the gas channel and the GDL catalyst layer are examined for three different surface overpotentials, namely, η = 0.25, 0.28 and 0.36. The computational results are given in Fig. 3. Results show that, for the same porosity in the GDL, a higher surface overpotential η leads to a lower oxygen mass fraction in the gas channel. This is due to the fact that a larger surface overpotential, η, corresponds to a more active electrochemical reaction, which leads to an increase in the oxygen consumption in the gas channel. On the other hand, for the same overpotential, a higher averaged porosity of the GDL results in a smaller oxygen mass fraction in the gas channel. This is because a larger porosity of the GDL allows a higher consumption of oxygen in the catalyst layer. For the same reason, when the overpotential is smaller, the consumption of oxygen is smaller and the oxygen consumption is significantly less influenced by the porosity change in the GDL. See, for example, the case of η = 0.25, in which the oxygen mass fractions in the gas channel given by the four different porosity models are virtually the same. Under such circumstances, the electrochemical re- action is dominated by the surface kinetics in
the catalyst layer.
In the GDL, the effect of a continuous change of porosity can be seen. When η = 0.36, for example, the oxygen mass fraction changes with position and follows closely the porosity distribution across the GDL, i.e. as stated previously, the oxygen mass fraction is smaller when the porosity is larger, and vice versa. To some extent, this reflects the fact that the oxygen mass fraction is not uniform across the GDL, especially in the region adjacent to the interface between the GDL and the catalyst layer. It is interesting to note that the difference in oxygen mass fraction due to the porosity change in the GDL decreases as η becomes larger because, for a larger η, the electro- chemical reaction is more active and more oxygen is consumed. When η = 0.36, the electrochemical reaction is so strong that the oxygen is almost depleted completely in the catalyst layer, and differences in the oxygen mass fractions between the four models disappear. For low η, the difference remains because under such circumstances, the electro- chemical reaction is dominated by the surface kinetics, so that less oxygen in the catalyst layer is consumed and the amount of oxygen remaining increases as the porosity decreases. Consequently, the difference becomes more significant as η decreases.
The change in the oxygen mass fraction across the catalyst layer due to the porosity change in the GDL for η = 0.25, 0.28, 0.36 is illustrated in Fig. 4. Note that, because the catalyst layer is very thin and the electro- chemical reaction within the layer prevails, the variation in the oxygen mass fraction across the layer is not at all significant for all three values of η, and cannot be detected on the decimal scale. On a logarithmic scale, however, the variation in the case of η = 0.36 can be clearly seen, i.e. the oxygen mass fraction decreases exponentially from the GDL to the membrane. Although all the variations are very small, the averaged oxygen mass fraction of η = 0.36 is the smallest because the oxygen mass fraction decreases as η increases due to the dominance of the electrochemical reaction. By contrast, the effect of the porosity change in the GDL on the oxygen mass fraction is insignificant for all the
three values of η. This is because virtually all the oxygen has been consumed within the catalyst layer. Thus, the differences between the oxygen mass fractions in the four porosity models are insignificant.
3.2. Effects on current density
The current density distributions in the catalyst–layer–membrane domain of the four porosity models of the GDL when η = 0.25, 0.28, 0.36 are given in Fig. 5. The current density increases significantly in the catalyst layer and approaches to the limiting value in the membrane, which increases with η because a higher overpotential results in a more active electrochemical reaction and thus a higher resultant electronic current. For the same η but different porosity model of the GDL, the current density increases with the averaged porosity. Again, this is obviously due to the fact that a larger porosity in the GDL leads to a larger consumption of oxygen in the catalyst layer, and thus a larger current density is generated. The difference between the highest and lowest current density can be as much as 16% when η = 0.36 and the averaged porosity differs by about 30% (the difference between models 3 and 4). The effect of variable porosity on the current density is not seen at all in Fig. 5. This is because the electronic current occurs only in the catalyst layer, in which the chemical reaction is influenced only by the amount of oxygen transported from the GDL into the catalyst layer, and is independent of the porosity distribution in the GDL.
3.3. Effects on membrane phase potential
The variation of the membrane phase potential Φ in the catalyst–layer–membrane domain for the different porosity models and surface overpotential η = 0.25, 028, 0.36 is illustrated in Fig. 6. The membrane phase potential is lower when the porosity of the GDL is higher. For instance, model 3 is for the highest averaged porosity but the lowest phase potential among the four models considered; whereas model 4 is for the lowest averaged porosity but highest phase potential. The difference between the highest and lowest membrane phase potential is 24% when η =
0.36. A higher porosity in the GDL leads to a larger current density, and thus a higher loss of the membrane phase potential. As a result, model 3 (i.e. highest averaged porosity, lowest membrane phase potential) represents the best cell performance among the four porosity models. For the same physical reasons, when the same model of porosity is considered, the loss of membrane phase potential is larger when the overpotential is larger, which again results in a better performance of the fuel cell.
4.Physical explanation of performance model
Models to describe the steady-state per- formance of the PEM fuel cell have been developed by other workers [11,13–16]. The complexity of the model varies considerably. A typical model proposed by Lee et al. [16] presents a comprehensive empirical relation between voltage and current, i.e.
− − − − = 2 ln ) exp( ln 0 O P P b ni m Ri i b V V (17)
where b, R, m and n are empirical parameters to be determined experimentally. The first term on the right-hand side of Eq. (17) is the open-circuit voltage, usually 1.2V for a hydrogen fuel cell. The remaining four terms on the right-hand side of Eq. (17) account for different kinds of polarization (or irrever- sibilities) of the cell. The second term is called the ‘activation polarization’, caused mainly by the slowness of the reaction on the electrode surface. The third term is the ‘ohmic polarization’ due to the resistance to the flow of ions through the electrolyte. These first three terms are essentially the same for the different models proposed before and can provide a good prediction of the performance when the current density is lower than the limiting value. The last two terms, usually the concentration polarization, are proposed particularly for the performance when the current density is close to the limiting current density and the voltage experiences a rapid drop. Recently, a large effort has been devoted to discussing the mathematical form of the fuel cell performance in this high current density regime. There is, however, a lack of physical justification of the corresponding mathematical expression. For
example, the exponential term of Eq. (17), first proposed by Kim et al. [15], turns out to serve merely as a tool for curve fitting so that the parameters m and n have to be recalculated or any change in the operation conditions. The logarithmic term proposed by Lee et al. [16] is a form of the Nernst equation; it is of a more clear physical sense and accounts for the influence of the oxygen fraction on the voltage drop. Namely, a smaller oxygen mass fraction leads to a larger voltage drop, and this is supported by the present results. Actually, the present computational results indicate that the level of polarization, or the voltage drop, in the high current density regime corresponds largely to the transport of oxygen at the cathode, and this, as shown by the results discussed in the previous section, is related closely to the porosity of the GDL. A limiting case of this scenario is that as soon as the oxygen is consumed completely, the voltage shall drop to zero because the fuel cell is expected to cease functioning due to the lack of oxygen. This occurs when the system approaches the limiting current.
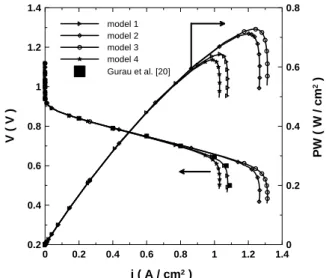
The above scenario is examined in the present analysis by considering the four porosity models and the fuel cell performance is discussed with the aid of polarization curves. For the base case conditions [8], there are various relationships between any two of the following parameters: the external load, the cell voltage, the cell operating current density, the surface overpotential across the cathode catalyst layer. When the surface overpotential is taken as the governing parameter f the system [8], the polarization curve can be described para- metrically by the relation between V(η) and i(η), where V(η) = V0 − ∆Φ(η) − η is the cell voltage
and V0 is the open circuit voltage. The power
density curves also can be described parametrically by the relation between PW(η) and i(η), where PW(η) = V(η) × i(η) is the power density. The curves of polarization and power density corresponding to the four porosity models are shown in Fig. 7, in which a comparison between the polarization curve of the present model 1 and that of the analytical work of Gurau et al. [8] for a uniform porosity
εd(x) = 0.4 is also shown. It is found that the
present numerical results are in excellent agreement with the analytical results of Gurau et al. [8], which confirms that the present numerical approach has been correctly implemented.
The polarization curves consist of three regions of different voltage drop, which is typical for a PEM fuel cell. They are: (i) the region on the left (first sharp drop) corresponds to the activation polarization, accounted for by the second term of Eq. (17); (ii) the region in the middle (decreasing linearly) corresponds to the ohmic polarization, accounted for by the third term of Eq. (17); and (iii) the region on the right (second sharp drop) corresponds to the concentration polarization, accounted for by the last two terms of Eq. (17). Note that, the polarization curves of the four porosity models overlap in the region of low-to-medium current density (the linear regime), while at higher current density close to the limiting value, differences between the four models become significant. This implies that the porosity of the GDL exerts no influence on fuel cell performance when the current density is of a medium or low value, but has a significant when the current density is close to the limiting value. The explanation suggested by the present results is that a larger porosity in the GDL results in a larger oxygen transfer from the gas channel to the catalyst layer, and thus a larger current density is generated. Thus, for example, for the model of the highest porosity, i.e. model 3, the limiting current density is the largest. This finding implies that the polarization curve in the regime close to the limiting current density is governed by the performance of the mass transfer across both the GDL and the catalyst layer, as commonly proposed in previous studies [15–17]. Similar phenomena were also found by Rho et al. [18], who indicated that the drastic drop of voltage is due to the transport limitation of oxygen through the GDL, and a mixed gas with a higher oxygen leads to a higher limiting current density. Rho et al. [19] further pointed out that the departure of cell potential from the linear regime is caused by partial flooding of the GDL, which decreases the oxygen diffusion in the GDL and thus the voltage of the cell.
It is also seen from Fig. 7 that the power density increases virtually linearly with current density. When the latter approaches the limiting value, the power density reaches a maximum and then decreases sharply because of the depletion of oxygen in the catalyst layer. The maximum power density increases and corresponds to a higher current density as the porosity of the GDL is increased. Consequently, a fuel cell can generally deliver better performance when a GDL of larger porosity is used.
5. Concluding remarks
The influence of the porosity of the GDL on the performance of a PEM fuel cell has been investigated. Four porosity models which represents different continuous functions of position are considered so that the porosity influence can be studied in a systematic way. Due to the complexity caused by the porosity models considered, the resultant simultaneous differential equations are solved numerically. Results corresponding to the uniform porosity model are in excellent agreement with the analytical results of Gurau et al. [8], and thus confirm the accuracy of the present analyses. It is also found that the influence of the porosity change in the GDL generally reflects the oxygen transfer from the gas channel to the GDL and catalyst layer, i.e. greater porosity leads to higher consumption of oxygen such that higher current density is generated and a better fuel cell performance is obtained. The present analyses also serve to explain the physical meaning of the performance model in the high current density regime, which has been an issue discussed in many previous publications. In summary, the following conclusions have been drawn.
1. A higher averaged porosity of the GDL results in a smaller oxygen mass fraction in the gas channel because a higher consumption of oxygen in the catalyst layer occurs. Consequently, a fuel cell with a higher surface overpotential, η, may require a GDL of larger porosity so that a larger quantity of oxygen can be provided from the gas channel to the catalyst. This is because,
due to the higher η, more oxygen is required to support the active electrochemical reaction.
2. A continuous change in the porosity of the GDL may be necessary to accommodate the fact that the oxygen mass fraction is not uniform across the GDL, especially in the region adjacent to the interface between the GDL and the catalyst layer. This effect is less significant when η is large because the electrochemical reaction is then more active and more oxygen is consumed, which leads to a smaller difference oxygen in the oxygen mass fraction across the GDL.
3. Across the catalyst layer, the current density increases rapidly from zero at the interface between GDL and catalyst to the limiting value at the interface between catalyst and membrane. The limiting current density increases with η because a higher η leads to a more active electrochemical reaction as well as a higher current. The current density also increases with the averaged porosity of the GDL because of the larger consumption of oxygen in the catalyst layer.
4. A higher porosity in the GDL leads to a larger current density and therefore a higher loss of the membrane phase potential, which also corresponds to a larger overpotential and a better performance of the fuel cell. 5. A change in the porosity of the GDL has
virtually no influence on the polarization level when the current density is at a medium or low value. On the other hand, it has a significant effect on the polarization when the current density is close to the limiting value. This is obviously due to the fact that a larger porosity in the GDL results in a larger oxygen transfer from the gas channel to the catalyst layer, and thus a larger current density is generated. This result supports the fact that the polarization curve in the regime close to the limiting current density is governed by the per- formance of the mass transfer across both the GDL and the catalyst layer, as proposed in previous studies [11, 15–16].
Although the present results indicate coherently that a larger porosity of the GDL
leads to a higher current density, and to some extent a better performance of the fuel cell, a high porosity is accompanied by water flooding in the GDL and this decreases markedly the cell voltage [4]. Besides, as concluded by the present paper, a fuel cell with a higher surface overpotential, η, may require a GDL of greater porosity because more oxygen is necessary to support the active electrochemical reaction. Gurau et al. [8] indicated, however, that a higher η induces a higher ohmic resistance in the catalyst layer, which in turn decreases the fuel cell voltage under moderate current density because ohmic resistance dominates the cell performance.
It is also noted that optimization of the GDL depends not only on porosity morphology, but also on the thickness and the content of the GDL. Giorgi et al. [6] have shown that a change in the content of PTFE of GDL results in a change in porosity, and thus affects the cell performance, although the influence was insignificant in their experiments. They further pointed out that the thickness of the GDL has a more substantial effect, i.e. a thick GDL may decrease the cell performance because the oxygen path is too long; a thin GDL may also decrease the cell performance because of the contact resistance at the GDL| catalyst interface.
In summary, there is an optimum porosity level for the GDL so that the fuel cell has the best performance. This optimization is beyond the scope of present study, which can only be implemented when the whole fuel cell system is considered and a more thorough mathematical model isanalyzed.
References
1.Mosdale, R. and Srinivasan, S., Electrochim. Acta 40 (1995) 413–421.
2.Costamagna, P. and Srinivasan, S., J. Power Sources 102 (2001) 242–252.
3.Costamagna, P. and Srinivasan, S., J. Power Sources 102 (2001) 253–269.
4.Jordan, L.R., Shukla, A.K., Behrsing, T., Avery, N.R., Muddle, B.C. and Forsyth, M., J. Power Sources 86 (2000) 250–254.
5.Jordan, L.R., Shukla, A.K., Behrsing, T., Avery, N.R., Muddle, B.C. and Forsyth, M., J. Appl. Electrochem. 30 (2000) 641–646.
6.Giorgi, L., Antolini, E., Pozio, A. and Passalacqua, E., Electrochim. Acta 43 (1998) 3675–3680.
7.Wohr, M., Bolwin, K., Schnurnberger, W., Fischer, M., Neubrand, W. and Eigenberger, G., Int. J. Hydrogen Ener. 23 (1998) 213–218. 8.Gurau, V., Barbir, F. and Liu, H., J.
Electrochem. Soc. 147 (2000) 2468–2477. 9.Yi, J.S. and Nguyen, T.V., J. Electrochem.
Soc. 146 (1999) 38–45.
10.Bird, R.B., Stewart, W.E. and Lightfoot, E.N., Transport Phenomena, Wiley, New York, 1960.
11.ASHRAE Handbook, Fundamentals, American Society of Heating, Refrigerating and Air-Conditioning Engineers Inc., 1981. 12.Springer, T.E., Zawodzinski, T.A. and
Gottesfeld, S., J. Electrochem. Soc., 138 (1991) 2334–2342.
13.Springer, T.E., Wilson, M.S. and Gottesfeld, S., J. Electrochem. Soc., 140 (1993) 3513–3526.
14.Kim, J., Lee, S.M. and Srinivasan, S., J. Electrochem. Soc., 142 (1995) 2670–2674. 15.Lee, J.H., Lalk, T.R. and Appleby, A.J., J.
Power Sources, 70 (1998) 258–268.
16.Mann, R.F., Amphlett, J.C., Hooper, M.A.I. , Jensen, H.M., Peppley, B.A. and Roberge, P.R., J. Power Sources, 86 (2000) 173–180. 17.Rho, Y.W., Velev, O.A., Kho, Y.T. and
Srinivasan, S., J. Electrochem. Soc., 141 (1994) 2084–2088.
18.Rho, Y.W., Kho, Y.T. and Srinivasan, S., J. Electrochem. Soc. 141 (1994) 2089–2096.
Fig. 1. Physical model and coordinate system Lg Gas diffuser layer Gas Channel Lm Lc Ld Lg x 0 Catalyst layer Membrane
0 70 140 210 280 350 x(µm) 0.3 0.4 0.5 0.6 0.7 εd model 1 model 2 model 3 model 4
Fig. 2. Porosity distribution function of four models considered 0 0.2 0.4 0.6 0.8 1 x / Lc 0 0.2 0.4 0.6 0.8 1 Y / Y 0 model 1 model 2 model 3 model 4 η = 0.25 η = 0.28 η = 0.36 gas channel
gas diffuser layer
catalyst layer
Fig. 3. Effects of porosity change on distribution of oxygen mass fraction across gas channel, GDL and catalyst layer for three different surface overpotentials.
0 0.2 0.4 0.6 0.8 1 ( x- Ld ) / ( Lc - Ld ) Y / Y0 model 1 model 2 model 3 model 4 101 10 0 10-1 10-2 10-3 10-4 10-5 η = 0.25 η = 0.28 η = 0.36
Fig. 4. Variations of oxygen mass fraction in catalyst layer for three different surface overpotentials and four different porosity models.
0 0.2 0.4 0.6 0.8 1 ( x- Ld ) / ( Lm - Ld ) 0 0.2 0.4 0.6 0.8 1 1.2 1.4 i ( A / c m 2 ) model 1 model 2 model 3 model 4 η = 0.25 η = 0.28 η = 0.36 membrane catalyst layer
Fig. 5. Effects of porosity change on distribution of current density across catalyst layer and membrane for three different surface overpotentials.
0 0.2 0.4 0.6 0.8 1 ( x - Ld ) / ( Lm - Ld ) -0.4 -0.3 -0.2 -0.1 0 Φ ( V ) model 1 model 2 model 3 model 4 η = 0.25 η = 0.28 η = 0.36 catalyst layer membrane
Fig. 6. Effects of porosity change on membrane phase potential across catalyst layer and membrane for three different surface overpotentials.
0 0.2 0.4 0.6 0.8 1 1.2 1.4 i ( A / cm2 ) 0.2 0.4 0.6 0.8 1 1.2 1.4 V ( V ) 0 0.2 0.4 0.6 0.8 model 1 model 2 model 3 model 4 Gurau et al. [20] PW ( W / cm 2 )
Fig. 7. Polarization and power density curves corr- esponding to four different porosity models.