行政院國家科學委員會專題研究計畫 成果報告
腦部結構磁振造影影像量化分析與模板建立(2/2)
研究成果報告(完整版)
計 畫 類 別 : 個別型
計 畫 編 號 : NSC 100-2628-E-009-006-
執 行 期 間 : 100 年 08 月 01 日至 101 年 07 月 31 日
執 行 單 位 : 國立交通大學資訊工程學系(所)
計 畫 主 持 人 : 陳永昇
共 同 主 持 人 : 陳麗芬、葉子成、謝仁俊
計畫參與人員: 碩士班研究生-兼任助理人員:莊大賜
碩士班研究生-兼任助理人員:鄭晴懌
博士班研究生-兼任助理人員:詹慧伶
博士班研究生-兼任助理人員:郭柏志
報 告 附 件 : 出席國際會議研究心得報告及發表論文
公 開 資 訊 : 本計畫可公開查詢
中 華 民 國 101 年 12 月 06 日
中 文 摘 要 : 磁振造影是實證醫學非常重要的工具,廣泛應用在臨床醫療
評估與結構性、功能性腦科學研究上。磁振造影除了可提供
放射科醫師審視評估,也可由以體素為基礎之群間比較來得
到結構差異上的量化統計。為了進行腦科學結構上之變異量
化分析,我們必須由腦樣板影像來建構出一個標準定位空
間,以作為腦結構型態計算與統計之比較基準。在此研究計
畫中,我們從 200 位正常受試者的磁振造影影像,經由擷取
腦區組織、修正亮度不均勻性、腦結構空間正規化、與無偏
頗空間計算,建構出一套完整的 T1/GM/WM/CSF/DTI 的腦樣板
影像。並於此套自動化建構腦樣板系統,改善先前對位方法
且套用本團隊新提出的對稱與微分同構演算法,以同時提供
正逆形變場,維持腦樣板對位之一致性。除了研發更新目前
國內外的演算技術來增快此特製化腦樣板建構系統的執行效
率外,同時也採用不同的標準測量方法來評估此系統建構出
的腦樣板影像,驗證本團隊研究成果確實可提高腦樣板影像
與 Talairach 座標系統之對位精確度。
中文關鍵詞: 磁振造影、腦樣板影像、腦結構分析
英 文 摘 要 : Magnetic resonance imaging (MRI) has been widely used
for evaluation of clinical trials as well as
structural and functional brain studies. One unique
characteristic of MR studies is its statistical power
in inferring structural discrepancy between subject
groups in a voxel-wise manner, as compared to the
qualitative evaluation based on visual inspection.
Toward this goal, a standard stereotactic coordinate
system defined by a brain template is indispensable
to providing a common space for brain morphometrics
and statistics. In this work we have constructed
brain templates for inter-/intra-subject comparison
and diagnostics of abnormal anatomical variations as
well as the coordinate mapping method from the
constructed template to the Talairach coordinate
system. The structural templates were constructed
from more than 200 T1/GM/WM/CSF/DTI MR images of
normal subjects and were evaluated according to the
average of structural deformation.
英文關鍵詞: Magnetic resonance imaging, brain template,
structural analysis
1
Quantitative structural analysis and template construction
for brain magnetic resonance images
Abstract—Magnetic resonance imaging (MRI) has been
widely used for evaluation of clinical trials as well as structural and functional brain studies. One unique characteristic of MR studies is its statistical power in inferring structural discrepancy between subject groups in a voxel-wise manner, as compared to the qualitative evaluation based on visual inspection. Toward this goal, a standard stereotactic coordinate system defined by a brain template is indispensable to providing a common space for brain morphometrics and statistics. In this work we have constructed brain templates for inter-/intra-subject comparison and diagnostics of abnormal anatomical variations as well as the coordinate mapping method from the constructed template to the Talairach coordinate system. The structural templates were constructed from more than 200 T1/GM/WM/CSF/DTI MR images of normal subjects and were evaluated according to the average of structural deformation.
Keywords- magnetic resonance imaging, brain template, structural analysis
I. INTRODUCTION
Magnetic resonance imaging (MRI) is a medical imaging technique which can visualize the inside structure of organisms without physical intrusion and commonly used for studying variation in human brain structures and brain tissues. It works with the effect of the interaction between static magnetic field and dynamic electromagnetic field on protons to display the inner structure of human body.The different pulse sequences generated distinct images. For instance, T1-weighted images provide appreciable contrasts
between different soft tissues, such as gray matter (GM), white matter (WM), and cerebrospinalfluid (CSF) in brains. It performs well at defining anatomy. T2-weighted scans are suited to the diagnosis of edema, since they are susceptible to water. Diffusion-weighted images (DWIs) are based on the diffusion effect of water molecules in biological tissues, and manifest the difference between molecular mobility in different gradient directions.
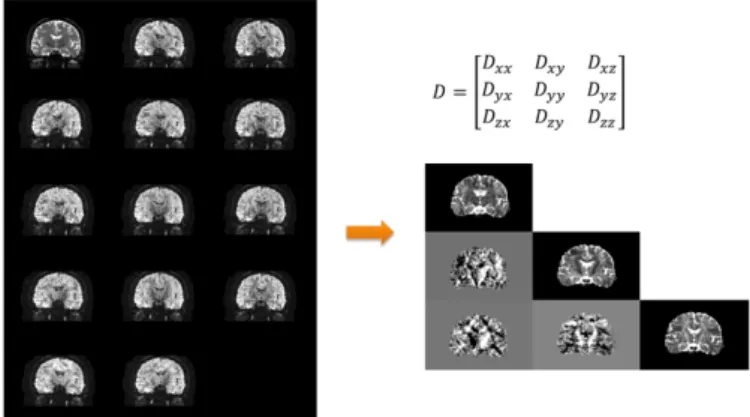
Diffusion tensor magnetic resonance imaging can be derived from DWIs under the assumption that molecular diffusion in tissues acts in Brown motion. Moreover, in DT image, different voxels have different diffusion tensors, which contain the information of fiber directions. A 3×3 symmetric and positive-definite matrix D, called diffusion tensor (DT), can describe the main diffusivities λ1, λ2 , λ3 (with λ1 > λ2
> λ3 ) and the corresponding directions V1, V2, V3 of water
diffusion. Eigen-values ( λ1, λ2 , λ3 ) can be used to calculate several scalar indices, such as relative anisotropy (RA), fractional anisotropy (FA), and volume ratio (VR). FA is the most commonly used index to characterize diffusion anisotropy. The FA is defined as the following equation.
FA 3 1
2
2
2
3
2 2(122232) , where 123 3 .Figure 1: One slice of Diffusion tensor image (right) generated by diffusion-weighted images (left)
The structure of human brain is inherently different for each individual subjects. Different variables also affect the individual structure variability, such as age, gender, disease and ethnicity. To study the structure differences between each individual subjects from MRI, defining a standard information of human brain template space should be provided. Researchers can then normalize each subject images to this space for further analysis or comparison.
MRI data of different subjects should be aligned to the same template space representing for this study group. A proper template space can facilitate the reduction of distortion in the spatial normalization procedure. Since large distortion may bias the analysis results, construction of an unbiased brain template space for the study group is an important issue.
This study aims at two major goals: 1) Construction of a customized brain template representing the subject group; 2) A reliable registration process to construct a customized brain template.
II. RELATED WORKS
In 1988, Talairach atlas [1] was manually labeled based on a 60-year-old French female’s brain, transformed from the Brodmann map. Because the atlas was biased to a specific subject, it cannot well represent all the subjects as a brain template space. On the other hand, the Talairach atlas assumes that the brain structure is symmetric, which is generally not true in real cases. In 1992, Montreal Neurological Institute (MNI) created an average of 305 subjects mapping to the Talairach atlas, as shown in Figure 2. This template created by linearly mapping 305 brain images to the Talairach atlas with 9 parameters and then averaging the transformed images [2][3]. The template called average305 is obviously with low contrast and is blurred in fine structure. To improve this problem, a model was constructed with MRI images of an individual subject, Colin Holmes, who was scanned 27 times over a period of 3 months in 1998 [4]. The average image of these 27 images normalized to average305 template is shown in Figure 2(b). Even though Colin27 provides template image with high contrast, it is biased to this individual subject.
2 In 2001, The ICBM (International Consortium for Brain Mapping) template was accepted as a standard, which was created by MNI with T1 images of 152 normal subjects [5]. The ICBM template collected the data from three different sites. Therefore, MRI data of the subjects were obtained with different scanning parameters. MRI data of each subject was linearly registered to average305 and the averaged template image was called ICBM152. The advantage of this model is that it exhibits better contrast than average305 and also does not bias to specific individual subject.
Recently, some papers have reported that human brain structure could vary with different ages and genders [6]. The ICBM templates provide high resolution T1 images from 19 to 90 years old with equal number of males and females. Construction of study-specific template is essential to further structural analysis.
Many customized template construction algorithms have been proposed recently. The first issue is the selection of initial template image. ICBM template [7] or representative image [8] was adopted by several research groups. In the procedure of spatial normalization, iterative registration can reduce the bias between subject images [9]. Although the affine registration was widely used, but nonlinear registration can largely improve the image contrast of the constructed template.
Figure 2: Template images created from 1992 to 2009 at Montreal Neurological Institute.
III. METHODS
1) Preprocessing of MRI
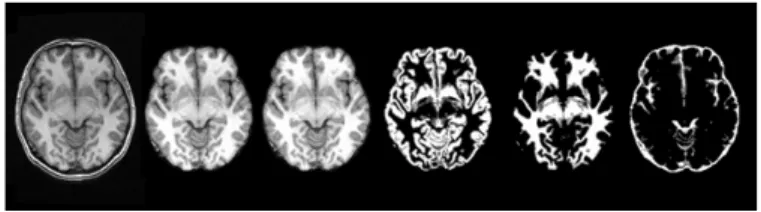
In our study, we used mri_watershed tool [10] developed by FreeSufer, which provided automated tool by Athinoula A. Martinos Center for Biomedical Imaging, to obtain the brain-only area. The MRI brain image should extract the brain-brain-only area because the non-brain parts may bias the registration results.
This study used the technique of parametric Non-uniform intensity Normalization (N3) [11] provided by Dr. A. C. Evans at the Montreal Neurological Institute to reduce the problem of intensity inhomogeneity. Figure 3 shows the results of applying mri_watershed and N3.
The constructed template images can be the whole brain template image, brain-only template image, or brain tissue template image. All images should be in the same stereotactic
space. This study used the tool FAST [12] (FMRIB's Automated Segmentation Tool) version 4.1 developed by University of Oxford to obtain the brain tissue. FAST can be used to segment three brain tissues, as shown in Figure 3. Different types of template image could provide more information.
Figure 3: (From left to right) Raw image, brain-only image, brain-only image with intensity correction, gray matter, white matter and CSF (Cerebrospinal fluid) images.
1-2) Preprocessing of DTI
Preprocessing of MRI includes brain extraction and intensity inhomogeneity correction. We used Brain Extraction Tool (BET) version 2.1 [28, 32] and Bias Field Corrector (BFC) [33] to process the MRI data. DTI preprocessing includes DTI estimation and brain extraction.
Fillard et al., [23] proposed a maximum likelihood strategy with Rician noise model to estimate diffusion tensor. In order to further reduce the influence of the noise, they combined estimation and regularization that results in a maximum a posteriori estimation. In regularization, we use the Log-Euclidean metrics [17] to cancel the swelling effect. Besides, they developed a tool called Medical Image Navigation and Research Tool by INRIA (MedINRIA). We apply it to estimate the diffusion tensor because it can overcome the low signal-to-noise ratio (SNR) in clinical MRI and ensure the positive definiteness of all tensors which are estimated from noise-sensitive DWIs.
Most of the brain extraction methods, such as BET, are designed for the MR images. However, the brain extraction methods based on DWIs/DTI have not been well developed and implemented. To improve of geometrical accuracy of DWIs/DTI, our approach was to extract the brain mask from the MR images and apply the extracted one on DTI instead of extracting brain mask directly from DWIs/DTI.
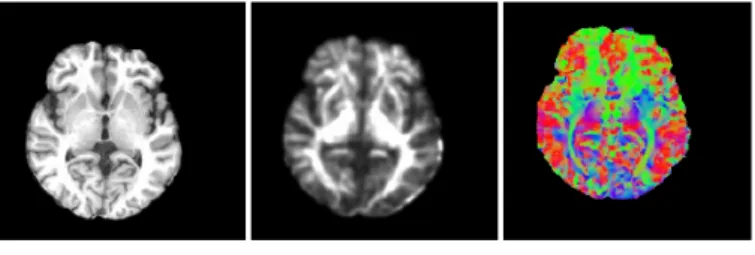
The features extracted from both MR and DT images were organized to an attribute vector shown in Figure 4. The first attribute is the intensity of T1-weighted image (Figure 4(a)). The second one is fractional anisotropy (Figure 4(b)), which is commonly used in DTI non- rigid registration. The last one is first eigenvector V1 (Figure 4(c)) extracted from DTI, it represents the principal direction of water diffusion in brain fibers. The attribute vector of each voxel can be written as follows:
A(v)
a
T1 intensity(v), a
DTI FA(v), a
DTI V1(v)
3 Figure 4: One slice in (a) MRI, (b) FA image (c) V1 image (where the colors red, green, and blue represent diffusion in the x, y, and z axes respectively).
2) Registration of MRI
The image registration based on each voxel of subject images. The registration process includes two major parts: global affine normalization TA and nonlinear transformation TN. The effect of different registration method shows in Figure 5. For each voxel transformation T: p→q, the following equation present the relation:
q = TA(p) + TN (TA (p)) (1)
Affine normalization aligns the global shape between the source image and target image, including rotation, scaling, shifting and shearing. The transformation could use a transform matrix M to present the mapping relation. The relation is shown in (2). Each voxel p of source image maps to the corresponding q in target image. In this study, FSL developed FMRIB’s Linear Image Registration Tool (FLIRT) [13] which be used in the procedure.
q = TA(p) = M × p (2)
Nonlinear registration solves the problem in inter-brain tissue alignment after we align the global shape of image. The spatial mapping is based on a set of Wendland’s radial basis functions (RBFs) with different levels of support extents [14]. The RBFs model the deformation field D of the brain image from source image to target image. The following equation (3) shows the relation of mapping.
q = TN (TA(p)) = p + D(p) (3)
Figure 5: Registration result between two images: (a) Source image (b) Target image (c) Affine registration from source to target. (d) Affine
and nonlinear registration from source to target.
2-2) Registration of DTI
Affine transformation is a preliminary registration. It
aligns the global shape from source image to target image. We used FMRIB’s Linear Image Registration Tool (FLIRT).
Non-rigid registration provides further alignment in local structure. Liu J.X et al., [14] proposed Brain Image Registration Tools (BIRT) is used. Besides, We modified the similarity criterion in BIRT and used a symmetric and diffeomorpic non-rigid registration algorithm to efficiently utilize the features selected from DTI and MRI. The new similarity evaluation function (eq-2.1) between the voxel u in the target image It and the voxel v in the source image Is can be expressed as: S I
t
u, Is
v
wi simi
At
u, As(v)
i
(2.1) simi
At u, As(v)
SCR
ati, asi
ati u a s i v , i intensity, FA ,i V1 (2.2)At(u) and As(v) are the attribute vectors at voxel u in target image and at voxel v in source image, respectively. When the attribute index (i) equals intensity or FA, we calculated a correlation ratio between target image and source image; else if equals V1, we considered the modulus of inner product between two principal direction of voxel u and v. The weight wi controls the influence of each attribute and
decided by the number of each attribute. In addition, DTI features (FA and V1) are calculated only in white matter region(FA >= 0:3) so that we can improve the accuracy for MRI non-rigid registration in white matter and maintain the accuracy in other tissues. The similarity functions of each attribute in eq-2.2 have been normalized to the range of zero to one. Which means the larger value indicates higher image similarity.
The correlation ratio (Figure 6) is an efficiency and accuracy measurement for image registration. It is robust to different intensity contrast, inhomogeneity and noise [13, 32]. We calculated the correlation ratio of image similarity in the following equation:
, 1 ∑
The range of attribute (intensity or FA) in target image was divided into NB bins. Voxels in the same bin was gathered
into a set Xj , which contains Nj voxels. We collected their
corresponding voxels in source image at set Xj , and calculated the variance from attributes of these voxels. Let N be the number of voxels in the overlapping region Ω between source and target image. If the variance ratio of each set Xj to total
volume is small, the source image and target image are well aligned.
4 Figure 6: Correlation ratio
3) Procedure of creating template
Figure 7 shows the brief procedure of creating customized template. This study uses T1 images as input images. All images had been preprocessed by the step described in the preprocessing method in this chapter.
This study aims to construct a customized template space and template image. A representative image which provides the template space information is our purpose. In the beginning, initial reference image R is randomly selected from the subject group. Without using averaging subject group images as initial image, the individual MRI scan image provide better contrasting information and clearer brain anatomical local structures. This could make registration parameters and cost functions more precise. Using automatic registration method, this reference image could optimize to become a representative image.
The creating procedure of registration divides into affine registration part and nonlinear registration part. At first, the reference image maps to each subject images in affine registration, which solves the problem of global shape difference. The registration procedure will obtain n transform matrices Mji where j from 1 to n which including the difference information between reference image and each n subjects. As we want to optimize the reference image as a representative image of subject group, this purpose could implement by applying the average transform matrix M on the reference image to update the reference image RA (representative image). This concept is shown in Figure 8 in iterative steps and also could be used in nonlinear registration.
The updating representative image from the affine iterative registration could be the initial as the non-rigid registration. The non-rigid registration deformation field, Di
handles the inter-brain alignment. The nonlinear iterative registration procedure is similar to affine registration. The final representative image RD will be obtained after apply two
iterative registration procedure shown in Figure 7.
Figure 7: The brief procedure of creating customized brain template.
Finally, all the group images register to the reference images following affine and non-rigid registration. The template will be done by the averaging register images.
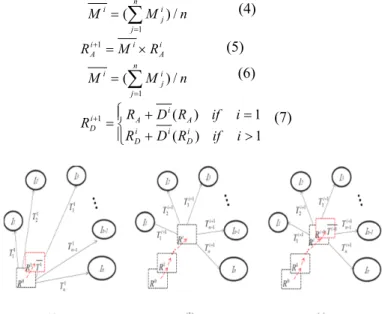
Although the template will bias to the chosen one, iterative registration to construct the template should reduce the influence of the initial reference image. Fig. 2 shows the concept of iterative registration. Equation (4) and (5) present the affine and non-rigid registration in iterations. Ri represents
the i time created representative reference image. Since the information from the individual image is better than averaging image, the method should optimize the reference image rather than the averaging image. The iterative time could be defined under a threshold. n M M n j i j i ( )/ 1
(4) i A i i A M R R1 (5) n M M n j i j i ( )/ 1
(6) 1 ) ( 1 ) ( 1 i if R D R i if R D R R i D i i D A i A i D (7) Figure 8: This figure shows the concept of iterative registration. T represents affine matrix if the procedure using affine registration. Otherwise, T represents deformation field when the registration is nonlinear registration. (a) Initial registration. In affine registration, R0represents randomly select image from subject group. In nonlinear registration, R0 represent the representative image obtain from affine
iterative registration. (b) Update the representative image to Ri after i
iterations. (c) The i-th time representative image Ri+1 is updated by
Ti+1, average from T 1i to Tni.
5
3-2) Procedure of creating DTI template
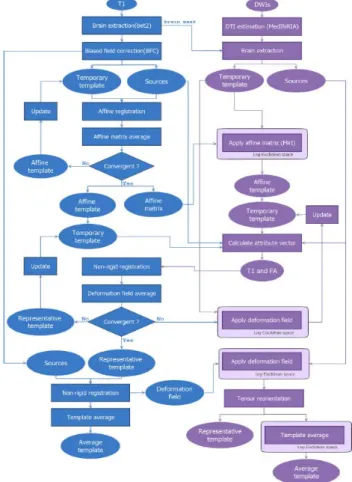
We modified the procedure of MRI template construction proposed by Lee [15] to construct new MRI and DTI templates. Figure 9 and 10 illustrates our procedures for MR/DT template construction. The construction of DTI template is similar to MRI and we utilized the affine matrix from MRI to co-register the initial DTI template into the same template space. Subsequently, preprocessed images and affine templates of MRI/DTI were organized to an attribute vector, which is a new similarity function for non-rigid registration.
Figure 9: Brief flowchart of the proposed methods for MR/DT template construction
Figure 10: Detailed flowchart of the proposed methods for MR/DT template construction.
However, diffusion tensor contains direction of water diffusion in tissues. In affine transformation, we only change position of voxels in DTI. Therefore, we have to apply DTI reorientation to maintain the consistency of anatomical structure. Alexander etal.,[16] developed a preservation of principal direction (PPD) method to estimate local rotation matrices from affine transformation or higher order transformations(non-rigid transformation). The aim of PPD is to preserve the principal direction and a plane spanned by the principal and second direction of a tensor after transformation. The following is the algorithm of PPD:
Step 1: Find the first eigenvector e1 and the second eigenvector e2 of a diffusion tensor.
Step 2: Compute the unit vectors n1 and n2 from transformed
e1 and e2, which were applied by transformation
matrix, F, respectively.
Step 3: Rotate e1 to n1 with rotation matrix, R1, and rotate e2
with R1 as well.
Step 4: Find a projection, P(n2), of n2 onto a plane. The plane
is spanned by n1 and n2, and it is perpendicular to n1.
Besides, R1e2 (rotate e2 with R1) already lies in this
plane.
Step 5: Calculate the rotation matrix, R2, which maps R1e2
to P(n2).
Step 6: Set the local rotation matrix R = R2R1 and reorient a
tensor D by: D’
=RDRT.
Constructing average template of DTI is calculated in Log-Euclidean space [17], which can avoid the defects of Euclidean calculus, such as tensor swelling effect and non-positive eigenvalues. Moreover, tensors can be thought as vectors in this space. So the operations of vector can be used directly on tensors in Log-Euclidean space. In other words, calculating the logarithm of a tensor matrix means changing a tensor into Log-Euclidean space. We can efficiently obtain the logarithm of a tensor matrix from eq3-1 to eq3-3 and approach eq3-4 to construct the Average Template of DTI.
Where M is a diagonal matrix with eigenvalues and R represents the rotation matrix with eigenvectors. They were factored from spectral decomposition of tensor D. In contrast, changing a tensor back into Euclidean space, that is, calculating the matrix exponential of a tensor also can be obtained efficiently by using exponential substituted for logarithm at step 2. Besides, let N be the number of registered subjects and x be a voxel of tensor D in eq3-4.
3_1 0 0 0 0 0 0 log 0 0 0 log 0 0 0 log 3_2 log 3_3 ∑ log 3_4
6
4) Interpolation
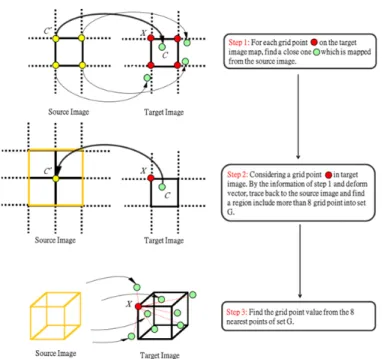
As the averaged deformation field D is obtained, we will apply D on the representative image and get the new representative image. The deformation filed is not a grid point to grid point mapping. In other words, each grid point of source image may not map to a grid point in the target image as in Figure 11 step 1. Because of demand in creating the new representative image, using method of interpolation is needed. The following paragraphs will introduce our interpolation method.
The interpolation steps are shown in Figure 11. To obtain the value of each grid point in target image, the concept of our interpolation method is used intensity and distance value of eight nearest neighbors. How to find eight neighbors in a fast way becomes an issue to study.
Consider a grid point X in target image and find a close location C deforms from a grid point C’ of source image. Let
the grid point C’ as center, find a cube include more than eight
grid point. The size of the cube depends on the number of grid points in this region. After found a set G of grid points, G’ record the coordinate location form the deformation field in target image.
From set G’, select eight nearest neighbors and calculate the distance as weighted in equation (8).
(8)
v(X,Y,Z): value of location (X,Y,Z)
d(xi,yi,zi): distance between (xi,yi,zi) and (X,Y,Z)
Figure 11: This figure shows the procedure of creating image by deformation field in interpolation. Yellow point is grid point in source image. Green point is mapping location in target image from the source image of grid point. Red point is grid point in target image. (
4-2) Interpolation of DTI
Interpolation of tensors is also calculated in Log-Euclidean space. The properties of tensors can be adequately maintained in Log-Euclidean space compared to inEuclidean space [17]. The interpolation with Log-Euclidean framework can be expressed as the following equation, where wi is the
trilinear weights.
log
5) Removing outlier
The construction procedure input all needed subject images to create the template space and template image. If one of the input image with great deform form representative image to this one, the result template may affect by this outlier especially when the subject numbers are not large enough. To ensure the template could not only represent the subject group but also be in a standard coordinate system, the procedure should add criteria to remove the outlier of subject image.
In this study, the outliers consider transformation effect from scaling and shearing in affine transform. Translation and rotation align two images to the same coordinate space. Deformation of nonlinear registration reduces the brain tissue structure difference. The last two effects are not stand as outlier generally. Both scaling and shearing include 3 directions: Scale with x-axis, y-axis and z-axis, shear parallel to the x-axis by variable of y and z and shear parallel to the y-axis by variable of z (Figure 12(a) from left to right).
There are total six variables considered as outlier factors. Each registration between subject and representative image will obtain those six variables. Compute average and standard deviation for six outlier factors in each iteration time of affine registration. If any factors of the six variables out of range: average ± five times standard deviation in second and third iteration time, the subject will set as outlier. If any factors out of range: average ± four times standard deviation in fourth and fifth iteration time, the subject will also set as outlier. Finally, the criteria will set outlier which variable of factor is out of range: average ± three times standard deviation above sixth iteration time. The range setting also shows in Figure 12(b).
Figure 12: (a) Considering an identity cube in 3-d coordinate. Scale in 3 different directions (left 3 images for x-axis, y-axis and z-axis). Shear in x-axis by y, shear in x-axis by z and shear in y-axis by z. (b) The outlier criteria. avg: average variable from outlier factors. sd: standard deviation of variable from outlier factors.
i i i i i i i i i i i v x y z z y x d z y x d Z Y X v ( , , ) ) , , ( ) , , ( ) , , ( (b) (a)7
6) Evaluation
The template evaluation could be based on image intensity and the deform vector magnitude which is obtained from registration process.
Considering the image intensity value, if the brain template is well-represent for the whole subject group, the close voxel coordinate between subject image in template space and representative image should have similar intensity value. This study uses standard deviation and correlation to evaluation the performance of our template.
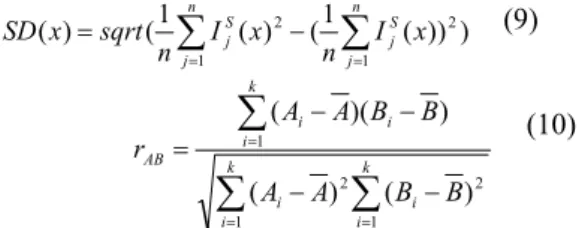
At first, the whole subject images transform into our creating template. For measure of standard deviation, compute standard deviation of intensity at location x in template space for all subject mapping to template space (As equation (9)). Small standard deviation represent all image transform to this template space in small difference. For measure of correlation, compute correlation between subject image in template space and template image (As equation (10), A and B are two images, k is the voxel number of image). If the correlation closer to one, the difference between this two images are smaller. In other words, the template image is representative as the subject image. ) ) ) ( 1 ( ) ( 1 ( ) ( 2 1 1 2
n j S j n j S j x n I x I n sqrt x SD (9)
k i i k i i i k i i AB B B A A B B A A r 1 2 1 2 1 ) ( ) ( ) ( ) ( (10)Study of the displacement information stored in the deformation field is also another evaluation method. The deformation field was obtained by nonlinear registration from subject image to the template image. We could compute the average deform vector’s magnitude to observe the difference between subject image and template image. Lower value stands for well-present template.
6-2) Evaluation Method of DTI
Basser and Pajevic [19] developed a measure of tensor overlap based on eigenvalue-eigenvector pairs. If two different tensors are perfect match, the value of OVL is close to one. Otherwise, the value is close to zero. The volume R in the average overlap equation (eq6-2) represents the region of white matter or brain region, and usually used to evaluate the accuracy of DTI registration [25, 29]. The OVL and averaged OVL are given by:
∑ ∙ 2 ∑ 6_1 1 | | ∑ ∙ ∑ ∈ 6_2 Sanchez Castro et al., [20] utilized diffusion tensor images to evaluate MRI registration. They co-registered DTI with the transformation of MRI, and used the standard deviation, called error, to check the consistency of tensor after registration. They also performed operations on tensor in Log-Euclidean framework. The
error can be computed as followed:
1 log
1
In our study, the error is computed for both MRI and DTI. means the Average Template of DTI. Similarly, the registered subjects from MRI averaged on Euclidean framework create the Average Template of MRI. To sum up, the error not only represents the discrepancy between our Average Template and registered subjects, but also evaluates the registration method we proposed.
IV. RESULTS
1) Constructed template of MRI only
The MRI scans are obtained from Integrated Brain Research Unit (IBRU) of Taipei Veterans General Hospital. The subject group includes 78 males and 138 females in total 216 normal subjects of T1 images. Age range is 14 to 69. The whole procedure is created based on the T1 images from these data base. Figure 14 and 15 show representative image and template image in different brain tissues and different views.
Figure 13: Representative image: Brain-only, grey matter, white matter and CSF (from left to right) in horizontal, coronal and sagittal view (up to down).
Figure 14: Template image: Brain-only, grey matter, white matter and CSF (from left to right) in horizontal, coronal and sagittal view (up to down).
Representative image is also the constructed template space. All subject images without outliers map to this template space and average to obtain the template image. Both images provide information for the subject groups.
8 The representative image converge to a stable statement can represent the whole subject group images. As the image is stable, the intensity variable per voxel will not change a lot. We perform the average intensity difference from representative image between this time of iteration in Figure 15. The curve will be steady as increasing the iteration time, unless disturbed by outlier removing.
Figure 15: Average intensity difference per voxel time after time of iteration for representative image (left) Affine iterative registration. (right) Nonlinear iterative registration.
2) Constructed template of DTI and MRI
Figure 16 and 17 show the Representative and Average Template constructed by the new procedure in our study. The DTI template is a six volumes image. For visualization, we used FSLView [27]. Although Representative Template may bias to the random initial subject, it supply a clearly detail structure to represent the group.
Figure 16: Representative Template of (a) MRI (b) DTI.
The first eigenvector (V1) is modulated by FA to represent the principal diffusion direction and its magnitude. The red, green, blue color represents the diffusion in x, y, and z axis respectively.
Figure 17: Average Template of (a) MRI (b) Affine DTI (c) DTI. The first eigenvector (V1) is modulated by FA to represent the principal diffusion direction and its magnitude.
3) Outliers from subject group
In sixth iteration time of affine registration, our study found four outliers of subject image and one in seventh iterations. Two outlier images are shown in Figure 18. All outlier remove cause of a transform coefficient from affine matrix is out of the range for three times of standard deviation, which criteria stated in III.(5) .
Figure 18: (Left) Removed by outlier factor of shear in x-axis by y variable. (Right) Removed by outlier factor of scale in y-axis.
4) Evaluate the template performance of MRI only
By the intensity based of image, Table 1 and Figure 19 show the result of average correlation between template image and warped image of subjects. The template image was chosen by the representative image, average template image and ICBM template image. The result shows that template image have the highest correlation with the subjects.
Figure 19: First column: Reference representative image. Second column: Reference average template image. Third column: Reference ICBM template.
Figure 20 shoes the intensity standard deviation per voxel for the warped image of subjects. Our study compares the result of warping to ICBM template space and our constructed template space. The boundary of the brain image had more variation than the center of brain area. This result also shows that our template is better as being a transformation template.
Figure 20: The constructed template (left) compared with ICBM template (right) in intensity standard deviation for each voxel.
Considering deformation filed in nonlinear registration, Table 2 shows the average deformed magnitude and the standard deviation in millimeter. It also compares ICBM template and our template space. The subjects have lower average deformed magnitude to our template than ICBM template.
Our template ICBM template
9 Table 2: The average in deformation vector field (mean ± SD) in X, Y and Z dimension compare with different template.
5) Evaluate the template performance of DTI and MRI
In order to confirm the performance for our attribute vector, we considered the mean error of MRI feature (T1), DTI feature (FA) and the attribute vector (T1+FA) within the whole brain and white matter.
In the whole brain region, the best reductions of DTI error (Table 3.1) is given by T1+FA feature with 6.65%_2.48%. The second one is FA feature and the worst case is T1 feature. Furthermore, Table 3.3 shows that T1+FA feature also obtains the best reduction of MRI error by 11.19%_12.9%, and the second one is T1 feature by 10.62%_11.25% .
Table 3.1: Mean DTI error in whole brain
Table 3.2: Mean DTI error in white matter
Table 3.3: Mean MRI error in whole brain
Table 3.4: Mean MRI error in white matter
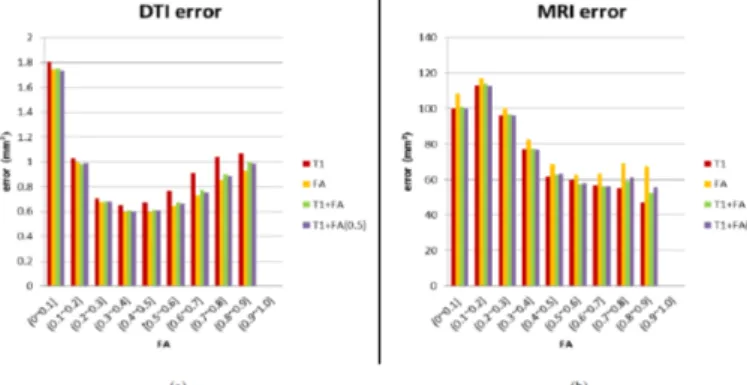
Let us examine OVL and errors in detail shown in Figure 21 and Figure 22. These evaluation methods were partitioned into ten part using FA image, which was derived from DTI Average Template. Figure 22(a) shows that FA feature provides the best error reduction in major divisions. However, T1+FA feature is better than FA feature when FA being the range of 0~0.1 and 0.1~0.2. Figure 22(b) illustrates that T1 feature supplies the lowest MRI error in most partitions. Nevertheless, T1+FA feature offered lesser error than T1 feature when FA=0.1~0.2, 0.3~0.4, 0.5~0.6 and 0.6~0.7. Although T1+FA
feature was not perfect in each detail segment, it provided an acceptable result.
The results demonstrate that T1 and FA can give a excellent remedy for each other when they are simultaneously employed in non-rigid registration. Accordingly to this, we found out T1+FA feature supplies the best alignment for both MRI and DTI non-rigid registration.
Figure 21: Mean OVL with different features
Figure 22: (a) Mean DTI error (b) Mean MRI error
V. DISCUSSIONS
1) The Midterm Project Part
The construction procedure includes two major parts of iterative registration: affine registration and nonlinear registration. Both iterations transform all subject images to a representative image and optimized this representative image rather than an average template image. The representative image provides higher contrast and local area information. This could let the transform value more accurate and also update the representative image precisely. But when researchers attempt to use the template space as a comparative standard coordinate, a representative image may not be the best choice rather than an average template image. An average template image includes more subject information than a representative image without bias to a specific brain image structure. In our result of Table 1, the subjects mapping to the representative image have higher average correlation. In our study, we have created both representative template space image and average template image just in case.
In addition, the procedure provides outlier criteria in order to construct an unbiased template. As the creating template procedure is suitable for any given subject groups, the representative template image is easy being bias by an extreme
Mean average in deformation vector field (mean ± SD)(mm) Subject in group Subject out of group Our Constructed template Y: -0.24 ± 1.73 X: 0.06 ± 1.71 Z: 0.48 ± 2.28 X: 0.60 ± 9.26 Y: -1.20 ± 10.96 Z: 2.90 ± 8.70 ICBM X: 37.42 ± 2.33 Y: 14.28 ± 5.53 Z: 21.09 ± 8.70 X: 24.04 ± 9.44 Y: 8.08 ± 5.63 Z: 15.21 ± 7.66
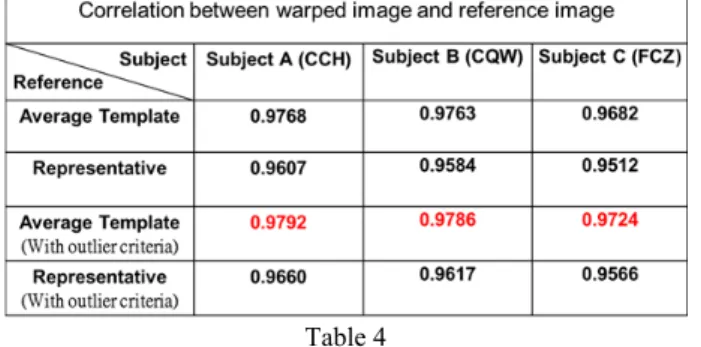
10 outlier if the subject number is not quite enough. Figure 23 shows more effects in affine registration steps. The upper row of subject has large skew (larger than three times of standard deviation) in x-direction following by the value of y variable. The middle row shows the subject with large x-direction skew followed by z variable. The subject in the bottom row deform in large y-direction. All of these subjects are normal subjects, but the large deforms could affect the average deform used in creating representative image. Removing these subject could be more precise is shown in Table 4. The correlation is larger when the template without outlier.
Figure 23: (a) Three different outliers in raw image space. (b) After transform into template space by affine matrix. (c) Overlay image of (b) onto image of (a).
Table 4
From the result of evaluation, the template space construct in this study is more appropriate than ICBM template. As compare with image intensity, the subject wrap to our template space in smaller deforms and all warped subject images are in closer image space.
Our template creating procedure is based on subject group. Generally, ICBM template was constructed from Caucasian and some studies had also provided some automatic creating method of Chinese brain template. But the registration method with only 12 parameters and the subject number was not large enough. The procedure in this study also does not rely on any general template space as initial. A random initial reference image set as the representative template space and there are no large differences for different initial reference (Figure 24). More descriptions in effects of different initial reference should be evaluated.
Figure 24: A and B are two different initial reference image. Rightest column shows the average deform in 3-direction in millimeter.
2) The Final Project Part
Table 5 lists the comparison between our procedure and other DTI template constructions [36] [30] [35] [24]. Although the concept of Log-Euclidean metrics has been published in 2006 [17], it did not commonly used in DTI template construction. One explanation for that is many theories of estimation methods are based on high SNR and large number of gradient directions. However, in clinical, the number of gradient directions is limited and noise-sensitive DWIs is low SNR. These properties of DWIs may cause zero or negative eigenvalues when estimating tensors by those methods. Non-positive eigenvalues cannot be explained in biological tissues and accepted by logarithmic transformation, an essential step to transform a tensor onto Log-Euclidean space. In this study, we used Med-INRIA [23] to confirm the positive definiteness of all tensors.
However, the good property of tensors cannot always maintain in tensor calculus. When we calculate tensors in Euclidean space, it may create non-positive eigenvalues and occur tensor swelling effect, which means the determinant of a calculated tensor in Euclidean space will be larger than its original determinant. In order to avoid that problem, we used Log-Euclidean framework to calculate the average and the interpolation of tensors. Besides, we executed the DTI reorientation in Euclidean framework because the PPD algorithm only affects the direction of tensor rather than its magnitude.
Table 5: Comparison with different DTI template construction
11
VI. FUTURE WORKS
As the constructed template has defined in accurate procedure, studying on different subject groups in size or specific character will be the future work should be done. For example, males and females template, specific level of age templates are also could be constructed in our procedure. Comparison of different group of template may find some conclusions for the brain structure difference.
The comparison between general template space and our constructed template space need to be evaluated more. Rather than intensity based and replacement base method, use more methods to evaluate our template space.
VII. CONCLUSIONS
Constructing a proper template would be helpful in MRI brain images analysis. The human brain structure will be changed in different factors including disease. An accurate and precise creating procedure can help the brain template well-representative. Researchers and doctors could simply compare the different in brain structure by the brain template image. The construct procedure algorithm in this study could be used on different specific subject groups creating customized template. The well-represent template space can be used for precise analysis on brain image variation. In this study, we present a procedure to construct MRI and DTI template. Moreover, we improved the accuracy of non-rigid registration by using T1 and DTI features simultaneously.
REFERENCES
[1] J. Talairach and P. Tournoux (1988). Co-Planar Stereotaxic Atlas of a Human Brain: 3-Dimensional Proprotional System: an Approach to Cerebral Imaging. Thieme Medical Publishers.
[2] Evans, A.C., Collins, D.L., Mills, S.R., Brown, E.D., Kelly, R.L., Peters, T.M. (1993). 3D statistical neuroanatomical models from 305 MRI volumes. Proc. IEEE-Nucl. Sci. Symp. Med. Imaging Conf. 1813–1817.
[3] Mazziotta, J.C., Toga, A.W., Evans, A., Fox, P., Lancaster, J. (1995). A probabilistic atlas of the human brain: theory and rationale for its development. The International Consortium for Brain Mapping (ICBM). NeuroImage 2(2):89-101.
[4] C.J. Holmes, R. Hoge, L. Collins, R. Woods, A.W. Toga, and A.C. Evans (1998). Enhancement of MR images using registration for signal averaging. Journal of computer assisted tomography, 22(2):324–333.
[5] John Mazziotta, Arthur Toga, and et al (2001). A probabilistic atlas and reference system for the human brain: International consortium for brain mapping (ICBM). Philosophical Transactions of the Royal Society B: Biological Sciences, 356(1412):1293–1322.
[6] Good, C.D., Johnsrude, I., Ashburner, J., Henson, R.N., Friston, K.J., Frackowiak, R.S., (2001). Cerebral asymmetry and the effects of sex and handedness on brain structure: a voxel-based morphometric analysis of 465 normal adult human brains. NeuroImage 14: 685-700.
[7] K. Kazemi, H.A. Moghaddam, R. Grebe, C. Gondry-Jouet, F. Wallois. (2007) A neonatal atlas template for spatial normalization of whole-brain magnetic resonance images of newborns: Preliminary results. NeuroImage 37(2): 463-473.
[8] V. Fonova, A.C. Evansa, K. Botteronb, C.R. Almlic, R.C. McKinstrye, D.L. Collinsa, Brain Development Cooperative Group (2011). Unbiased average age-appropriate atlases for pediatric studies. NeuroImage 54(1): 313-327. [9] B.B. Avants, P. Yushkevich, J. Pluta, D. Minkof, M. Korczykowski,
J.Detre, J. C. Gee. (2010) The optimal template effect in hippocampus studies of diseased populations. NeuroImage 49: 2457-2466.
[10] F. Se´gonne, A.M. Dale, E. Busa, M. Glessner,D. Salat,H.K. Hahn and B. Fischl (2004). A hybrid approach to the skull stripping problem in MRI. NeuroImage 22(3):1060-1075.
[11] J. G. Sled, A. P. Zijdenbos, and A. C. Evans (1998). A nonparametric method for automatic correction of intensitynonuniformity in MRIi data. Medical Imaging, IEEE Transactions on, 17(1):87–97.
[12] Y. Zhang, M. Brady, and S. Smith (2001). Segmentation of brain MR images through a hidden Markov random field model and the expectation maximization algorithm. IEEE Trans. on Medical Imaging, 20(1):45-57. [13] M. Jenkinson and S.M. Smith (2001). A global optimisation method for
robust affine registration of brain images. Medical Image Analysis, 5(2):143-156.
[14] Liu, J.X. Chen, Y.S., Chen, L.F. (2009). Fast and Accurate Registration Techniques for Affine and Nonrigid Alignment of MR Brain Images. Annals of Biomedical Engineering 38(1):138-157.
[15] 李國維. 磁振造影腦模板之客製化建構. Master’s thesis, 2011.
[16] D.C. Alexander, C. Pierpaoli, P.J. Basser, and J.C. Gee. Spatial transformations
of diffusion tensor magnetic resonance images. Medical Imaging, IEEE Transactions on,
20(11):1131–1139, 2001.
[17] V. Arsigny, P. Fillard, X. Pennec, and N. Ayache. Log-euclidean metrics for fast and simple calculus on diffusion tensors. Magnetic resonance in medicine, 56(2):411–421, 2006.
[18] P.J. Basser, J. Mattiello, and D. LEBiHAN. Estimation of the effective self-diffusion tensor from the nmr spin echo. Journal of Magnetic Resonance Series B, 103:247–247, 1994.
[19] P.J. Basser and S. Pajevic. Statistical artifacts in diffusion tensor mri (dtmri) caused by background noise. Magnetic resonance in medicine, [20] F. J. S. Castro, O. Clatz, J. Dauguet, N. Archip, J. Ph Thiran, and S. K. Warfield. Evaluation of brain image nonrigid registration algorithms based on log-euclidean mr-dti consistency measures. In Biomedical Imaging: From Nano to Macro, 2007.
[21] D.L. Collins, P. Neelin, T.M. Peters, and A.C. Evans. Automatic 3d inter-subject registration of MR volumetric data in standardized talairach space. Journal of computer assisted tomography, 18(2):192, 1994.
[22] A.C. Evans, D.L. Collins, SR Mills, ED Brown, RL Kelly, and TM Peters. 3d statis- tical neuroanatomical models from 305 mri volumes. pages 1813– 1817 vol. 3. IEEE.
[23] P. Fillard, X. Pennec, V. Arsigny, and N. Ayache. Clinical dt-mri estimation, smooth- ing, and fiber tracking with log-euclidean metrics. Medical Imaging, IEEE Transac- tions on, 26(11):1472–1482, 2007. [24] C. Goodlett, B. Davis, R. Jean, J. Gilmore, and G. Gerig. Improved
correspondence for dti population studies via unbiased atlas building. Medical Image Computing and Computer-Assisted Intervention–MICCAI
2006, pages 260–267, 2006.
[25] M. Ingalhalikar, J. Yang, C. Davatzikos, and R. Verma. Dtidroid: Diffusion tensor imagingdeformable registration using orientation and intensity descriptors. Interna- tional Journal of Imaging Systems and Technology, 20(2):99–107, 2010.
[26] M. Jenkinson, P. Bannister, M. Brady, and S. Smith. Improved optimization for the robust and accurate linear registration and motion correction of brain images. Neu- roImage, 17(2):825–841, 2002.
[27] M. Jenkinson, C.F. Beckmann, T.E.J. Behrens, M.W. Woolrich, and S.M. Smith. Fsl. NeuroImage, 62(2):782–790, 2012.
[28] M. Jenkinson, M. Pechaud, and S. Smith. Bet2: Mr-based estimation of brain, skull and scalp surfaces. pages 12–16.
[29] Chiang Ming-Chang, A. D. Leow, A. D. Klunder, R. A. Dutton, M. Barysheva, S. E.Rose, K. L. McMahon, G. I. de Zubicaray, A. W. Toga, and P. M. Thompson. Fluid registration of diffusion tensor images using information theory. Medical Imaging,
IEEE Transactions on, 27(4):442–456, 2008.
[30] S. Mori, K. Oishi, H. Jiang, L. Jiang, X. Li, K. Akhter, K. Hua, A.V. Faria, A. Mah-
mood, and R. Woods. Stereotaxic white matter atlas based on diffusion tensor imaging in an icbm template. NeuroImage, 40(2):570–582, 2008.
[31] D.E. Rex, J.Q. Ma, and A.W. Toga. The loni pipeline processing environment. Neu- roImage, 19(3):1033–1048, 2003.
[32] A. Roche, G. Malandain, X. Pennec, and N. Ayache. The correlation ratio as a new similarity measure for multimodal image registration. Medical Image Computing and Computer-Assisted Interventation— MICCAI’98, pages 1115–1124, 1998.
[33] D.W. Shattuck, S.R. Sandor-Leahy, K.A. Schaper, D.A. Rottenberg, and R.M. Leahy.Magnetic resonance image tissue classification using a partial volume model. Neu- roImage, 13(5):856–876, 2001.
[34] S.M. Smith. Fast robust automated brain extraction. Human Brain
Mapping,17(3):143–155, 2002.
[35] H. Zhang, P.A. Yushkevich, D. Rueckert, and J.C. Gee. Unbiased white matter atlas construction using diffusion tensor images. pages 211–218. Springer-Verlag.
[36] S. Zhang, H. Peng, R.J. Dawe, and K. Arfanakis. Enhanced icbm diffusion
tensor template of the human brain. NeuroImage, 54(2):974–984, 2011.
[37] K. Zilles, R. Kawashima, A. Dabringhaus, H. Fukuda, and T. Schormann.
Hemi- spheric shape of european and japanese brains: 3-d mri analysis of intersubject vari- ability, ethnical, and gender differences. NeuroImage, 13(2):262–271, 2001.
1
國科會補助專題研究計畫項下出席國際學術會議心得報告
日期: 2012 年 7 月 28 日一、參加會議經過
Computational Neuroscience (CNS) 是由國際計算神經科學組織所籌辦的年度會議,為該研究
領域最重要的學術會議之一,每年均吸引許多研究學者參與。今年會議地點在美國喬治亞州亞特
蘭大市郊的 Decatur,借用 Agnes Scott College 的會議廳來舉辦。我們在會議前一天抵達亞特蘭大,
隔天開始全程參與會議,並發表了研究論文:“Dysfunction of cross-frequency phase-phase coupling in
primary dysmenorrhea: a resting magnetoencephalographic study”。這篇論文的重點在如何利用腦磁圖
來研究原發性痛經病患在休息狀態時,其腦部活動之跨頻率相位耦合的不正常現象。在會議中我
們與許多研究學者分享研究心得,針對多重頻率之間的訊號分析技術與臨床應用多所討論,收穫
十分豐盛。
二、與會心得
第一天正式會議之前,我們參加了幾個 Tutorials,包括由明尼蘇達大學的 Duane Nykamp 教授
所安排的 Complex networks and graph theoretical concepts,讓我們對於如何將社交網路拓樸裡的小
世界(small world)與 scale-free 模型應用在腦神經網路模型上有更深一層的認識,從模型理論、
估算、分析、應用一氣呵成,介紹精闢,十分完整詳盡。另外,我們也參加了內華達州立大學 Brain
Computation 實驗室的 Laurence Jayet Bray、Roger Hoang、與 Frederick Harris 等教授所主辦的
Real-time simulation of large-scale neural models using the NeoCortical Simulator (NCS),對於如何應
計畫編號
NSC 100-2628-E-009 -006-
計畫名稱
腦部結構磁振造影影像量化分析與模板建立(2/2)
出國人員
姓名
陳永昇
服務機構
及職稱
交通大學 資訊工程系 副教授
會議時間
2012 年 7 月 21 日至
2012 年 7 月 26 日
會議地點
美國 亞特蘭大
會議名稱
(中文)計算神經科學年度會議
(英文)Annual Meeting of the Organization for Computational Neuroscience
發表論文
題目
(中文)以休息狀態腦磁波進行原發性痛經之跨頻相位耦合失常之研究
(英文) Dysfunction of cross-frequency phase-phase coupling in primary
2
用 NCS 模擬器來進行大範圍神經網路的模擬與分析有初步的認識,課程內容十分精彩。整體來說,
這些 Tutorials 由淺入深、包羅廣泛,十分精彩。Tutorials 過後接著便是一連五天的主會議與
Workshops,本次會議的重點圍繞在計算神經行為學(Computational Neuroethology)
的探討,Keynote
speech 是由英國愛丁堡大學的 Barbara Webb 教授進行有關神經元與行為的研究發表,對於昆蟲感
覺運動控制的計算與機器模型有很精闢的探討。另一場 Keynote Speech 則是由美國喬治亞州立大
學的 Donald Edwards 教授所進行有關神經機械模擬與混合系統的研究發表,對於姿勢與反覆運動
的再內導(reafference)有詳盡的說明。最後一場 Keynote speech 是由美國西北大學的 Malcolm
Maciver 教授主講,內容是有關運動與體感之間的能量資訊平衡。整體來說本次會議議程非常豐
富、深入、與多元,收穫良多。
圖:壁報論文發表
三、建議
本會議每次均包含豐富的教育訓練課程,精彩的 Keynote Speech,以及涵蓋 oscillation、感覺
系統、麻醉與睡眠、記憶、模型等等廣泛計算神經科學相關主題,非常值得國內相關領域研究人
員參與此會議。
四、攜回資料名稱及內容
Organization for Computational
Neurosciences
2885 Sanford Ave SW #15359
Grandville, MI 49418
USA
To whom it may concern,
Yong-Sheng Chen has been invited to present a scientific paper at the 21st
Annual Meeting for Computational Neuroscience CNS 2012 to present
research done at . The CNS 2012 meeting will be held from July 21 to July 26
in Decatur, Georgia, USA. The paper is titled "Dysfunction of cross-frequency
phase-phase coupling in primary dysmenorrhea: a resting
magnetoencephalographic study".
Detailed information about the annual meeting is available at www.cnsorg.org.
You can contact me for further information.
Sincerely,
Prof. E. De Schutter
OCNS President
e-mail [email protected] phone: 8727 fax:
+81-98-966-8718
From:
OCNS President <[email protected]>
Subject:
Invitation Letter CNS 2012
Date:
July 17, 2012 4:21:58 PM GMT+08:00
To:
[email protected]
Dysfunction of cross-frequency phase-phase coupling in primary
dysmenorrhea: a resting magnetoencephalographic study
Pin-Shiuan Lee1, Yong-Sheng Chen2, Jen-Chuen Hsieh3,4, Li-Fen Chen3,4
1Institute of Biomedical Informatics, National Yang-Ming University, Taipei 112, Taiwan 2Department of Computer Science, National Chiao Tung University, Hsinchu 300, Taiwan, 3Institute of Brain Science, National Yang-Ming University, Taipei 112, Taiwan
4Integrated Brain Research Laboratory, Department of Medical Research and Education, Taipei Veterans General
Hospital, Taipei 112, Taiwan E-mail: [email protected]
Cross-frequency synchronization between local or large-scale networks has been proposed recently, which is related to phase coupling between neuronal oscillations of different frequency content [1]. This study aimed at investigation of how cross-frequency coupling of local network during rest is modulated by pain experience. Ten primary dysmenorrhea (PDM) women, who suffer from lower abdominal pain during menstrual phase, and ten age-matched healthy subjects during menstrual phase were enrolled. Three-minute eye-open resting magnetoencephalographic (MEG) signals of each individual were recorded using a 306-channel magnetoencephalography system. For each channel, synchronization value of cross-frequency coupling was estimated by calculating phase-locking statistics of phase differences between two frequency bands, including 2, 4, 8, 12, 16, 24, 32, and 40 Hz, respectively. The results showed that the PDM group displayed oscillatory hyperconnectivity of low alpha-beta (8-16 Hz) coupling in the medial superior parietal area (Figure 1(a)) and hypoconnectivity of high alpha-beta (12-24 Hz) coupling in the frontal area (Figure 1(b)), where were functionally and structurally connected in previously reports of resting networks [2]. Two-way ANOVA results showed interaction between group and cross-frequency synchronization values at these regions.
Conclusions
Our findings implicate that pain experience may modulate phase-phase coupling of alpha-beta oscillation, which might disrupt integration between nearby neural population in the human neocortex.
Acknowledgements
This study was supported in part by the National Science Council (NSC 100-2629-B-010-001) and Yen Tjing Ling Medical Foundation (CI-100-5).
References
1. Nikulin V, Brismar T: Phase synchronization between alpha and beta oscillations in the human
electroencephalogram. Neuroscience 2006, 137(2):647-657.
2. Van Den Heuvel M, Mandl R, Pol HH: Normalized cut group clustering of resting-state FMRI data. PLoS One 2008, 3(4):e2001.
1
國科會補助專題研究計畫項下出席國際學術會議心得報告
日期: 2012 年 01 月 04 日一、參加會議經過
ICONIP 是每年度在亞洲地區神經資訊處理領域最重要的會議之一,每年均吸引眾多相關領域
研究學者參與。今年的會議在中國上海舉行,我們在會場以海報展示方式發表研究論文: “Person
identification using electroencephalographic signals evoked by visual stimuli"。 論文的研究主旨在利
用腦電波儀蒐集視覺誘發電位,開發一套機器學習、自動化身份辨識系統。研究中共蒐集 18 位受
試者腦波資料,系統可高達 96.4% 正確辨識率,顯示本研究成果可實際應用的可行性。論文海報
內容如後附件。
二、建議
本會議每年均安排精彩的 Keynote Speech,以及涵蓋神經資訊處理相關重要技術與研究主
題,非常值得國內相關領域研究人員參與此會議。
四、攜回資料名稱及內容
攜回 Book of Abstracts: including abstracts of all presentations in the conference。
計畫編號
NSC 100-2628-E-009-006-
計畫名稱
腦部結構磁振造影影像量化分析與模板建立(2/2)
出國人員
姓名
陳麗芬
服務機構
及職稱
陽明大學 腦科學研究所 副教授
會議時間
2011 年 12 月 13 日至
2011 年 12 月 18 日
會議地點
中國 中國
會議名稱
(中文) 第十八屆神經資訊處理國際會議
(英文) 18th International Conference on Neural Information Processing
發表論文
題目
(中文) 利用視覺誘發電位進行身份辨識
(英文) Person identification using electroencephalographic signals evoked by
visual stimuli
Dear Authors,
Congratulations! On behalf of the ICONIP2011 Technical Program Committee and the program chairs, we are pleased to inform you that your paper:
Paper ID: ICONIP-0826
Author(s): Jia-Ping Lin, Yong-Sheng Chen and Li-Fen Chen
Title: Person Identification using Electroencephalographic Signals Evoked by Visual Stimuli
has been accepted for presentation at the 18th International Conference on Neural Information Processing (ICONIP 2011) and for publication in the conference proceedings published by Lecture Notes in Computer Science, Springer. Some good papers will be recommended to publish some journal such as Neurocompting after the conference.
Here are the steps you need follow to submit the final version of your paper:
1. Please see the LNCS FORMATTING REQUIREMENTS and REVIEWERS' COMMENTS for your paper, which are intended to help you to improve your paper before submitting it for final publication. The listed comments should be addressed, as final acceptance is conditional on your appropriate response to the formatting requirements and reviewers' comments.
2. Please prepare your manuscript in the final camera-ready format following the format guidelines given on the ICONIP2011 website. Each paper must not exceed 10 pages including figures and references (papers beyond eight pages are subject to page surcharge). Final papers MUST be submitted by 2011-08-15. All papers must be re-submitted even if the reviewers indicated that no changes are required.
3. In order for your paper to be published in the conference proceedings, a signed Springer Copyright Form (Consent to Publish) must be submitted for each paper.
4. Inclusion of a paper in the ICONIP2011 program and publication of a paper in the proceedings requires that at least one author for the paper register for the conference. Each regular or student registration covers one paper. Extra fee will be charged for additional paper(s), if more than one paper are accepted. The extra fee is 200 USD for each additional accepted paper. Please supply the paper ID number(s) in the registration form to avoid possible delays.
If you have any questions regarding the reviews of your paper please contact Liqing Zhang <[email protected]>. We look forward to seeing you in Shanghai.
Sincerely,
Technical Program Co-Chairs
Liqing Zhang <[email protected]> James Kwok<[email protected]>
REVIEWERS' COMMENTS ---REVIEW NO. 1
From: <[email protected]>
Subject: ICONIP2011 Submission Decision
Date: August 3, 2011 11:37:24 AM GMT+08:00
Person Identification using
Electroencephalographic Signals Evoked by
Visual Stimuli
?Jia-Ping Lin1, Yong-Sheng Chen1,2??, and Li-Fen Chen3
1 Inst. of Biomedical Engineering, National Chiao Tung University, Hsinchu, Taiwan 2
Dept. of Computer Science, National Chiao Tung University, Hsinchu, Taiwan
3 Inst. of Brain Science, National Yang-Ming University, Taipei, Taiwan
Abstract. In this work we utilize the inter-subject differences in the electroencephalographic (EEG) signals evoked by visual stimuli for per-son identification. The identification procedure is divided into classifica-tion and verificaclassifica-tion phases. During the classificaclassifica-tion phase, we extract the representative information from the EEG signals of each subject and construct a many-to-one classifier. The best-matching candidate is further confirmed in the verification phase by using a binary classifier specialized to the targeted candidate. According to our experiments in which 18 subjects were recruited, the proposed method can achieve 96.4% accuracy of person identification.
1
Introduction
Conventional person identification methods include passwords, smart cards, and a variety of biometric techniques. Passwords and smart cards are widely-used because of the advantage of convenience. However, smart cards might be stolen, simple passwords might be deciphered, and complicated passwords might be for-gotten. Current biometric features such as iris, fingerprints, face, voice, palm, and gait do not suffer the above-mentioned disadvantages, but they can be stolen, duplicated, or even provided under violent threats. Brainwave is an emerging bio-metric feature for person identification because of its uniqueness and consistency. Moreover, brainwave is difficult to steal or duplicate and the characteristics em-bedded in the brainwave when the subject is under threat are hardly the same as those in normal situation. These advantages promote brainwaves as new keys to safer person identification systems.
Among all the non-invasive brainwave acquisition modalities, electroencepha-lography (EEG) has the advantages of portability, easy operation, high tempo-ral resolution, and low costs. To evaluate the uniqueness and consistency of the
?
This work was supported in part by the MOE ATU program, Taiwan National Science Council under Grant Numbers: NSC-99-2628-E-009-088 and NSC-100-2220-E-009-059, and the UST-UCSD International Center of Excellence in Advanced Bio-engineering sponsored by the Taiwan National Science Council I-RiCE Program under Grant Number: NSC-99-2911-I-009-101.
??
2 Person Identification using Electroencephalographic Signals
characteristics in EEG signal, the work in [6] confirmed that the inter-subject variation of EEG spectra where different subjects administered the same task was larger than the intra-subject variation where the EEG signals of the same subject were repeatedly acquired for several times. At first resting data was used for person recognition and the identification rate ranged from 72 to 85% [10]. In 2003, Palaniappan and Ravi investigated the task-related EEG signals. By extracting features from visual evoked potentials (VEPs), the identification ac-curacy was improved to be larger than 90% [9]. The features in EEG signals include autoregressive (AR) coefficients, coherence, and cross-correlation [7]. In [1] the event-related potentials (ERPs) were utilized for person identification. This work used the images of self-relevant objects as the visual stimuli and se-lected prominent channels related to this experiment. Temporal domain features such as P100, N170, and N250 were used in the signal analysis [4]. For simplicity and practicability, the work [5] classified subjects simply by thresholding the EEG power spectrum.
In this paper we present a person identification system using EEG signals. Because resting state is prone to be more fluctuating, we adopt task-related EEG signals evoked by visual stimuli in this work. Representative information is extracted from the EEG signals of subjects and are used to train a many-to-one classifier for person classification. The best-matching candidate of each classifi-cation is further verified by using a binary classifier to exclude the intruder.
2
Materials
2.1 Participants and paradigm
Eighteen subjects participated in this study (age ranges from 21 to 33 years with mean 24 years, twelve males). All the subjects have normal or corrected-to-normal visions. For five participants among all the subjects, EEG data were acquired two times with an interval of more than one week.
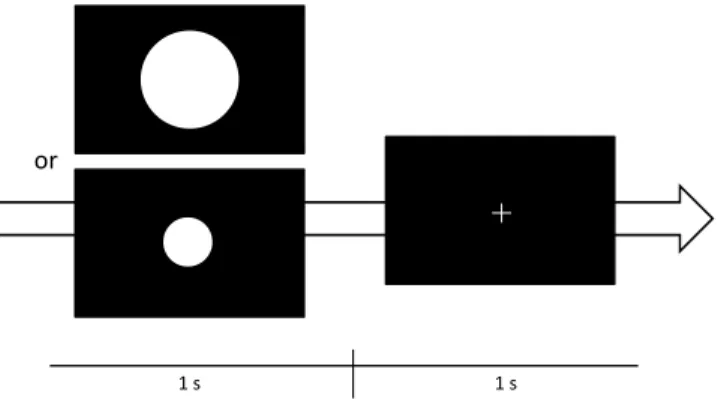
The paradigm of data acquisition in this study is shown in Fig. 1. The subject was seated comfortably in a silent room and was asked to watch a monitor screen. The visual stimulus, an image containing either a small disk or a large one (five times larger than the small one), was presented for one second followed by another second of fixation image of a cross. The frequency ratio between the stimulus images is one (large disk) to three (small disk). Around 250 trials were acquired for each participant.
2.2 EEG recording and preprocessing
Thirty-two standard scalp electrodes were placed according to the International 10-20 System of Electrode Placement. We picked the channels related to the visual stimuli and P300 component in the frontal, frontal-central, parietal, and occipital regions [3]. The ten channels we selected were Fz, FCz, Cz, CPz, P3, Pz, P4, O1, Oz, and O2. This process will reduce the quantity of data and eliminate