3
CORPORATEOWNERSHIP & CONTROL
Editorial Address:
Assistant Professor Alexander N. Kostyuk Department of Management & Foreign Economic Activity
Ukrainian Academy of Banking of National Bank of Ukraine Petropavlovskaya Str. 57 Sumy 40030 Ukraine Tel: +0038-0542-288365 Fax: +0038-0542-611025 e-mail: [email protected] [email protected] www.virtusinterpress.org
Journal Corporate Ownership & Control is published four times a year, in September-November, December-February, March-May and June-August, by Publishing House “Virtus Interpress”, Kirova Str. 146/1, office 20, Sumy, 40021, Ukraine.
Information for subscribers: New orders requests
should be addressed to the Editor by e-mail. See the section "Subscription details".
Back issues: Single issues are available from the
Editor. Details, including prices, are available upon request.
Advertising: For details, please, contact the Editor of
the journal.
Copyright: All rights reserved. No part of this
publication may be reproduced, stored or transmitted in any form or by any means without the prior permission in writing of the Publisher.
Corporate Ownership & Control
ISSN 1727-9232 (printed version) 1810-0368 (CD version) 1810-3057 (online version)
Certificate № 7881
Virtus Interpress. All rights reserved.
КОРПОРАТИВНАЯ СОБСТВЕННОСТЬ И КОНТРОЛЬ Адрес редакции: Александр Николаевич Костюк доцент кафедры управления и внешнеэкономической деятельности Украинская академия банковского дела Национального банка Украины ул. Петропавловская 57 г. Сумы 40030 Украина Тел.: 0038-0542-288365 Факс: 0038-0542-611025 эл. почта: [email protected] [email protected] www.virtusinterpress.org Журнал "Корпоративная собственность и контроль" издается четыре раза в год в сентябре-ноябре, декабре-феврале, марте-мае, июне-августе издательским домом Виртус Интерпресс, ул. Кирова 146/1, г. Сумы, 40021, Украина. Информация для подписчиков: заказ на подписку следует адресовать Редактору журнала по электронной почте. Отдельные номера: заказ на приобретение отдельных номеров следует направлять Редактору журнала. Размещение рекламы: за информацией обращайтесь к Редактору. Права на копирование и распространение: копирование, хранение и распространение материалов журнала в любой форме возможно лишь с письменного разрешения Издательства. Корпоративная собственность и контроль ISSN 1727-9232 (печатная версия) 1810-0368 (версия на компакт-диске) 1810-3057 (электронная версия) Свидетельство КВ 7881 от 11.09.2003 г. Виртус Интерпресс. Права защищены.
4
РЕДАКЦИОННЫЙ СОВЕТ
Александр Костюк
, к.э.н., Украинская академия банковского дела (Украина) - Главный редактор;Сэр Джордж Бэйн
, д.э.н., проф., президент и проректор Королевского университета (Великобритания) - почетный член Редакционного совета;Сэр Джеффри Оуэн
, д.э.н., проф., Лондонская школа экономики (Великобритания) - почетный член Редакционного совета;Майкл Дженсен
, д.э.н., проф., Гарвардская школа бизнеса (США) - почетный член Редакционного совета;Стефан Дэвис,
д.э.н., президент компании Davis Global Advisors, Inc. (USA);Брайен Чеффинс,
д.э.н., проф., Кембриджский университет (Великобритания);Бернард Блэк,
д.э.н., проф., Стэнфордский университет (США);Симон Дикин,
д.э.н., проф., зав. кафедрой корпоративного управления, школа бизнеса, Кембриджский университет (Великобритания);Дэвид Ермак,
д.э.н., проф., университет Нью-Йорка (США);Йонгджи Ким,
д.э.н., заместитель декана школы международных отношений,университет Йонсей (Южная Корея);Джеффри Неттер,
д.э.н., проф., кафедра банковского дела и финансов, колледж бизнеса Терри, университет Джорджии (США);Ян Рамси,
д.э.н., проф., Мельбурнский университет (Австралия);Джонатан Бэйтс,
директор компании Institutional Design (Великобритания);Лиу Джунхай,
д.э.н., проф., заместитель директора Института права Китайской академии наук (Китай);Джонатан Мейси,
д.э.н., проф., директор учебных программ по праву и экономике школы права Корнельского университета (США);Роберт МакГи,
д.э.н., проф., проректор школы бизнеса, университет Барри (США);Фианна Есовер,
ОСЭР, департамент корпоративного управления (Франция);Александр Лок,
д.э.н., проф., Национальный университет Сингапура (Сингапур);Анил
Шивдасани,
д.э.н., проф., школа бизнеса Кенан-Флагер, университет Северной Каролины (США);Радо Бохинк,
д.э.н., проф., Люблянский университет (Словения);Гарри Бродман,
д.э.н., главный экономист Мирового банка в Европе и Центральной Азии (США);Родольфо Апреда,
д.э.н., проф., университет Десема (Аргентина);Андреа Мелис,
д.э.н., проф., университет Кальяри (Италия);Хаген Линдштадт,
ректор школы менеджмента, университет Карлсруе (Германия);Хулио Пиндадо,
д.э.н., проф., университет Саламанка (Испания);Петр Тамович,
д.э.н., проф., Гданьский институт исследований рынка (Польша);Йосер Гадхоум,
д.э.н., проф., университет Квебека (Канада);Виктор Мендес,
д.э.н., кафедра экономики университета Порту(Португалия);
Александр Краковский,
управляющий компанией Ukraine Investment Advisors, Inc. (США);Петр Михали,
д.э.н., проф., кафедра экономики, Центрально-Европейский университет (Венгрия);Вольфганг Дробец,
д.э.н., проф., Базельский университет (Швейцария);Джен Чен,
д.э.н., проф., директор Центра корпоративного управления в развивающихся странах, университет Сюррей (Великобритания);Клаус Гуглер,
д.э.н., проф., кафедра экономики, Венский университет (Австрия);Аждар Карами,
д.э.н., проф., университет Уельса (Великобритания);Карстен Спренгер,
кафедра экономики и бизнеса, университет Помпеу Фабра (Испания);Тор Эриксон,
д.э.н., проф., бизнес-школа Аархус (Дания);Норвальд
Инстефьорд,
д.э.н., проф., колледж Биркбек, Лондонский университет (Великобритания);Джон
Ирль,
д.э.н., проф., директор Института исследования занятости (США);Том Кирхмайер,
д.э.н., проф., Лондонская школа экономики (Великобритания);Теодор Баумс,
д.е.н., проф., Франкфуртский университет (Германия);Джулия Элстон,
д.э.н., проф., университет Центральной Флориды (США);Демир Енер,
д.э.н., проф., USAID (Босния и Герцеговина);Mартин Конйон,
д.э.н., проф., Вартонская школа бизнеса (США);Джэф Стаплдон,
д.э.н., проф., Мельбурнский университет (Австралия);Евгений Расторгуев,
Исполняющий менеджер, издательский дом «Виртус Интерпресс» (Украина).5
Dear Readers!
The recent issue of the journal „Corporate Ownership and Control“ is devoted to some key topics. We constructed this issue of the journal around the fundamental analysis of corporate governance systems in Asia, Africa and Australia.
We introduced a new market to explore corporate governance - Africa. Corporate governance has received much attention especially among very large firms in developed markets. As proved by Anthony Kyereboah-Coleman, Charles K.D. Adjasi, and Joshua Abor developing countries are now increasingly embracing the concept of good corporate governance, knowing it leads to sustainable growth and Ghana is no exception.
So it is generally accepted that the concept “corporate governance“ discussed by Anthony Kyereboah-Coleman, Nicholas Biekpe is gradually warming itself as a priority in the African continent.
The paper by Greg Tower and Dulacha G Barako provides an empirical analysis of banks performance in Kenya.
Besides that we tried to do our utmost to develop the academic investigations and concepts through publishing papers titled as “Ownership Structure and Operating Performance Changes surrounding Stock Option Adoptions: Evidence from Japan” by Konari Uchida and Mamoru Matsumoto, “Impact of Board Size and Board Diversity on Firm Value: Australian Evidence” by Hoa Nguyen, Robert Faff and “Board Composition, Audit Committee and Timeliness of Corporate Financial Reports in Malaysia“ by Shamsul-Nahar Abdullah.
The paper by Ying-Fen Lin divides companies into non-family businesses and family businesses and investigates the influence of outside directors, outside blockholders, and excess compensation in CEOs termination process.
In turn Cláudio Antonio Pinheiro Machado Filho, Adalberto Fischmann, Luciana Rocha de Mendonça, Sandra Guerra open essensials of the mechanisms of governance in nonprofit organizations.
In another study Li-Anne Elizabeth Woo researches critically the law matters thesis, also critiques the law matters thesis from a perspective largely beyond the mainstream law journals and yields perspectives often overlooked in the law literature.
Tzong-Huei Lin describes the IPO underpricing and corporate governance in Taiwan. The results generally suggest that the corporate governance reform of Taiwan offers an opportunity to investigate the effect of corporate governance on IPOs market.
The study by Alma Whiteley attempts to investigate trust and the employee perspective. It is meant to introduce trust as related to organizational design and management within the broader domain of governance and report on case study research on trust carried out in a large Australian organization. The next studies by Saw-Imm Song, Ruhani Ali, Subramaniam Pillay, and Douglas Nanka-Bruce described family ownership, premiums paid and performance (evidence from corporate take-overs in
Malaysia) and corporate ownership and technical efficiency analysis in the Spanish real estate sector. We hope that our practitioner’s corner with the paper „The premium paid for M&A: the Nasdaq case“
by Mpasinas Antonios will be read by you with interest.
We would like to remind that all our efforts are directed to develop corporate governance through intensive research and in this way your contribution is welcome by us!
6
CORPORATE OWNERSHIP & CONTROL
Volume 4, Issue 2, Winter 2006-2007
C
ONTENTS
Editorial
5
SECTION 1. ACADEMIC INVESTIGATIONS AND CONCEPTS
Ownership Structure and Operating Performance Changes surrounding
Stock Option Adoptions: Evidence from Japan 10
Konari Uchida, Mamoru Matsumoto
Stock option adoptions by IPO firms account for about one-third of Japanese stock option adoptions during 1997-2000. Non-IPO firms that adopt stock options tend to decrease financial institutions’ ownership levels less than the average whereas reduce other corporations’ ownership levels more than the average. The result suggests firms that care more about shareholder wealth decrease cross-shareholdings as well as issue stock options. However, such firms need to keep cross-shareholdings by financial institutions to prevent increases in agency costs of debt. Finally, we do not find a significant change in firms’ operating performance surrounding stock option adoptions.
Impact of Board Size and Board Diversity on Firm Value:
Australian Evidence 24
Hoa Nguyen, Robert Faff
The aim of this paper is to provide a preliminary analysis of the relationship between firm market value and the size and gender diversity of a board of directors for a sample of publicly listed Australian firms. Our results show that smaller boards appear to be more effective in representing the shareholders as smaller boards are associated with higher firm value. As board size increases firm value declines, however at a decreasing rate suggesting that the relationship between board size and firm value is not strictly linear. Our findings further indicate that gender diversity promotes shareholders’ value as the presence of women directors is associated with higher firm value.
Board Composition, Audit Committee and Timeliness of Corporate
Financial Reports in Malaysia 33
Shamsul-Nahar Abdullah
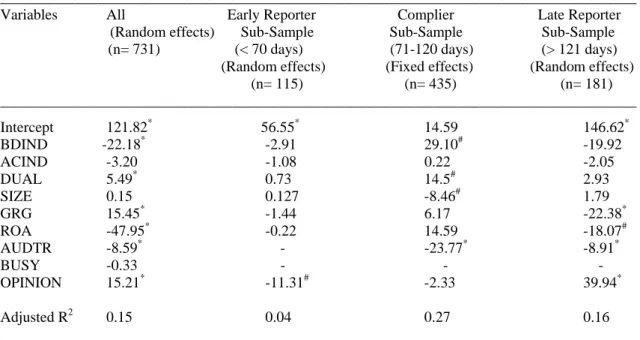
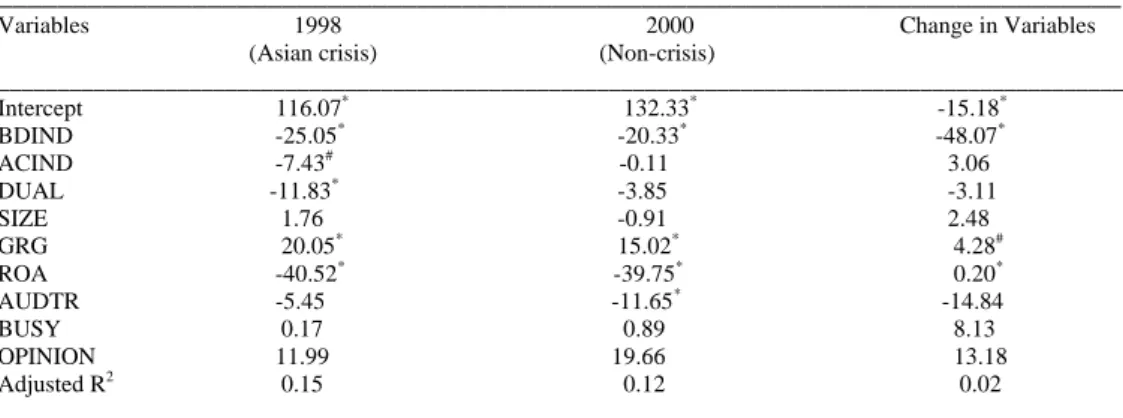
This study attempts to investigate the roles of the composition of board of directors, audit committee and the separation of the roles of the board chairman and the chief executive officer on the timeliness of reporting. The issue of reporting timeliness is important in corporate governance because it is associated with corporate transparency. It is also an important indicator of the value of the information in the financial reports. Given the fact that the board is the highest internal corporate governance system, it is predicted that the characteristics of the board and its sub-committee, namely the audit committee, are associated with the timeliness of reporting. Using Bursa Malaysia (formerly known as the Kuala Lumpur Stock Exchange) Main Board companies data in respect of the financial years 1998 and 2000, the findings show that board independence and the separation of the roles of
7
board chairman and CEO significantly are associated with timelier reporting. The results also indicate that the 1997 financial crisis had adversely affected the timeliness of reporting. These findings imply that during difficult periods, companies tend to take a longer time to prepare their audited financial reports. Finally, the negative relation between firm’s profitability and timeliness of reporting is supportive of information signaling theory.Corporate Governance, Excess Compensation, and CEO Turnover in
Family and Non-Family Businesses 46
Ying-Fen Lin
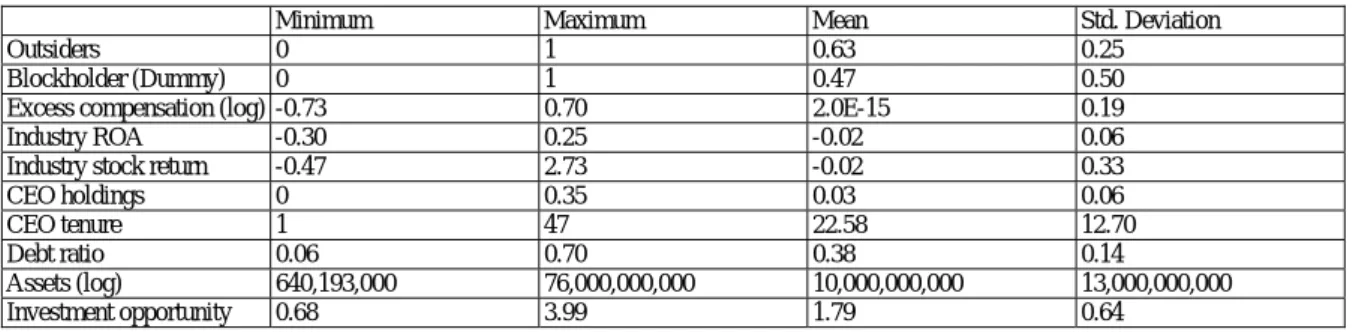
The replacement of a CEO is one of the control mechanisms that companies employ to reduce the agency problems. This paper divides companies into non-family businesses and family businesses and investigates the influence of outside directors, outside blockholders, and excess compensation in CEOs termination process. The samples used in the paper come from manufacturing companies in Taiwan listed between 1996-1997; the analytical method is logistic regression model. The conclusion is as follows: 1. the characteristics of family businesses, corporate governance, and excess compensation have no correlation on CEO turnover. 2. External board members play an important role in CEO termination in non-family businesses.
Recipients of Governance: Trust and the Employee Perspective 53
Alma Whiteley
Purpose - To introduce trust as related to organizational design and management within the broader domain of governance and report on case study research on trust carried out in a large Australian organization. Design/methodology/approach - This paper is in three parts. The first part reviews a selection of ideas and recent writers on trust; the second part describes the methodology of the case study research which focused on relationship management where trust emerged as an important element of relationships. This is followed by examples from the findings. The third part addresses insights and future research. Originality/Value - The study of trust has become an important topic for management and corporate governance during recent years. After discussing scholarly interpretations of trust, empirical research findings are used to provide insight into how employees actually understand and interpret trust.
Underpricing and Corporate Governance-Evidence from Taiwan
Securities Market 69
Tzong-Huei Lin
To enhance the corporate governance of listed firms, Taiwan prescribes that the initial public offerings (IPOs) after February 19, 2002, have to set up at least two independent directors and one independent supervisor who posses financial or accounting expertise. Using data from Taiwan's initial public offerings (IPOs), this study documents evidence that the magnitudes of under-pricings of IPOs after 2002 are significantly smaller than those of before. The empirical evidence also indicates that the percentage of shares holdings owned by directors/supervisors is demonstrated to have negative relationship with the underpricing of the IPOs. This study contributes to the literature in the following ways. First, as Ritter and Welch (2002) suggest that future progress in the IPO underpricing literature will mainly come from agency conflict explanation, this study provides evidence about the effect of corporate governance on IPOs market. Second, as for the issue about the policy implication of the SFB 2002’ rules, this study provides the empirical evidence. Third, whether the government should prescribe the firms to set up independent directors? This study offers a direction for future discussion.
The Fiscal Piece of Advice as Instrument of Protection and Generation of Value to the Minority Shareholders. an Vision of Corporate Governance 74
Sergio Antonio Loureiro Escuder, Joao Eduardo Prudencio Tinoco
The present article inserted in the extent of the corporate governance has as objective contributes in the evaluation of the importance of the fiscal piece of advice in the structure of the organizations,
8
with lucrative purposes, as control instrument and support to the shareholders' Assembly, to the light of the legislation of the limited companies and of the reduction entities, class organs, like IBGC, CVM, IBRACON and BOVESPA. It was observed, on the other hand, that the family company is preponderant in Brazil, and that that central aspect limits the performance of the fiscal piece of advice in the context of the corporate governance.
The Mechanisms of Governance in Nonprofit Organizations 83
Cláudio Antonio Pinheiro Machado Filho, Adalberto Fischmann, Luciana Rocha de Mendonça, Sandra Guerra
This paper discusses the governance issues in nonprofit organizations (NPO). The theoretical framework of agency theory is used to analyze the relationship between agents and principals (donors and volunteers) in such kinds of organizations. Similarly to the for-profit organizations, the mechanisms of incentives and monitoring are crucial to the alignment of interests among principals and agents. However, considering the NPO’s intrinsic characteristics, due to the difficulty to implement external and internal governance mechanisms, the challenges of alignment are far more complicated. The NPOs are idiosyncratic, being in many situations complex to establish performance comparisons with similar organizations.
SECTION 2. CORPORATE OWNERSHIP
Family ownership, Premiums Paid and Performance: Evidence from
Corporate Take-overs in Malaysia 89
Saw-Imm Song , Ruhani Ali, Subramaniam Pillay
This study examines the relationship between ownership identity of the largest shareholders, premiums paid and take-over performance, with reference to 63 large acquisitions by Malaysian public listed firms from 1990 to 1999. It is found that the premiums paid are much higher than those in developed countries. It has a curvilinear relationship with take-over performance. At lower to moderate levels of premiums, it improves post-take-over performance while excessive premium drags down the performance of the bidding firms. The finding shows that there is an interaction effect between family ownership and premiums paid which has contributed positively to the post-take-over performance. The evidence suggests that family ownership mitigates agency problem in corporate take-overs.
Corporate Ownership and Technical Eficiency Analysis in the Spanish Real
Estate Sector 100
Douglas Nanka-Bruce
The real estate sector keeps contributing significantly to the Spanish economy. A recent news article reports the existence of inefficiencies in the nature and delivery of new properties. We investigate the technical efficiency of this sector using a non-parametric “reasonable” benchmarking frontier, acknowledging the marked influence of the sector’s shadow economy. We then relate the results applying a panel data analysis to the shareholding concentration and identity of firm ownership. We find no systematic support for the effect of corporate ownership on technical efficiency.
SECTION 3. NATIONAL PRACTICES OF CORPORATE
GOVERNANCE: AFRICA
The Relationship Between Board Size, Board Composition, CEO Duality
and Firm Performance: Experience From Ghana 114
Anthony Kyereboah-Coleman, Nicholas Biekpe
The paper examined board characteristics and its impact on the performance of non-financial listed firms in Ghana. Data covering 11 year period (1990-2001) was used and analysis conducted within the panel data framework. The study shows that most Ghanaian firms adopt the two-tier board structure and are largely non-independent. The regression results, though relatively mixed, confirm
9
other studies and show that there should be a clear separation of the two critical positions of CEO and board chairman in order to reduce agency cost for enhanced firm performance.Corporate Governance and Firm Performance: Evidence from
Ghanaian Listed Companies 123
Anthony Kyereboah-Coleman, Charles K.D. Adjasi, Joshua Abor
Well governed firms have been noted to have higher firm performance. The main characteristic of corporate governance identified include board size, board composition, and whether the CEO is also the board chairman. This study examines the role corporate governance structures play in firm performance amongst listed firms on the Ghana Stock Exchange. Results reveal a likely optimal board size range where mean ROA levels associated with board size 8 to 11 are higher than overall mean ROA for the sample. Significantly, firm performance is found to be better in firms with the two-tier board structure. Results show further that having more outside board members is positively related to firm performance. It is clear that corporate governance structures influence firm performance in Ghana, indeed within the governance structures the two-tier board structure in Ghana is seen to be more effective in view of the higher firm level mean values obtained compared to the one-tier system.
Corporate Governance and Bank Performance: Does Ownership
Matter? Evidence from the Kenyan Banking Sector 133
Dulacha G. Barako, Greg Tower
This paper provides an empirical analysis of banks performance in Kenya. The primary purpose of this study is to investigate the association between ownership structure characteristics and bank performance. Data utilised in the study is collected from the Financial Institutions Department of the Central Bank of Kenya, both on-site inspection reports and off-site surveillance records. Empirical results indicate that ownership structure of banks significantly influence their financial performance. In particular, board and government ownership are significantly and negatively associated with bank performance, whereas foreign ownership is strongly positively associated with bank performance, and institutional shareholders have no impact on the performance of financial institutions in Kenya. The results are consistent with prior research findings, and more importantly, presents statistical justification for pursuing further corporate governance reforms with respect to banks’ ownership structure to enhance the financial stability of the sector.
SECTION 4. PRACTITIONER’S CORNER
The premium paid for M&A: the Nasdaq case 145
Mpasinas Antonios
Our study is focused on the premium paid for an acquisition of a target company, especially on the Nasdaq market. We find that the relative size of the companies, the strategy of international diversification and the mean of payment influence the premium. The is no effect of maket timing on the premuim paid and the ownernish structure of the group of directors don’t seems to be significant.
10
РАЗДЕЛ 1
НАУЧНЫЕ ИССЛЕДОВАНИЯ
И КОНЦЕПЦИИ
SECTION 1
ACADEMIC
INVESTIGATIONS
& CONCEPTS
OWNERSHIP STRUCTURE AND OPERATING PERFORMANCE
CHANGES SURROUNDING STOCK OPTION ADOPTIONS: EVIDENCE
FROM JAPAN
Konari Uchida*, Mamoru Matsumoto** Abstract
Stock option adoptions by IPO firms account for about one-third of Japanese stock option adoptions during 1997-2000. Non-IPO firms that adopt stock options tend to decrease financial institutions’ ownership levels less than the average whereas reduce other corporations’ ownership levels more than the average. The result suggests firms that care more about shareholder wealth decrease cross-shareholdings as well as issue stock options. However, such firms need to keep shareholdings by financial institutions to prevent increases in agency costs of debt. Finally, we do not find a significant change in firms’ operating performance surrounding stock option adoptions.
Keywords: stock option, ownership structure, operating performance, agency costs of debt, IPO *Corresponding author: The University of Kitakyushu, Faculty of Economics and Business Administration,4-2-1, Kitagata, Kokuraminami-ku, Kitakyushu 802-8577 Japan. Tel & Fax:+81-93-964-4085 E-mail: [email protected] ** Graduate School of Economics Kyushu University
1. Introduction
Japanese corporate governance structures have been somewhat different from U.S. ones. Keiretsu affiliations and main banks have a major role in the Japanese corporate governance (Aoki et al., 1994; Prowse, 1992). Cross-shareholdings among listed firms have released managers from threats of hostile takeovers. Managerial compensations have given a weak incentive to maximize shareholder value to managers (Kaplan, 1994). As a result, the traditional governance structure has made managers care less about shareholder wealth.
However, the Japanese corporate governance shows a remarkable change in the late 1990s; Japanese companies adopt new governance devices
that give managers an incentive to maximize shareholder value. Since stock options are permitted in 1997, many companies have adopted options in the managerial compensation. Companies began to have outside directors to make the boards more effectively monitor managements. These changes imply that Japanese corporate governance began to care more about shareholder value.
Using Japanese data, we investigate firms’ ownership structure and operating performance changes surrounding stock option adoptions. If a firm’s corporate governance structure is optimally designed, adding a new governance device may deviate the firm’s governance structure from the optimal one; thus, the firm must adjust existing governance instruments associated with a new
11
governance device adoption. We explore whetherJapanese companies adjust their existing governance structures when adopting stock options.
There is another perspective that motivates us to analyze ownership structure changes when Japanese firms adopt stock options. Recent Japanese companies decrease cross-shareholdings that have made the managers care less about shareholder wealth; firms adopt stock options and abolish cross-shareholdings for a same reason. This fact gives rise to the prediction that firms that adopt stock options decrease cross-shareholdings more.
Finally, we investigate operating performance changes pre- and post-stock option adoptions to explore whether the Japanese corporate governance reform has a positive impact on firm performance. Kato et al. (2005) investigate firms’ operating performance changes during three years surrounding stock option adoptions; they report stock option adoptions improve firm performance. Considering that managers may have an incentive to manipulate the firms’ accounting performance upward when receiving stock options(Bartov and Mohanram, 2004), this paper extends the analytical period to seven years surrounding stock option adoptions,
Investigating changes in ownership structure and operating firm performance, we should take into account that firms tend to adopt stock options pre- or post-IPOs; IPO firms can take a significant portion of firms that adopt stock options. Previous studies detect that IPO firms tend to reduce leverage levels, change ownership structures, and experience poor long run operating performance as well as issue stock options (Hamao et al., 2000; Jain and Kini, 1994; Kutsuna et al., 2002; Mikkelson et al., 1997; Roell, 1996). The IPO firms’ characteristics may produce a spurious relation between stock option adoptions and changes in ownership structures and operating performance. Dividing firms that adopt stock options into IPO firms and non-IPO firms, we try to disentangle changes in corporate governance structures and firm performance induced by stock option adoptions from those associated with IPOs.
Our empirical results are summarized as follows. Stock option adoptions associated with IPOs account for about one-third of all stock option adoptions during 1997-2000. IPO firms that adopt stock options tend to decrease directors’ ownership levels and leverage whereas increase financial institutions’ ownership levels surrounding the first option grant years. However, these changes may not be induced directly by stock option adoptions; the results may reflect IPO firms tendencies to substantially change their leverage and ownership structures as well as issue stock options.
Non-IPO firms that adopt stock options tend to decrease financial institutions’ ownership levels less than the average whereas reduce other corporations’ ownership levels more than the average. Firms that care more about shareholder wealth decrease
cross-shareholdings as well as issue stock options. However, such firms need to keep shareholdings by financial institutions to prevent increases in agency costs of debt. These results suggest firms need to adjust existing governance instruments when adding a new governance device.
Finally, firms’ operating performance does not significantly change surrounding stock option adoptions. Our data support neither the idea that incentive effects provided by stock options improve firm performance nor the hypothesis that managers time stock option grants so that unexpectedly good performance is announced immediately after the grants.
The reminder of this paper is organized as follows. Section 2 presents a brief sketch of the traditional corporate governance and characteristics of Japanese stock options. Section 3 explains hypotheses. Section 4 describes sample selection procedures and data. Section 5 presents empirical results. Finally, section 6 summarizes this study.
2. Japanese corporate governance and stock options
Keiretsu affiliations and main banks have played an important role in the traditional Japanese corporate governance (Aoki et al., 1994; Prowse, 1992). Kaplan and Minton (1994) and Kang and Shivdasani (1997) find that main banks dispatch personnel to a firm’s board before it gets into financial crisis.1 Another feature of the traditional governance is that firms have cared less about shareholder wealth. In the Japanese stock market, cross-shareholdings among listed companies have been developed; the cross-shareholdings weaken managers’ incentive to maximize shareholder value by releasing them from treats of hostile takeovers.
Managerial compensation structures also have given managers a weaker incentive to increase shareholder wealth. In Japan, stock options have been banned for a long time. Kaplan (1994) argues that Japanese managers’ cash compensations are more sensitive to negative earnings than it is in the U.S., even though it is linked to firm performance. Kaplan also finds that the level of managerial ownership is roughly one-half than that of U.S. top executives, and one-quarter if stock options are included.
However, the Japanese governance characteristics substantially changed during the 1990s. The serious reductions of share prices and Return on Equity (ROE) raised awareness that firms should adopt shareholder wealth-oriented corporate
1
Some previous studies emphasize negative aspects of keiretsu and main bank-centered corporate governance. Weinstein and Yafeh (1998) argue that close bank ties increase availability of financing, but not profitability. Kang and Stultz (1997) report a strongly significant negative relation between the ratio of loans to total debt in 1989 and the firm’s stock return from 1990 to 1993.
12
governance. This idea make Japanese firms abolish cross-shareholdings. According to NLI Research Institute, the percentage of cross-held shares in the Japanese all stocks decreased from 18.0% in 1990 to 7.4% in 2002. In accordance, the percentage of shares held by corporations in Tokyo Stock Exchange (TSE) decreases from 73.4% in 1990 to 60.5% in 2002.2
Japanese companies also introduce some new governance devices. Firms began to adopt outside directors in their boards. Stock options were permitted by the 1997 Commercial Code amendment; then many companies adopted options in managers’ compensations. According to Daiwa Securities SMBC Co. Ltd., 1391 firms (approximately 38% all listed companies) adopted stock options as of March 2005.
To grant stock options, Japanese firms must gain approval at their shareholder meetings. Within one year from that approval, the firm can actually award options. Uchida (2005) reports that the most common exercise period is five years in his sample; no firm adopts stock options whose exercise period is over 10 years to satisfy a condition for the tax-qualified stock option. In most cases, the strike price is determined by multiplying the closing stock price at the end of the month before the grant month by 1.05.
3. Hypotheses
3.1. Stock option adoptions and existing governance devices
If a firm’s corporate governance structure is optimally designed, adding a new governance device may divert the governance structure from an optimal one. This problem should be marked for the Japanese case in which many companies simultaneously adopt stock options after the Commercial Law amendment. Stock options give managers a stronger incentive to maximize shareholder wealth. However, such an incentive may increase agency costs of debt; shareholders tend to undertake high-risk projects and forgo positive-NPV projects to transfer wealth from bondholders to shareholders (Jensen and Meckling, 1976; Myers, 1977). John and John (1993) show that optimal sensitivities of managerial compensation to performance measures decrease as firm’s leverage increases. Previous studies indicate that leverage is negatively related to the likelihood that Japanese firms grant stock options (Kato et al., 2005; Uchida, 2006). DeFusco et al. (1990) find that shareholder wealth increases and bondholder wealth decreases at the announcement of stock option adoptions. Therefore, firms may need to adjust their governance
2 Financial institutions’ ownership level decreases from 43% to
39.1% and other corporations’ ownership level declines from 30.1% to 21.5% from 1990 to 2002.
structures to reduce agency costs of debt in accordance with stock option adoptions; firms must reduce leverage when adopting stock options.
There is another perspective that derives the same hypothesis. Jensen (1986) stresses the disciplinary role of debt; debt prevents managers from undertaking negative-NPV projects by forcing managers to pay out cash flows. If incentive effects provided by stock options act as substitutes for the disciplinary role of debt, firms that adopt stock options can reduce leverage levels..
Hypothesis 1-A: Firms decrease their leverage levels surrounding stock option adoptions.
If shareholders also hold firms’ debt, the shareholders-creditors conflict may become less severe; firms can reduce agency costs of debt by increasing financial institutions’ ownership levels instead of reducing leverage. In Japan, main banks have played a role of reducing agency costs by holding both shares and debt of firms (Prowse, 1990; Fukuda and Hirota, 1996). This idea leads to another hypothesis.
Hypothesis 1-B: Firms increase financial institutions’ ownership levels surrounding their option adoptions.
3.2. Cross-shareholdings reduction and stock option adoptions
Recent Japanese companies tend to decrease cross-shareholdings that weaken managers’ incentive to maximize shareholders value. Many firms simultaneously adopt stock options to make managers care more about shareholder wealth; the abolition of cross-shareholdings and stock option adoptions are motivated by a same idea that firms should care more about shareholder wealth. This fact gives rise to the following hypothesis.
Hypothesis 2: Firms that adopt stock options decrease cross-shareholdings.
4. Sample Selection and Data
Our sample consists of firms listed on the TSE, first section. Using Nikkei NEEDS FinancialQuest Database, we collected firms that adopt stock option plans as of March 2000. We identified the year when these firms got the first approval to grant options from their annual reports. These procedures offer us 201 firms that adopt stock options during 1997 to 2000.
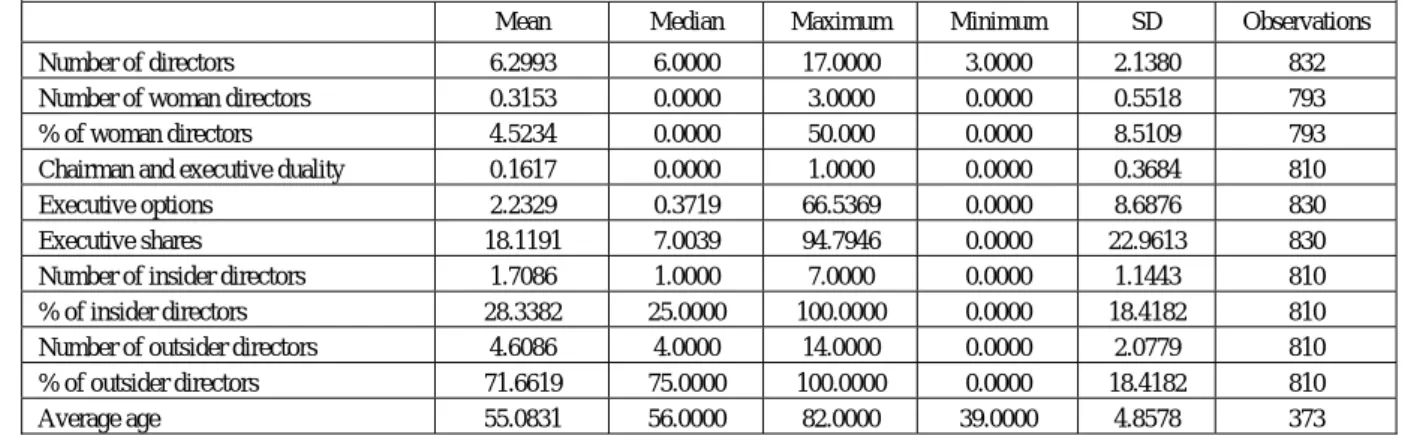
For the 201 firms, we obtained ownership structure and financial data from Nikkei NEEDS FinancialQuest. Table 1 presents descriptive statistics. Over half of our sample firms got first the approval to grant options in 2000 (Panel A). Electric appliance firms adopt stock options most frequently; it is followed by wholesale service and machinery. Panel B indicates that firms that went public after 1995 account for approximately one-third of our
13
sample firms. Likewise, about one-third of the firmsadopt stock options within three years after or before IPOs (Panel C); stock option grants by IPO firms take a significant portion of Japanese stock option adoptions during 1997-2000. We should take this fact into account when analyzing changes in corporate governance structures and operating performance.
We use two leverage measures: (a) Leverage 1 = total liabilities / total assets ratio and (b) Leverage 2 = financial liabilities / (financial liabilities and book value of equity). For testing Hypothesis 2, we adopt financial institutions’ ownership level and other corporations’ ownership level as proxies for the degree of cross-shareholdings. We adopted three measures for firms’ operating performance: (a) operating income-to-total assets ratio, (b) operating income-to-sales ratio, and (c) EBIT-to-total assets ratio.
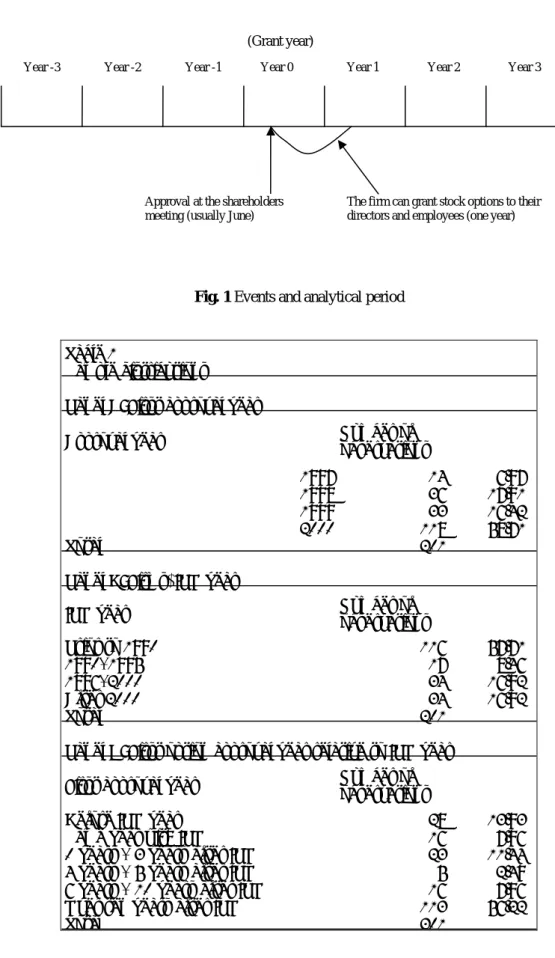
We analyze corporate governance structure and operating performance changes during seven years surrounding the grant year (See Figure 1). In most cases, firms’ fiscal year ends on March and shareholders meetings are held on June. If a firm got the first approval to grant stock options on June 2000, the firm can grant stock options from June 2000 to May 2001. In this case, we define the grant year as the fiscal year that ends on March 2001 (year 0); as shown in Figure 1, we investigate the firm’s corporate governance structures and operating performance from the fiscal year that ends on March 1998 (year -3) to the year that ends on March 2004 (year +3).
5. Empirical Results
5.1. Changes in directors’ ownership surrounding first stock option adoptions
First, we investigate changes in directors’ ownership levels surrounding stock option adoptions. Panel A of Table 2 finds the average directors’ ownership level decreases from 10.1% at year -3 to 6.4% at year 3 (median decreases from 1.9% to 1.3%). The average change from year -3 to year 1 is -3.4% (median is -0.1%) and significantly different from zero. This evidence is consistent with Kato et al. (2005) and Ofek and Yermack (1997); directors tend to sell their firms’ shares surrounding stock option grants.
Considering that managers tend to sell a significant portion of their companies’ shares when the firm goes public, the result may represent an IPO firm’ tendency to substantially change ownership structures and issue stock options; it would be important to investigate changes in directors’ ownership levels for IPO and non-IPO firms respectively to disentangle the direct effect of stock option adoptions on directors’ ownership levels from
the spurious relation produced by IPO firms’ characteristics.
We define IPO firms as companies that adopt stock options within three years after or before IPOs. There are 67 IPO firms in our sample; it accounts for one-third of the entire sample. Also, we define Non-IPO firms as companies that adopt stock options over 10 years after IPOs. This procedure offers us 113 Non-IPO firms.
Results are shown in Panels B and C of Table 2. From year -1 to year 3, IPO firms decrease directors’ ownership levels by 8.8% on average (median change is 4.4%) whereas Non-IPO firms do so by 0.4% (median change is 0.01%). This evidence suggests the finding by Kato et al. (2005) and Ofek and Yermack (1997) might represent IPO firms’ pattern; managers tend to sell a significant portion of their companies’ shares and simultaneously issue stock options when the company goes public.
The result also suggests additional incentive effects provided by stock options may be stronger for non-IPO managers than for IPO managers; stock option adoptions may increase agency costs of debt more for non-IPO firms than for IPO firms.
5.2. Leverage changes surrounding first stock option adoptions
Hypothesis 1-A predicts firms’ capital structure changes surrounding stock option adoptions. Table 3 summarizes firms’ leverage changes from year -3 to year 3.
For the entire sample, the average Leverage 1 decreases from 52.1% at year -3 to 43.3% at year 3 (median decreases from 52.3% to 42.7%). The average change from year -1 to year 3 is -4.8% (median change is -3.2%); it is significantly different from zero. Likewise, Leverage 2 decreases by 6.0% on average from year -1 to year 3 (the median reduction is 3.1%). Panels B and C of Table 3 indicate that both IPO and Non-IPO firms tend to decrease their leverage levels.
It would be important to analyze industry adjusted leverage levels because the average Japanese company tends to decrease leverage during the late 1990s.
Table 4 reports changes in the industry adjusted leverage (subtract the industry median leverage from the raw variable).3 The average sample firm increases the industry adjusted Leverage 1 by 1.4% from year -1 to year 3 (median increase is 2.4%). Likewise, the adjusted Leverage 2 increases by 3.7% from year -1 to year 3; it is significantly different from zero.
3 The industry adjusted leverage is negative and significantly
different from zero through the analytical period; it is consistent with the finding by Kato et al. (2005) and Uchida (2005) that leverage levels are negatively associated with the likelihood that firms adopt stock options.
14
The evidence suggests firms that adopt stock options decrease their leverage levels less than the average; it contradicts Hypothesis 1-A. This finding is more pronounced for Non-IPO firms (Panel C of Table 4). The average Non-IPO firms’ Leverage 1 (industry adjusted) increases from -6.2% at year -3 to -1.1% at year 3. The average sample firm increases the adjusted Leverage 1 by 3.7% from year -1 to year 3 (median increase is 3.5%); it is statistically significant at the 1% level. Hypothesis 1-A is not supported for Non-IPO firms.
A possible interpretation of this finding would be that firms that adopt stock options tend to have more growth opportunities; thus, it is difficult for such firms to substantially decrease leverage levels. Many previous studies argue that market-to-book ratio is positively associated with the likelihood that firms adopt stock options (Baber et al., 1996; Gaver and Gaver, 1993; Kato et al., 2005; Mehran, 1995; Ryan and Wiggins, 2001; Smith and Watts, 1992). Thus, we predict firms that adopt stock options can not reduce leverage because they need to spend cash flows in business projects rather than in repaying their debt. For testing this prediction, we compute percentage changes in fixed assets from year -1 to year 3 and relate it to the leverage change. Specifically, we equally divide Non-IPO firms into two groups according to the change in leverage and compare fixed assets changes between the two groups. Industry adjusted variables are used both for the changes in leverage and fixed assets.
Results are summarized in Table 5. Panel A reports Non-IPO firms that increase Leverage 1 more than the median increase fixed assets by 10.6% on average whereas Non-IPO firms that increase Leverage 1 less than the median decrease fixed assets by 1.5%; the difference in the fixed assets change is statistically significant at the 5% level. Panel B shows a similar result though the statistical significance levels are marginal.
Panel C reports correlation coefficients between the changes in leverage and fixed assets; the correlations are positive and statistically significant. This evidence suggests non-IPO firms that adopt stock options tend less to decrease leverage because they have more growth opportunities; thus, Hypothesis 1-A is not supported. Non-IPO firms need to adjust other governance instruments to prevent increases in agency costs of debt when adopting stock options.
On marked contrast, Panel B shows the average IPO firm decreases the industry adjusted Leverage 1 from -7.0% at year -3 to -17.9% at year 3 (median decreases from -5.6% to -19.1%). The average Leverage 1 reduction from year -1 to year 3 is -2.9%; it is significantly different from zero (median change is -1.8%).
The result may be produced by an IPO firms’ tendency to substantially decrease leverage as well
as issue stock options (Roell, 1996); it may not induced directly by stock option adoptions.
5.3. Changes in financial institutions’ and other corporations’ ownership
5.3.1. Financial institutions’ ownership levels
Non-IPO firms tend less to decrease directors’ ownership levels and leverage when adopting stock options. Thus, Non-IPO firms need to increase shareholdings by financial institutions to prevent increases in agency costs of debt (Hypothesis 1-B). Table 6 describes percentage changes in financial institutions’ and other corporations’ ownership levels (raw variables). Panel A (results for the entire sample) indicates the sample firms seems not to substantially change raw financial institutions’ ownership levels; the average change from year -1 to year 3 is 0.8% (median is 0.4% increase).
Panels B and C of Table 6 reports ownership structure changes for IPO firms and Non-IPO firms, respectively. The average IPO firm significantly increases the financial institutions’ ownership level. It may reflect the Japanese IPO firms’ pattern; firms tend to increase banks’ ownership levels following IPOs (Hamao et al., 2000; Kutsuna et al., 2002). On the other hand, the average Non-IPO firm significantly decreases raw financial institutions’ ownership levels. Considering that the average Japanese firm decreases the financial institutions’ and other corporations’ ownership level during the late 1990s, it would be necessary to analyze whether sample firms increase (decrease) the ownership levels than the TSE average. We make variables above the TSE mean (subtract the TSE mean from the raw ownership variable) and trace the adjusted variables’ change (Table 7).
Panel A of Table 7 shows the average financial institutions’ ownership level increases from -9.1% (median is 8.1%) at year 3 to 2.3% (median is -2.8%).4 The average change from year -1 to year 3 is positive (5.6%) and significantly different from zero at the 1% level; it is consistent with Hypothesis 1-B.
The result might be earned by a Japanese IPO firms’ tendency to substantially increase banks’ ownership levels after IPOs (Hamao et al., 2000; Kutsuna et al., 2002). For disentangling ownership structure changes induced by stock option adoptions from those associated with IPOs, we conduct a same test for IPO and Non-IPO firms, respectively (Panels B and C of Table 7). Both IPO and Non-IPO firms significantly increase financial institutions’ ownership levels (above the TSE mean). The
4 Financial institutions’ ownership level at year -1 is -7.8% on
average (median is -7.4%); it is significantly different from zero. This figure suggests that firms with lower financial institutions’ ownership level tend to adopt stock options; it is consistent with Kato et al. (2005).
15
IPO’s firms’ finding supports Hypothesis 1-B thoughthe IPO firms’ result may be produced by the Japanese IPO firms’ tendency. Non-IPO firms need to decrease shareholdings by financial institutions less than the average to prevent increases in agency costs of debt.
5.3.2. Other corporations’ ownership levels
Hypothesis 2 predict firms that care more about shareholder wealth may decrease cross shareholdings as well as adopt stock options. Panel A of Table 6 reports the sample firms substantially decrease shareholdings by other corporations (raw variable); the other corporations’ ownership level decreases from 25.2% at year -3 to 20.7 % at year 3. The change from year 1 to year 3 is 2.8% (median is -3.0%). Panels B and C of Table 6 find both IPO and Non-IPO firms significantly decrease other corporations’ ownership levels (raw variable) surrounding stock option adoptions. The result keeps unchanged when using the variable above the TSE mean (Panel A of Table 7). Considering that Non-IPO firms may be encumbered by cross-shareholdings, the Non-IPO firms’ result is consistent with Hypothesis 2; firms that care more about shareholder wealth tend to decrease cross-shareholdings more than the average as well as adopt stock options. We conduct a same test for keiretsu firms to check the robustness of this interpretation. Other corporations’ ownership levels of keiretsu firms may represent the degree of cross-shareholdings may more accurately; the variable of Non-IPO firms sometimes includes corporate block shareholders. Each sample firm’s keiretsu affiliation is obtained from Keiretsu no Kenkyu. We define keiretsu firms as companies that belong to a six major keiretsu group (Mitsui, Mitsubishi, Sumitomo, Fuyo, Sanwa, and Dai-ichi Kangyo) in the Keiretsu
no Kenkyu. Results for keiretsu firms are shown in
Table 8. Panels A and B of Table 8 show keiretsu firms significantly decrease other corporations’ ownership levels. Keiretsu firms that adopt stock options decrease cross-shareholdings with other corporations more than the average; the evidence is consistent with Hypothesis 2.
Table 8 also finds keiretsu firms significantly increase the adjusted financial institutions’ ownership levels whereas decrease the raw variable. Keiretsu firms decrease shareholdings by financial institutions less than the average; it is consistent with Hypothesis 1-B. Overall, non-IPO firms or keiretsu firms that care more about shareholder wealth tend to decrease cross-shareholdings with other corporations more than the average as well as adopt stock options. However, such firms decrease shareholdings by financial institutions less than the average to prevent increases in agency costs of debt. These firms seem
to adjust ownership structures along with adopting stock options.
5.4. Stock option adoptions and operating performance
Finally, we analyze operating performance changes surrounding stock option adoptions. We report only industry adjusted performance measures (subtract the industry median from the raw performance variable). Results for the entire sample are described in Panel A of Table 9. The average firm achieves almost same operating income-to-total assets ratio at years -3 and 3. The average change from year 1 to year 3 is -0.3% (median change is -0.1%); it is not statistically significant. The other performance measures do not show a significant increase surrounding the grant years. The results might be caused by IPO firms’ characteristics; Previous studies report that firms experience poor long-run performance following IPOs (Jain and Kini, 1994; Kutsuna et al., 2002; Mikkelson et al., 1997). Disentangling the effect of stock option adoptions on firm performance from the impact of IPO firms, we conduct a same test for IPO and Non-IPO firms, respectively (Panels B and C of Table 9). Panels B and C show no significant change in the three performance measures both for IPO and Non-IPO firms. Our data do not find a positive effect of stock option adoptions on firms’ operating performance. Table 9 also shows no substantial change in operating performance from year -1 to year 1; it is inconsistent with Kato et al. (2005).5 Our data do not support the idea that managers time stock option grants so that unexpectedly good performance is announced immediately after the option grants.
6.1. Concluding Remarks
The Japanese corporate governance shows a remarkable change in the late 1990s; Japanese companies adopt stock options in their managerial compensations and decrease cross-shareholdings. These changes mean that Japanese corporate governance began to care more about shareholder wealth. Using Japanese data, we investigate changes in firms’ leverage, ownership structures, and operating performance surrounding stock option adoptions. Our empirical results are summarized as follows. Stock option adoptions associated with IPOs account for about one-third of all stock option adoptions during 1997-2000. IPO firms that adopt stock options tend to decrease directors’ ownership levels and leverage whereas increase financial institutions’ ownership levels surrounding the first option grant year. These changes may not be induced
5 It can be attributed to the difference in the sample coverage.
Kato et al. collect stock option adoptions during 1997 to 2001. Also, Kato et al. adopt additional stock option adoptions by a same company whereas we focus on firms’ first stock option adoptions.
16
directly by stock option adoptions; the results reflect IPO firms tendencies to substantially change their leverage and ownership structures as well as issue stock options. Non-IPO firms that adopt stock options tend to decrease financial institutions’ ownership levels less than the average whereas reduce other corporations’ ownership levels more than the average. Firms that care more about shareholder wealth tend to decrease cross-shareholdings as well as issue stock options. However, such firms need to keep shareholdings by financial institutions to prevent increases in agency costs of debt. These results suggest that firms need to adjust existing governance instruments when adding a new governance device.
Finally, firms’ operating performance shows no significant change surrounding stock option adoptions. Our data support neither the idea that incentive effects provided by stock options improve firm performance nor the hypothesis that managers time stock option grants so that unexpectedly good performance is announced immediately after the grants.
References
1. Aoki, M., H. Patrick, and P. Sheard, (1994). The Japanese main bank system: An introductory overview. In The Japanese main bank system: Its
relevance for developing and transforming economies, edited by M. Aoki and H. Patrick,
Oxford: Oxford University Press, 3-50.
2. Bartov, E. and P. Mohanram (2004) Private Information, Earnings Manipulations, and Executive Stock-Option Exercises. Accounting
Review,79, 889-920.
3. Baber, W.R., S.N. Janakiraman, and S-H Kang. (1996) Investment opportunities and the structure of executive compensation. Journal of
Accounting and Economics, 21, 297-318.
4. DeFusco, R.A., R.R. Johnson, & T.S. Zorn (1990) The effect of executive stock option plans on stockholders and bondholders. Journal of
Finance, 45, 617-627.
5. Fukuda, A. and S. Hirota. (1996) Main bank relationships and capital structure in Japan.
Journal of the Japanese and International Economies, 10, 250-261.
6. Gaver, J.J. and K.M. Gaver. (1993) Additional evidence on the association between the investment opportunity set and corporate financing, dividend, and compensation policies.
Journal of Accounting and Economics, 16, 125-160. 7. Hamao, Y., F. Packer, and J.R. Ritter (2000)
Institutional affiliation and the role of venture capital: Evidence from initial public offerings in Japan. Pacific-Basin Finance Journal, 8, 529-558. 8. Jain, B.A. and O. Kini (1994) The post-issue
operating performance of IPO firms. Journal of
Finance, 49, 1699-1726.
9. Jensen M.C. (1986) Agency costs of free cash flow, corporate finance, and takeovers. American
Economic Review, 76, 323-329.
10. Jensen, M. C. and W.H. Meckling. (1976) Theory of the firm: Managerial behavior, agency costs and ownership structure. Journal of
Financial Economics, 3, 305-360
11. John, T.A. and K. John. (1993) Top-management compensation and capital structure. Journal of
Finance, 48, 949-974.
12. Kang, J-K. and A. Shivdasani (1997) Corporate restructuring during performance declines in Japan, Journal of Financial Economics,46,29-65. 13. Kang, J-K. and R.M. Stultz (2000) Do banking shocks affect borrowing firm performance? An analysis of the Japanese experience. Journal of
Business, 73, 1-23.
14. Kaplan, S.N. (1994) Top executive rewards and firm performance: A comparison of Japan and the United States. Journal of Political Economy, 102, 510-546.
15. Kaplan, S.N. and B.A. Minton. (1994) Appointments of outsiders to Japanese boards: Determinants and implications for managers.
Journal of Financial Economics, 36, 225-258.
16. Kato, H., L. Michal, L. Mi, and S. James (2005) An empirical examination of costs and benefits of executive stock options: Evidence from Japan.Journal of Financial Economics, 78, 435-461. 17. Kutsuna, K., H. Okamura, & M. Cowling (2002) Ownership structure pre- and post-IPOs and the operating performance of JASDAQ companies.
Pacific-Basin Finance Journal, 10, 163-181. 18. Mikkelson, W.H., M.M. Partch, and S. Kshitij
(1997) Ownership and operating performance of companies that go public. Financial Economics, 44, 281-307.
19. Mehran, H. (1995) Executive compensation structure, ownership, and firm performance.
Journalof Financial Economics,38,163-184.
20. Myers, S.C. (1977) Determinants of corporate borrowing. Journal of Financial Economics, 5. 21. Ofek, E. and D. Yermack (2000) Taking stock:
Equity-based compensation and the evolution of managerial ownership. Journal of Finance, 55, 1367-1384.
22. Prowse, S.D. (1990) Institutional investment patterns and corporate financial behavior in the United States and Japan. Journal of Financial
Economics, 27, 43-66.
23. Prowse, S.D. (1992) The structure of corporate ownership in Japan. Journal of Finance, 47. 24. Roell, A. (1996) The decision to go public: An
overview. European Economic Review, 40, 1071-1081.
25. Ryan,H.E.J.& R.A.Wiggins.(2001)The influence of firm- and manager-specific characteristics on the structure of executive compensation. Journal
of Corporate Finance, 7, 101-123.
26. Smith, C.W.J. and R.L. Watts. (1992) The investment opportunity set and corporate financing, dividend, and compensation policies.
Journal of Financial Economics, 32, 263-292.
27. Uchida, K. (2005) Determinants of stock option use by Japanese companies. Review of Financial
Economics, forthcoming.
28. Weinstein, D.E. and Y. Yafeh (1998) On the costs of a bank-centered financial system: Evidence from the changing main bank relations in Japan. Journal of Finance, 53, 635-672.
17
AppendicesFig. 1 Events and analytical period
Table 1
Sample distributions Panel A: First approval year
Approval year Number ofobservations
1997 14 6.97%
1998 36 17.91%
1999 33 16.42%
2000 118 58.71%
Total 201
Panel B: Firms' IPO year
IPO year Number ofobservations
Prior to 1990 116 57.71%
1990- 1995 17 8.46%
1996- 2000 34 16.92%
After 2000 34 16.92%
Total 201
Panel C: First option approval year relative to IPO year First approval year Number ofobservations
Before IPO year 28 13.93%
Same year with IPO 16 7.96%
0 years - 3 years after IPO 23 11.44%
4 years - 5 years after IPO 5 2.49%
6 years - 10 years after IPO 16 7.96%
Over ten years after IPO 113 56.22%
Total 201
Approval at the shareholders meeting (usually June)
Year 1 Year 2 Year 3
Year -1 Year -2
The firm can grant stock options to their directors and employees (one year) Year 0
Year -3
18
Table 3
Leverage changes surrounding first stock option adoptions Panel A: Entire sample
Year relative to the first option grant year - 3 - 2 - 1 0 1 2 3 Year 3 -Year - 1
Leverage 1 = total liabilities / total assets
Mean 52.10% 50.48% 48.11% 46.95% 46.01% 45.29% 43.30% - 4.81%
Median 52.26% 51.19% 49.01% 47.99% 45.79% 44.50% 42.72% - 3.18%
Number of observations 201 201 201 201 201 201 201 201
t- statistics - 6.72 * * *
Wicoxon Test - 6.23 * * *
Leverage 2 = financial liabilities / (equity + financial liabilities)
Mean 33.98% 32.99% 30.23% 28.19% 27.61% 26.69% 24.19% - 6.04%
Median 30.86% 31.25% 30.73% 27.18% 23.77% 24.21% 19.78% - 3.12%
Number of observations 201 201 201 201 201 201 201 201
t- statistics - 7.68 * * *
Wicoxon Test - 7.33 * * *
Panel B: IPO firms
Year relative to the first option grant year - 3 - 2 - 1 0 1 2 3 Year 3 -Year - 1
Leverage 1 = total liabilities / total assets
Mean 56.70% 52.36% 46.07% 42.58% 40.97% 39.61% 36.97% - 9.10% Median 59.47% 52.75% 48.49% 43.14% 40.32% 38.54% 35.32% - 7.90% Number of observations 67 67 67 67 67 67 67 67 t- statistics - 6.11 * * * Wicoxon Test - 5.38 * * * Table 2(Continued) Median 0.46% 0.43% 0.45% 0.39% 0.39% 0.40% 0.41% - 0.01% Number of observations 113 113 113 113 113 112 113 113 t- statistics - 2.79 * * * Wicoxon Test - 2.14 * *
* : Significant at the 10% level. * * : Significant at the 5% level. * * * : Significant at the 1%level.
This table shows sample firms' percentage changes in directors' ownership levels surrounding the first stock option grant year. IPO firms are companies that adopt stock options within three years after IPOs or before IPOs. Non- IPO firms are companies that adopt stock options over 10 years after IPOs. T- statistics test the null hypothesis that the variable's average change from year - 1 to year 3 is zero. Wilcoxon test is for the null hypothesis that the variable's median change from year - 1 to year 3 is zero.
Table 2
Percentage change in directors' ownership Panel A: Entire sample
Year relative to the first option grant year - 3 - 2 - 1 0 1 2 3 Year 3 -Year - 1 Directors' ownership level
Mean 10.10% 8.92% 9.51% 8.12% 7.54% 6.77% 6.35% - 3.44%
Median 1.92% 1.97% 1.66% 1.32% 1.41% 1.34% 1.30% - 0.08%
Number of observations 191 195 198 200 201 200 201 198
t- statistics - 5.05 * * *
Wicoxon Test - 6.76 * * *
Panel B: IPO firms
Year relative to the first option grant year - 3 - 2 - 1 0 1 2 3 Year 3 -Year - 1 Directors' ownership level
Mean 26.18% 21.78% 23.18% 19.33% 17.87% 15.93% 14.87% - 8.78%
Median 21.52% 18.04% 16.39% 16.03% 12.28% 11.53% 10.80% - 4.44%
Number of observations 57 61 64 66 67 67 67 64
t- statistics - 4.79 * * *
Wicoxon Test - 5.85 * * *
Panel C: Non- IPO firms
Year relative to the first option grant year - 3 - 2 - 1 0 1 2 3 Year 3 -Year - 1 Directors' ownership level
19
Table 4
Industry adjusted leverage changes surrounding first stock option adoptions Panel A: Entire sample
Year relative to the first option grant year - 3 - 2 - 1 0 1 2 3 Year 3 -Year - 1 Leverage 1 = total liabilities / total assets
Mean - 8.70% - 9.91% - 10.06% - 9.20% - 8.10% - 7.90% - 8.71% 1.35% Median - 6.02% - 8.66% - 10.96% - 8.89% - 8.47% - 7.75% - 9.76% 2.40% Number of observations 201 201 201 201 201 201 201 201 t- statistics 1.75 * Wicoxon Test - 2.92 * ** Leverage 2 = financial liabilities / (equity + financial liabilities)
Mean - 6.47% - 6.97% - 6.05% - 4.79% - 2.72% - 1.56% - 2.36% 3.69% Median - 6.26% - 6.25% - 5.81% - 5.91% - 4.48% - 3.22% - 5.16% 4.35% Number of observations 201 201 201 201 201 201 201 201 t- statistics 4.12 * ** Wicoxon Test - 4.90 * ** Panel B: IPO firms
Year relative to the first option grant year - 3 - 2 - 1 0 1 2 3 Year 3 -Year - 1 Leverage 1 = total liabilities / total assets
Mean - 6.96% - 11.09% - 14.95% - 16.06% - 15.52% - 16.09% - 17.85% - 2.90% Median - 5.58% - 11.91% - 16.23% - 17.17% - 14.97% - 16.20% - 19.06% - 1.95% Number of observations 67 67 67 67 67 67 67 67 t- statistics - 2.02 * * Wicoxon Test - 1.80 * Table 3(Continued)
Leverage 2 = financial liabilities / (equity + financial liabilities)
Mean 38.88% 34.27% 28.20% 23.79% 22.67% 20.72% 17.64% - 10.57% Median 36.53% 30.40% 27.38% 19.41% 17.97% 12.97% 8.52% - 8.13% Number of observations 67 67 67 67 67 67 67 67 t- statistics - 6.22 * * * Wicoxon Test - 5.38 Panel C: Non- IPO firms
Year relative to the first option grant year - 3 - 2 - 1 0 1 2 3 Change fromyear - 1 to year 3 Leverage 1 = total liabilities / total assets
Mean 52.63% 52.15% 51.44% 51.47% 51.02% 50.62% 48.99% - 2.45% Median 52.26% 52.04% 51.01% 50.84% 49.39% 48.58% 46.73% - 1.13% Number of observations 113 113 113 113 113 113 113 113 t- statistics - 3.13 * * * Wicoxon Test - 2.60 Leverage 2 = financial liabilities / (equity + financial liabilities)
Mean 34.17% 34.92% 33.49% 32.53% 32.32% 32.20% 29.91% - 3.58% Median 30.95% 32.61% 32.53% 30.37% 30.48% 30.89% 28.38% - 2.29% Number of observations 113 113 113 113 113 113 113 113 t- statistics - 4.27 Wicoxon Test - 4.05
* : Significant at the 10% level. * * : Significant at the 5% level. * * * : Significant at the 1%level.
This table shows sample firms' leverage changes surrounding the first stock option grant year. IPO firms are companies that adopt stock options within three years after IPOs or before IPOs. Non- IPO firms are companies that adopt stock options over 10 years after IPOs. T- statistics test the null hypothesis that the variable's average change from year - 1 to year 3 is zero. Wilcoxon test is for the null hypothesis that the variable's median change from year - 1 to year 3 is zero.