Analyses on physical mechanism of holographic
recording in phenanthrenequinone-doped
poly
„
methyl methacrylate
…
hybrid materials
Yi-Nan Hsiao Wha-Tzong Whang
National Chiao Tung University Department of Materials Science and
Engineering
HsinChu 30050, Taiwan
Shiuan Huei Lin,MEMBER SPIE National Chiao Tung University Department of Electrophysics HsinChu 30050, Taiwan E-mail: [email protected]
Abstract. The photoproducts in phenanthrenequinone (PQ)-dissolved
methyl methacrylate (MMA) liquid samples and PQ-doped poly(methyl methacrylate) (PQ/PMMA) solid photopolymer samples have been ana-lyzed by various chemical measurements. A mechanism for holographic recording in our PQ/PMMA photopolymer is proposed. By UV-VIS trans-mission and photoluminescence spectral measurements, we find that under light exposure the molecular structure of PQ is transformed to be less conjugated. The measured results of mass spectra, Fourier trans-form infrared spectra, NMR spectra, and gel permeation chromatograph analyses provide some evidence for recognizing the molecular structure of the photoproducts in our PQ/PMMA photopolymers. The results show that under light exposure the PQ and MMA form new molecules, mainly an adduct of one PQ molecule with one MMA molecule. In addition, PQ also reacts as a photoinitiator to form PMMA oligomers in our samples. The structure change of the PQ molecule induces a strong change of the refractive index in the material. It provides a mechanism to record a phase hologram in our PQ/PMMA photopolymer. Holographic recordings in the samples are demonstrated, and the dynamic range of the sample is investigated. © 2004 Society of Photo-Optical Instrumentation Engineers.
[DOI: 10.1117/1.1774196]
Subject terms: phenanthrenequinone; methyl methacrylate; polymethyl meth-acrylate; holographic recording; volume hologram.
Paper VHOE-S10 received Apr. 12, 2004; accepted for publication May 17, 2004.
1 Introduction
Holographic data storage has been considered one of the promising information storage technologies because of its distinct advantages of large storage capacity and fast data access rate. In recent years many research efforts have been invested on this topic and rapid progress has been achieved. Several holographic data storage systems with very large storage capacities, high data readout rates, and low bit error rates have been demonstrated.1,2However, before this tech-nology can be successful for practical applications there are several fundamental issues necessary to be resolved. One of the fundamental issues is the lack of suitable recording ma-terial.
To be good holographic data storage material, many characteristics are required, such as high optical sensitivity, simple development procedures, uniform spatial frequency response, large diffraction efficiency, high optical quality, and long-term stability. For volume holographic storage us-ing thick materials, good optical quality and dimensional stability are the most crucial requirements. Among the cur-rent recording materials, photopolymer materials are the most popular and suitable for the holographic write-once-read-only-memory 共WORM兲 system. Many experimental works have been demonstrated about the feasibility of us-ing polymer-based materials for holographic data storage.3–10 These materials can provide large modulation in refractive index, and they are easy to fabricate because
dedicated crystal growing facilities are not required. On the other hand, they also have some disadvantages. Among them, the material shrinkage effect induced by holographic recording is the most serious. This effect will induce di-mensional distortions on the recorded gratings so that the Bragg condition for volume holograms is lost and the re-corded information cannot be retrieved completely.11 The shrinkage effect is to some extent proportional to the ma-terial thickness. As a result, a typical thickness of conven-tional photopolymer material is limited to a few hundred microns.
By using a prepolymerization technique, we have suc-ceeded in making phenanthrenequinone 共PQ兲 dye-doped poly共methyl methacrylate兲 共PMMA兲 photopolymers, which have a very attractive optical quality and negligible photo-induced shrinkage.12,13Our idea for alleviating the shrink-age problem was to separate the photochemical reaction during holographic recording from the polymerization of the host monomer molecules during material preparation. Based on this idea, we investigated the technique to syn-thesize a photoploymer material, so that a polymer matrix is used for supporting the binder matrix and only the doped molecules are used as the photosensitive elements to form the refractive index holograms. The key is how to ensure the photoreaction of the doped PQ molecules during holo-graphic recording without affecting the backbone structure of the PMMA matrix. In fact, during holographic exposure it requires corresponding components to take part in
pho-toreaction with PQ molecules. A possible component for this function would be MMA monomers. Therefore, our technique is to control the environmental parameters for material preparation such that most of the monomer mol-ecules are polymerized, and only the necessary percentage of unreacted monomer molecules are left for later photore-action during the holographic recording stage. After a series of experiments, we have found a two-step procedure that can synthesize bulk samples with satisfactory optical quality.12 Investigations show that environmental param-eters have a strong influence on photopolymer characteris-tics. A comparison of the recording mechanisms has been made between the different photopolymers grown by di-verse fabricated ways from the viewpoint of optical record-ing behaviors.14 In addition, characteristics of photo- and thermo-reactions of PQ molecules with olefin-based mol-ecules have been studied.15 The results show that during light exposure of the photopolymer material the o-quinones on the PQ molecules may bond to the olefins on the MMA molecules. Under photo- and/or thermo-reactions, four dif-ferent routes might be taken in the form of one PQ mol-ecule to one MMA molmol-ecule bonding structure, as shown in Fig. 1. These four routes all lead the PQ molecules to be-come less conjugated, so that the refractive index of the photopolymer can be changed via photo-induced chemical reaction. However, these four photoproducts have different chemical properties such that the stability and change of the refractive index change of the photopolymer samples after light exposure are different. We need more evidence to un-derstand photochemical behavior in our PQ-doped PMMA photopolymers. This information can also provide the de-tails about the holographic recording mechanism.
We report investigations on chemical analyses of our PQ/PMMA samples under light exposure and unexposure conditions. We first briefly review the photopolymer sample preparation method. We then present chemical
analyses for unexposed and exposed samples, both in PQ-doped PMMA solids and PQ-dissolved MMA liquids. These results give us direct observations about the photo-chemical process, including the behaviors of the o-quinones on PQ molecules and the olefins on MMA molecules. Based on these analyses, an optical recording mechanism in our PQ/PMMA sample is then proposed. The holographic recording characteristics are also studied and discussed. 2 Experimental Description
2.1 Material Preparation
The chemical dye molecule 9,10-phenanthrenequinone
共PQ兲, was purchased from Aldrich Chemical Company.16 The thermo-initiator, 2,2-azo-bis-isobutyrolnitrile 共AIBN兲, was bought from Showa.17 The monomer, methyl meth-acrylate 共MMA兲, was bought from Lancaster Company.18 To remove the stabilizer from the monomer, the mixture solution of MMA and stabilizer was separated by a vapor-izing approach, by which we heated and stirred the mono-mer to form a gas phase under low pressure. The vapor flew through a cooling tube to form a purified MMA liquid. 2.1.1 Photopolymer fabrication
The PQ molecules were dissolved into the MMA solvent with the weight ratio of 0.7 wt%, which is the saturation concentration. The AIBN molecules of 1 wt% by weight were added. It plays the role of thermal initiator to turn MMA monomers into PMMA polymers. The compound so-lution was stirred about 24 h under constant temperature at 30°C until the solute was dispersed and mixed well. We then used a filter with a hole size of 0.2m to further filter out impurities from the solution. The filtered solution was used to make samples in two stages. In the first stage, it was stirred at 30°C for around 60 h until the solution turned highly viscous. In the second stage, the solution was then poured into a glass cell and baked at 40°C for 3 days. This procedure could induce most of the MMA molecules to be polymerized. This two-step procedure was found to pro-duce bulk samples with good optical quality. Our samples appear to be a yellowish color, with a clear optical trans-mission. In fact, depending on the temperature for polymer-ization, the concentration of residual monomer MMA is varied. By use of a thermal gravimetric analysis method, our samples are analyzed to contain around 10% MMA in the photopolymer. After examining the UV-absorption spectrum of the samples, an argon laser with wavelength 514 nm is chosen as the light source for exposure and ho-lographic recording experiments.
2.1.2 Sample preparations
We have performed chemical analyses on the photoprod-ucts of four different samples: the PQ-doped PMMA solid samples 共PQ/PMMA兲, and the PQ-dissolved MMA liquid samples 共PQ/MMA兲, both under light exposed and unex-posed conditions. For the exposure, a laser with intensity of 150 mw/cm2is used to illuminate samples until the color is changed from yellow to transparent, which means the pho-tosensitizers 共PQ molecules兲 have been exhausted. Com-parison of exposed and unexposed samples allow us to identify possible photoreactions in these samples. Further-more, to investigate if light exposure could induce photo-Fig. 1 The four different ways to combine a phenanthrenequinone
polymerization in our samples, we compared chemical analyses on PQ/MMA and PQ/PMMA samples.
During the chemical analyses, the large volume of MMA solvent of the PQ/MMA samples produces a strong back-ground signal. To eliminate this backback-ground, the unreacted MMA solvent should be removed from the samples before performing chemical analyses. We have achieved this by putting the samples into a vacuum (⬃0.1 torrs) ovens and baked for 7 days at 40°C.
2.2 Photochemical Measurements
We have performed six chemical measurements to investi-gate the photoreaction in our samples. They are described as follows: 1. UV-VIS spectra of the exposed and unex-posed PQ/PMMA samples were measured by using a Hitachi-U2000. This helps us to know the sensitive wave-lengths of our samples as well as the change of conjugation structure of the chemical compounds in the samples. 2. Photoluminecence 共PL兲 spectra measurement of both the PQ/PMMA and PQ/MMA samples were performed by a Hitachi E4500, under exposed and unexposed conditions. This could help us judge the structure change of the chemi-cal compounds under light exposure. In the experiments, the photoproducts of PQ/MMA were resolved with chloro-form and poured into a quartz cell. 3. Mass spectra of the PQ/PMMA and PQ/MMA samples were obtained by using a VG Biotech TRIO-2000, under light exposed and unex-posed conditions. It provides information about the molecu-lar weight of the compounds and tells us if there is any new compound produced by light exposure. 4. Infrared spectra of the PQ, MMA, and exposed PQ/MMA samples were carried out with a Nicolet Prote´ge´-460 Fourier transform infrared spectrophotometer. It provides information about functional groups of the molecule structure. Before mea-surement, the exposed PQ/MMA solutions were dipped on KBr plates. The plate samples were baked at 40°C for 7 days such that the unreacted MMA molecules were re-moved and the pure photoproducts were left on the KBr plates. 5. 1H- and13C-NMR spectrum of the exposed PQ/ MMA sample was measured by using Varian unity-300. To fit in the instrument, the dried photoproducts from the ex-posed PQ/MMA liquid were dissolved in dimethyl sulfoxide-d6 共d-DMSO兲 solvent and poured into a glass tube. This measurement provides information about the hydrogen-bond compounds and ascertains the molecular structure. 6. The molecular weight distributions of the ex-posed PQ/MMA, unexex-posed PQ/PMMA, and exex-posed PQ/ PMMA samples were measured by using a gel permeation chromatographer共GPC兲 Waters 2414. The GPC analysis is usually utilized to measure the molecular weight of a poly-mer and identify the degree of purity of the polypoly-mer sample. The measurement provides information about whether a photoinduced polymerization occurs in our samples. In the measurements, tetrahydrofuran共THF兲 was used as the solvent to dissolve the exposed and unexposed PQ/PMMA solid samples.
2.3 Holographic Measurements
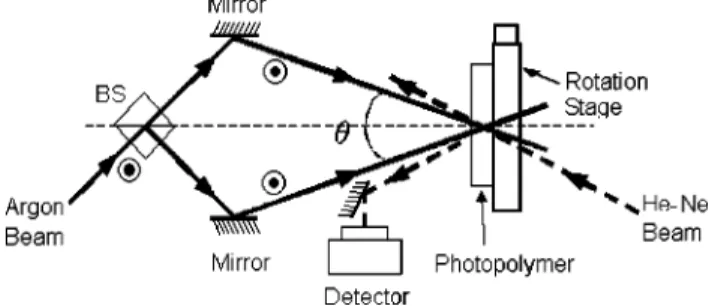
For holographic characteristic measurements, an optical setup of typical nondegenerate four-wave mixing has been constructed, as shown in Fig. 2. A collimated light beam from an argon laser with a wavelength of 514 nm was
divided into two beams. They are incident onto the sample symmetrically with an intersection angle of 32 deg outside the sample. The diffraction efficiency of the hologram was measured in real time by use of a weak 632.8-nm He-Ne laser beam at the Bragg-matched angle. The argon laser is a Coherent Innova 300 and the He-Ne laser is a JDS 1144P. In addition, for measurements of the dynamic range, the sample was placed on a rotational stage to perform peristrophical multiplexing for recording multiple holo-grams.
3 Results and Discussions 3.1 Photochemical Measurements 3.1.1 UV-VIS spectra measurements
In the experiments of UV-VIS spectra, we measured the optical absorption spectrum of the PQ/PMMA with differ-ent thicknesses. Typical optical absorption of our samples before and after exposure under a green light 共514 nm兲 is shown in Fig. 3. Before light exposure, the samples possess strong absorption below the blue wavelength (⬍450 nm). At 514-nm wavelength, the absorption coefficient is
⬃2.7 cm⫺1. The samples are totally transparent for wave-lengths longer than 540 nm. The results show that our samples are sensitive to the green light of 514 nm and so this wavelength is suitable for holographic recording. After exposure with 514-nm illumination, the absorption band shows a blue shift and the samples have absorption only in Fig. 2 The optical setup for holographic recording characteristics measurements.
Fig. 3 The UV-VIS absorption spectra of the PQ/PMMA sample with thickness of 1 mm.
the UV regime (⬍400 nm). This result implies that the structures of the photoproducts become less conjugated than those of the original material.
3.1.2 Photoluminescence spectra measurements In our measurements, a light source of 300-nm wavelength was used for the excitation. Figure 4共a兲 shows the PL tra for PQ/MMA samples. The result shows that the spec-trum of the exposed sample has stronger luminescence in-tensity. It is known that the fluorescence of our PQ/MMA sample mainly results from light-excited PQ molecules. However, for unexposed samples, the well-conjugated PQ molecule has two carbonyl functional groups and is highly coplanar. This molecular structure cause the excited PQ molecules to have strong interaction with other PQ mol-ecules. When the excited PQ molecules transfer from the excited state to the ground state, the released energy is ab-sorbed by the interactions between PQ molecules and trans-ferred into thermal energy. Thus, the excited PQ molecules cannot release energy through radiation such that the inten-sity of the fluorescence spectrum becomes weak. Under
light exposure, the carbonyl functional group on the PQ molecule has been broken and attached with the vinyl group on the MMA molecule, turning into aromatic ester. In this case, the molecular structure of photo product be-comes less conjugated and less coplanar such that the ex-cited aromatic esters have less interaction with other mol-ecules. Therefore, the excited molecules can release energy to the ground state through radiation mechanism, and the intensity of the fluorescence spectrum becomes stronger. This process is usually called the quench effect of the car-bonyl groups in PQ molecule. Similarly, the PL spectra for the exposed PQ/PMMA sample also has a stronger fluores-cence peak than that of the unexposed PQ/PMMA sample, as shown in Fig. 4共b兲. We think that the increase of inten-sity may also be induced by the quench effect of the pho-toproduct inside the PMMA matrix. This could be an indi-cation that the photoproducts become less conjugated than those of the original PQ molecules.
3.1.3 Mass spectra measurements
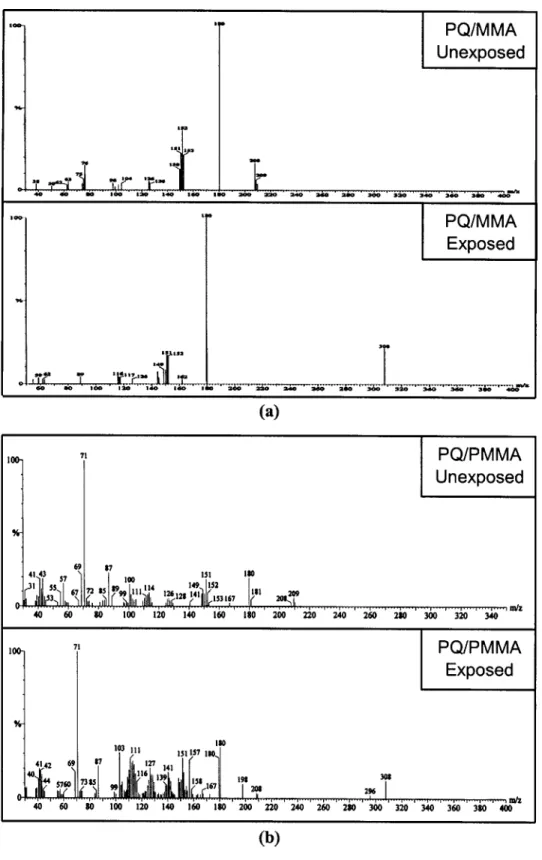
From mass spectra measurements, we can see whether there are any new compounds produced by light exposure. Figure 5共a兲 shows the mass spectra of unexposed and ex-posed PQ/MMA liquid samples. We find that a new peak signal appears at 308 by molecular weight in the exposed PQ/MMA, which does not appear for the unexposed sample. This means that the peak at 308 is a characteristic difference between the photoexposed and unexposed PQ/ MMA, since the molecular weights of PQ and MMA are 208 and 100, respectively. The existence of a peak signal at 308 by molecular weight is evidence that the photoproduct is one MMA molecule attached to one PQ molecule in our PQ/MMA liquid samples. Figure 5共b兲 shows the mass spec-tra of PQ/PMMA solid samples. It is also observed that a new peak appears at a molecular weight of 308 for the exposed sample, which is the same characteristic as that shown in Fig. 5共a兲. In summary, Fig. 5 shows an important characteristic of light exposure for both the PQ/MMA liq-uid and PQ/PMMA solid samples, i.e., a new compound with a molecular weight of 308 has been formed, which comes from the photoproduct of one PQ molecule attached to one MMA molecule.
3.1.4 FTIR spectra measurements
Figure 6 shows the FTIR spectra of PQ, MMA, and photo-product extracted from light-exposed PQ/MMA. It can be observed that many absorption peaks occur at different wave numbers, which provide information about the func-tional groups appearing in different samples. We expect that under light exposure the o-quinone double bond CvO of the carbonyl group on the PQ molecule becomes radical and attaches with the double bond CvC of the vinyl group on the MMA molecule, as shown in Fig. 1. The attachment produces the OH plus the acrylate functional groups in II and III routes, as well as the aromatic ester functional group共C-O-C ring兲 in I and IV routes. Therefore, in spec-tra, we check the position of some characteristic peaks, which corresponds to the previous functional groups and then identify the possible routes of the photoreaction.
First, we check the spectral regime larger than wave-number 2000 cm⫺1. For the PQ, the weak absorption peak Fig. 4 The photoluminescence spectra of (a) photoproduct
ex-tracted from exposed PQ/MMA and unexposed PQ/MMA samples, and (b) unexposed PQ-PMMA and exposed PQ-PMMA solid samples.
spreads between wave numbers 3000 cm⫺1 to 3100 cm⫺1, as shown in Fig. 6共a兲, indicating the existence of C-H on an aromatic function group. For the MMA, a weak peak with wave-number spreads between 2800 cm⫺1 to 3000 cm⫺1, as shown in Fig. 6共b兲, indicates the existence of C-H on an aliphatic function group. Similarly, Fig. 6共c兲 shows that the
photoproduct also has a weak peak in the same range. In Figs. 6共a兲, 6共b兲 and 6共c兲, no peaks appear at wave numbers higher than 3100 cm⫺1. It implies that there is no OH func-tional group formed in the photoproduct. And so it is plau-sible to exclude the routes II and III from the posplau-sible pho-toreactions in Fig. 1.
Fig. 5 The mass spectra of (a) an unexposed PQ/MMA liquid sample and photoproduct extracted from exposed PQ/MMA liquid sample, and (b) unexposed PQ/PMMA and exposed PQ/PMMA solid samples.
In the low wave-number regime of Fig. 6共a兲, we see two peaks occurring at 1675 cm⫺1 and 1593 cm⫺1. These are due to the stretching energy of CvO and CvC in PQ molecules. In Fig. 6共b兲, the peak occurring at 1746 cm⫺1is the absorption peak of CvO in MMA molecules. As for the photoproduct, we discuss four peaks in the same regime in Fig. 6共c兲. They are located at 1757 cm⫺1, 1634 cm⫺1, 1243 cm⫺1, and 1081 cm⫺1, respectively. The one at 1757 cm⫺1is due to the absorption of CvO in the acrylate part of the photoproduct. Originally this signal is produced by absorption of CvO in MMA, corresponding to the 1746 cm⫺1 peak shown in Fig. 6共b兲. The second peak at 1634 cm⫺1is produced by absorption of either CvO in the carbonyl group or CvC in the aromatic ring of the photo-product. Originally the absorption peaks of these two bonds are separated and located at 1675 cm⫺1 and 1593 cm⫺1in
Fig. 6共a兲, but two peaks are merged after light exposure. It can be seen that both new peaks are shifted from the origi-nal positions. It indicates that light exposure forms a new compound, such that function groups surrounding the CvO in MMA and the CvC in PQ have been changed. Therefore, the stretching and vibration energy of those bonds are changed such that their absorption peaks are shifted. In addition, we see that the absorption at 1634 cm⫺1is partially contributed by the CvO of the pho-toproduct. It indicates that one of the carbonyl groups (CvO) of the PQ molecule may remain in the photoprod-uct and produce a shifted absorption peak in this range. These evidences provide only information to indicate that the light exposure has changed the function groups sur-rounding the CvO and CvC bonds. The possible routes, which are taken by new photoreactions, should be verified by new absorption peaks that appear in the spectra.
Two new peaks at wave numbers 1081 cm⫺1 and 1243 cm⫺1, which are newly produced by the light expo-sure, indicate that light exposure has turned the carbonyl group on the PQ molecule and the vinyl group on the MMA molecule into an aromatic ester function group, C-O-C. This reaction is a photocyclo-addition, which occurs after PQ absorbs the photon energy. There are two possibilities for this reaction, which are indicated by path I and IV in Fig. 1.
Therefore, the results of FTIR spectra analyses suggest that by light exposure, PQ and MMA molecules in our sample react to form the one-to-one photoproduct by taking path I or IV in Fig. 1.
3.1.5 1HNMR spectra measurements
Figure 7 shows the 1H NMR spectra of the photoproduct extracted from light-exposed PQ/MMA samples. Each peak Fig. 6 The FT-IR absorption spectra of PQ, MMA, and photoproduct
extracted from light-exposed PQ/MMA.
in the figure indicates the possible locations of hydrogen atoms and their surrounding functional groups in the mol-ecule structure of the photoproduct. Those four peaks ap-pearing between 7 to 9 represent the hydrogen atoms that are attached on the phenyl group, which originally are at-tached on the aromatic ring of the PQ molecule before ex-posure. It indicates that light exposure breaks only the car-bonyl group of the PQ molecule.
Two peaks appearing between 4 and 5 represent two hydrogen atoms that are attached on an aromatic ester func-tional group of the photoproduct. They are originally lo-cated on the MMA molecule before exposure. Again, there are two possibilities for these new photoproducts, which are indicated by path I and IV in Fig. 1. They are similar in structure, so that these two hydrogen atoms in two vinyl functional groups should produce similar characteristic sig-nal peaks in 1H NMR spectra. To explain the results in detail, we label the two hydrogen atoms of the photoprod-uct of the path I compound as a1 and a2, and those of path IV as b1 and b2, respectively, as sketched in the left corner of Fig. 7. In principle, the hydrogen atoms of a2 and b2 will produce a signal peak at around 4.8. However, the two hydrogen atoms in the vinyl functional group of the com-pound are coupled such that the peak is split into two close peaks. Similarly, the hydrogen atoms a1 and b1 produced two more close peaks at around 4.2. Therefore, there are four separated peaks in the region between 4 and 5. This could be important evidence to show that there are two photoproducts coexisting in the light-exposed PQ/MMA sample, and both are formed by one PQ plus one MMA molecule.
Now we look at the regime with lower1H NMR spectra. There are very close double peaks appearing at 3.62 and 3.7. The peak at 3.62 is produced by the hydrogen atoms in the methyl group of photoproducts. Before exposure, these hydrogen atoms are originally attached on the methyl group of MMA molecules, which is close to the vinyl group. The peak at 3.7 is also produced by the hydrogen atoms in the methyl group of photoproducts. It implies that light expo-sure has induced two photoreactions. One is one-to-one at-tachment of PQ and MMA molecules. It gives the absorp-tion peak at 3.62. The other is a PMMA polymer. Such polymer chains have many methyl functional groups sur-rounded by different functional groups, so that the signals produced by different hydrogen atoms in the different me-thyl functional groups are mixed and broadened. It appears at 3.7 with a broadened shape.
The peak at 3.3 is produced by the hydrogen atoms in water molecules. The water is absorbed from air by solvent d-DMSO. The peak at 2.49 is produced by the hydrogen atoms in solvent d-DMSO molecules. These two peaks are not important for analyzing the photoproduct.
Another example to indicate that both products coexist in our exposed sample are those peaks in the region be-tween 1 and 2. The peak at 1.71 is produced by the hydro-gen atoms in the methyl functional group of the ester side in the one-to-one photoproduct, and the peaks appearing at 1.4 are produced by that of the polymer chain. Again, we see that due to the polymerization of MMA molecules, the peak at 1.4 is broadened and the associated close peak ap-pears at 1.2.
Therefore, the1H NMR spectra provide us very useful information about the photoproducts in the exposed PQ/ MMA samples. Both photoreactions of one-to-one attach-ment and photopolymerization have been observed. The one-to-one attachment could be formed by path I or IV in Fig. 1. The photoinduced polymerization could combine PQ with several MMA molecules to form an oligomer. This photoreaction can be further confirmed by the following GPC analyses.
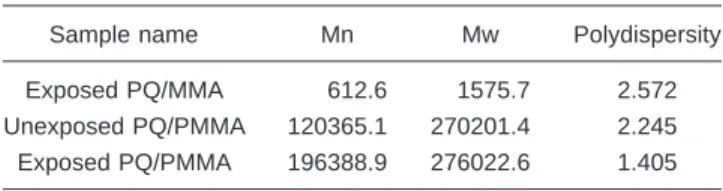
3.1.6 Gel permeation chromatograph measurements Table 1 summarizes the GPC measurement on the number-average molecular weight 共Mn兲, the weight-average mo-lecular weight 共Mw兲, and the polydispersity 共defined by Mw/Mn兲 for photoproducts extracted from light-exposed
PQ/MMA, and unexposed and exposed PQ/PMMA
samples. Here, the value of polydispersity indicates the de-gree of purity of the polymer molecule. If the value of polydispersity equals 1, the sample should be a highly pure polymer with a molecular weight of Mn. The larger the value is, the wider the polymer sample distribution of the molecular weight.
Consider first the photoproduct extracted from light-exposed PQ/MMA—the polydispersity is about 2.572. It implies that new photoinduced polymerization occurs in this sample. Also by comparing Mn, Mw, and polydisper-sity of the exposed PQ/MMA sample with the molecular weights of PQ (⫽208) and MMA (⫽100) molecules, we find that PQ and MMA molecules indeed carry out a little degree of photoinduced polymerization to form oligomers. This result confirms what has been observed in the NMR analysis: under light exposure, one PQ may link with four to several MMA molecules to form oligomers.
Then we consider the GPC analysis on exposed and un-exposed PQ/PMMA. We find that the values of Mn and Mw are slightly different. Since in both samples the matrix PMMA is already polymerized and the concentration of the photoinduced oligomers is too small to affect the molecular weight of the sample, we cannot see a light-induced change of molecular weight of our sample. The difference of mea-sured values between the exposed and unexposed samples is because we pick two different samples during the mea-surements. Although these two samples have the same pa-rameters during sample preparation, the degrees of purity of the polymerization of the liquid samples are different. However, we find that the polydispersities of both samples are much larger than 1. This implies that both bulk samples are not completely polymerized and should contain some amount of unreacted MMA monomer to provide elements for holographic recording, which follows our design.
Table 1 Molecular weights of materials from GPC analyses.
Sample name Mn Mw Polydispersity
Exposed PQ/MMA 612.6 1575.7 2.572
Unexposed PQ/PMMA 120365.1 270201.4 2.245
3.1.7 Discussions
From the previous chemical analyses, it is clear that under light exposure the PQ molecules mainly react with residual MMA molecules by chemical paths I and IV, shown in Fig. 1, to form a one-to-one photoproduct in our PQ/PMMA photopolymer samples. The physical mechanism of holo-graphic recording in our PQ/PMMA samples can be pro-posed as follows. During holographic recording, each pho-tosensitive PQ molecule absorbs photons and bonds with one residual monomer molecule to become a radical struc-ture. This photochemical reaction occurs in the bright re-gion. Consequently, a difference in the refractive index in the dark region and that in the bright region is created, i.e., a phase grating is formed by the structure change of the PQ molecules. Since the monomers and photosensitizers in-volved in the formation of the holograms are only a small fraction of the material compositions, the host polymer ma-trix structure remains unaffected during the optical record-ing. As a result, the dimensional shrinkage and the bulk refractive index change induced by the holographic record-ing process are minimized. This mechanism can be applied to similar photopolymer materials such as molecules with o-quinone functional group in doped PMMA photopolymer. The holographic recording of our photopolymer materials are characterized in the next section.
3.2 Holographic Recording
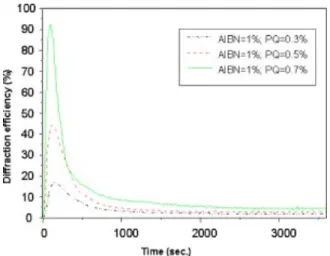
We first write plane wave holograms in the PQ/PMMA samples 4.8 mm thick. Figure 8 shows the hologram dif-fraction efficiency as a function of exposure energy for samples with different PQ concentrations. It is seen that for all samples, the diffraction efficiency 共the diffracted light intensity divided by the total light intensity transmitted through the sample兲 reaches a maximum value at the expo-sure energy of 0.3 J/cm2. The higher the concentration of PQ, the higher the maximum value of the diffraction effi-ciency. Further exposure causes the diffracted signal to drop. At this moment, the distortion in the geometrical shape of the transmitted beam has also been observed. The beam distortion and drop of diffraction efficiency are caused by the noise gratings produced by overexposure. The noise gratings are formed by the scattered beams,
which are produced by scattering centers such as micro air bubbles or the nonuniformity of the refractive index of the photopolymer. Because of the long interaction length in the bulk volume, the scattered beams interfere constructively to form noise gratings. The noise grating in turn enhances the nonuniformity of the refractive index of the photopolymer. Hence, when the noise gratings are strong, most of the en-ergy of the incident light will be scattered and the diffracted beam is weakened and distorted. The implication of the growth of the noise grating is that there should be an upper limit to the exposure time for a single holographic record-ing; otherwise the noise grating will grow to deteriorate the recorded hologram.
To inspect the image quality of the holographic record-ing, we have recorded a Fresnel hologram in our sample using the resolution test chart. Figure 9 shows the photo-graph of the reconstructed image, in which the sample is placed near the Fourier plane of the imaging lens. It can be seen that the image retains clear fidelity, which is down to number 6 of group 5. This is equivalent to be the resolution of around 100 lps/mm. For volume holographic storage, thousands of pages are superimposed on a single location of a thick recording material. As the number of recording pages is increased, the diffraction efficiency of each holo-gram is very weak共typically less than 10⫺6), and particular attention must be taken to keep material scattering noise to a minimum. Thus it is very important to grow a material with high uniformity. In this aspect, our technique of pre-polymerization during material fabrication seems to pro-duce satisfactory uniformity of refractive index for multiple holographic storage.
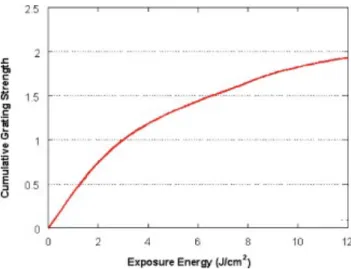
Next, we characterize the dynamic range of our samples for multiple holographic recording. For multiplexed holo-graphic storage, the amplitude of the grating strength of each hologram is proportional to the square root of the diffraction efficiency. A larger dynamic range of the mate-rial will give a higher diffraction efficiency of each holo-gram. The characteristic dynamic range of the material can be defined as the summation of cumulative grating strength of the recorded holograms at one location,19,20 which is called the M/#, i.e.,
Fig. 8 The holographic recording dynamics of our photopolymer samples with different concentrations of PQ molecules.
Fig. 9 The reconstructed resolution chart picture from the holo-gram.
M/#⫽
兺
i⫽1 N
冑
i, 共1兲where N is the total number of holograms recorded at one location until the material is exhausted. To characterize the M/# of our samples, we have performed a hologram record-ing usrecord-ing the technique of peristrophical multiplexrecord-ing.21 300 plane wave holograms, each with equal exposure en-ergy (⬃40 mJ/cm2), were recorded at a single location of the polymer sample. After recording, the diffraction effi-ciency of each hologram was measured, and the square roots of the diffraction efficiencies were summed up to ob-tain a running curve of the cumulative grating strength 共de-fined as
C⫽
兺
i⫽1 M
冑
i,where M is the total number of holograms that have been recorded兲 as a function of the cumulative exposure energy. The running curve for different polymer samples with thickness of 1.0 mm is given in Fig. 10. According to Eq.
共1兲, the saturation value of the cumulative grating strength
is equal to the M/#. From Fig. 10, the M/# of our PQ-doped PMMA is around 2 mm⫺1. Our further experiments show that the M/# grows linearly with the thickness of the samples. Furthermore, the characteristic exposure sensitiv-ity, which is defined as the necessary energy for the value C to reach around 63% of the saturated value, can be esti-mated by an exponential curve fitting of the running curves in Fig. 10. It can be calculated that the characteristic expo-sure sensitivity of our PQ-doped PMMA samples is
⬃4.76 J/cm2. According to the diffraction formula of a vol-ume phase grating, the saturated refractive index change of photopolymers can be estimated to be 3.25⫻10⫺4. 4 Conclusions
To identify the photoproducts in our PQ/PMMA samples, different chemical analyses are performed in PQ-solved MMA liquid and PQ-doped PMMA solid samples, both
with unexposed and exposed cases. The FT-IR spectra show that no OH functional groups are left in the exposed samples. This result excludes the possibilities of photo-chemical reaction paths II and III shown in Fig. 1. The mass spectra indicate that under light exposure, a new com-pound based on one PQ molecule and one MMA molecule is produced. Measurements of PL spectra confirm that un-der light exposure, the CvO bond of PQ is attached with CvC of MMA. From these analyses, we conclude that photoreaction should take place by paths I and IV shown in Fig. 1. The1H-NMR spectra indicate that there is photoin-duced polymerization process in our photopolymers beside one-to-one attachment. The GPC analyses further confirm that an oligomer is formed as PQ/MMA solution is exposed in green light. It indicates that under light exposure, PQ molecules function as photoinitiators to become free radi-cals, which combine with MMA molecules to form oligo-mers. The holographic recording mechanism in our PQ/ PMMA photopolymer is mainly due to the structural change of PQ molecules, resulting in a strong change in the refractive index of a material. It provides the possibility to record phase holograms with negligible shrinkage effects. The holographic recordings in those samples is demon-strated. Our technique of prepolymerization during material fabrication seems to produce a satisfactory uniform refrac-tive index for holographic storage. By measuring the re-cording dynamics of multiple holograms in these photo-polymer samples, the characteristics of our material are investigated. The criterions for evaluating the dynamic range and sensitivity for holographic recording, defined as the M/# and characteristic exposure energy of the polymer, respectively, are described. The results show that the M/# can be as large as 2.06, and its characteristic exposure sen-sitivity can be as small as 4.76 J/cm2 for 1-mm-thick samples. This M/# value corresponds to the refractive change in our photopolymer to be 3.25⫻10⫺4. The results can be extended to different o-quinone-based molecules in doped PMMA hybrid materials.
Acknowledgment
This research is financially supported by the National Sci-ence Council of the Republic of China under grant NSC-92-2215-E-009-005 and NSC92-2112-M-009-010, in part from the Ministry of Education Taiwan under project of Photonic Science and Technology for the Tera-Era. References
1. D. Psaltis and F. H. Mok, ‘‘Holographic memories,’’ Sci. Am. 273共5兲, 70–76共1995兲.
2. H. J. Coufal, D. Psaltis, and G. Sincerbox, Holographic Data Storage, Springer Verlag, New York共2000兲.
3. B. L. Booth, ‘‘Photopolymer material for holography,’’ Appl. Opt. 14共3兲, 593–601 共1975兲.
4. F. P. Laming, Polym. Eng. Sci. 11, 421– 425共1971兲.
5. H. Franke, ‘‘Optical recording of refractive-index patterns in doped poly-共methyl methacrylate兲 films,’’ Appl. Opt. 23共16兲, 2729–2733 共1984兲.
6. U. S. Rhee, H. J. Caulfield, C. S. Vikram, and J. Shamir, ‘‘Dynamics of hologram recording in DuPont photopolymer,’’ Appl. Opt. 34共5兲, 846 – 853共1995兲.
7. K. Y. Hsu, S. H. Lin, W. T. Whang, and W. Z. Chen, ‘‘Holographic data storage using photopolymers,’’ Proc. SPIE 3801, 66 –74共1999兲. 8. M. L. Hsieh and K. Y. Hsu, ‘‘Grating detuning effect on holographic memory in photopolymers,’’ Opt. Eng. 40共10兲, 2125–2133 共2001兲. 9. L. Dhar, A. Hale, H. E. Katz, M. L. Schilling, M. G. Schnoes, and F.
C. Schilling, ‘‘Recording media that exhibit high dynamic range for digital holographic data storage,’’ Opt. Lett. 24共7兲, 487–489 共1999兲.
Fig. 10 The running curve of the cumulative grating strength for a photopolymer sample with thickness of 1 mm.
10. A. Pu and D. Psaltis, ‘‘High-density recording in photopolymer-based holographic three-dimensional disks,’’ Appl. Opt. 35共14兲, 2389–2398 共1996兲.
11. X. Yi and P. Yeh, CLEO/Pacfic Rim ’99 4, 1175–1176, IEEE Press 共1999兲.
12. G. J. Steckman, I. Solomatine, G. Zhou, and D. Psaltis, ‘‘Character-ization of phenanthrenequinone-doped poly共methyl methacrylate兲 for holographic memory,’’ Opt. Lett. 23共16兲, 1310–1312 共1998兲. 13. S. H. Lin, K. Y. Hsu, W. Z. Chen, and W. T. Whang,
‘‘Phenanthrenequinone-doped poly共methyl methacrylate兲 photopoly-mer bulk for volume holographic data storage,’’ Opt. Lett. 25共7兲, 451– 453共2000兲.
14. J. Mumbru, I. Solomatine, D. Psaltis, S. H. Lin, K. Y. Hsu, W. Z. Chen, and W. T. Whang, ‘‘Comparison of the recording dynamics of phenanthrenequinone-doped poly共methyl methacrylate兲 materials,’’
Opt. Commun. 194共1–3兲, 103–108 共2001兲.
15. S. Farid, D. Hess, G. Pfundt, K. H. Scholz, and G. Steffan, ‘‘Photo-reactions of o-quinones with olefins: a new type of reaction leading to dioxole derivatives,’’ Chem. Commun. (Cambridge) 434共5兲, 638–639 共1968兲.
16. See http://www.sigmaaldrich.com
17. See http://www.st.rim.or.jp/⬃shw/alphable.html 18. See http://www.lancastersynthesis.com
19. F. Mok, G. Burr, and D. Psaltis, ‘‘System metric for holographic memory systems,’’ Opt. Lett. 21共12兲, 896–898 共1996兲.
20. A. Pu, K. Curtis, and D. Psaltis, ‘‘Exposure schedule for multiplexing holograms in photopolymer films,’’ Opt. Eng. 35共10兲, 2824–2829 共1996兲.
21. K. Curtis, A. Pu, and D. Psaltis, ‘‘Method for holographic storage using peristrophic multiplexing,’’ Opt. Lett. 19共13兲, 993–994 共1994兲.
Yi-Nan Hsiao received his BS in chemical engineering in 1998 from Chung Yuan Christian University and MS in material sci-ence and engineering in 2000 from Na-tional Chiao Tung University in Taiwan. He is currently a PhD candidate in the Institute of Material Science and Engineering at Na-tional Chiao Tung University. His research interests include photopolymers for holo-graphic storage and organic material syn-thesis for optics.
Wha-Tzong Whang: received his BS and MS degrees in chemistry in 1975 from Na-tional Taiwan Normal University and in 1980 from National Taiwan University, re-spectively. He received his PhD in polymer science and engineering in 1984 from Polytechnic Institute of New York. He is currently a professor in the Department of Material Science and Engineering at Na-tional Chiao Tung University. His research fields include polymer/inorganic quantum dots and nanocomposites, photopolymer for optical storage, and or-ganic thin film transistor.
Shiuan Huei Lin received his BSc degree in electrophysics in 1990 and MSc and PhD degrees in electro-optical engineering in 1992 and in 1996, respectively, all from National Chiao Tung University in Taiwan. He is currently an assistant professor in the Department of Electrophysics at National Chiao Tung University. His research inter-ests are in the areas of holographic stor-age, optical computing, optical devices, ho-lographic materials, and holography for information processing.