Osteoporosis: prevalence and risk factors among Taiwanese metropolitan elderly
Cheng-Chieh Lin,1,2,3 Chia-Ing Li,1,3 Nai-Hsin Meng,4 Chiu-Shong Liu,1,2,3 Chih-Hsueh Lin,1,2 Wen-Yuan Lin,1,2 Chiu-Kai Chang, 4 Yih-Dar Lee,5,6 Tsai-Chung Li *7,8
1 School of Medicine, College of Medicine, China Medical University, Taichung, Taiwan
2 Department of Family Medicine, China Medical University Hospital, Taichung, Taiwan
3 Department of Medical Research, China Medical University Hospital, Taichung, Taiwan
4 Department of Physical Medicine and Rehabilitation, China Medical University Hospital, Taichung, Taiwan
5 Department of Psychiatry, Medical College, National Cheng-Kung University, Tainan, Taiwan
6 Bristol-Myers Squibb (Taiwan) Ltd, Global Development & Medical Affairs, Taipei, Taiwan
7 Graduate Institute of Biostatistics, College of Public Health, China Medical University, Taichung, Taiwan
8 Institute of Health Care Administration, College of Health Science, Asia University, Taichung, Taiwan
* Correspondence to: Tsai-Chung Li, China Medical University, 91 Hsueh-Shih Road, Taichung, 40421, Taiwan, Tel: 2205-3366 ext 6605, Fax: 886-4-22078539, e-mail: tcli@mail.cmu.edu.tw
Abstract
Purpose This study estimated the age- and sex-specific prevalence of osteoporosis using dual-energy X-ray absorptiometry (DXA) and determined risk factors of osteoporosis in older Taiwanese metropolitan persons.
Material and methods Cross-sectional study enrolled total of 711 older persons (294 females and 417 males, aged 65-98 years) in Taichung City during 2009. Bone mineral density at central sites was measured by DXA, whole-body scan performed on each subject lying supine.
Results Age-standardized prevalence of osteoporosis for women tallied 35.4%, 15.0%, and 21.1%; for men, 15.1%, 0.7%, and 9.8% at the total hip, lumbar spine, and femoral neck, respectively. After multivariate adjustment, age, gender, body mass index (BMI), weight, and smoking manifested strong linkage with osteoporosis. Odds ratios (95% confidence intervals) were 0.24 (0.15-0.40) for males; 1.86 (1.03-3.35), and 3.24 (1.67-6.28) for 70-74, and >80 years, respectively; 0.12 (0.05-0.29), 0.09 (0.04-0.23), and 0.08 (0.03-0.22) for BMIs of 18.5-24, 24-27, and ≥27 kg/m2, respectively; 2.66 (1.27-5.56) for smoking; and 2.11 (1.16, 3.84) for frailty status. Conclusion Osteoporosis was most common at the total hip and least common at the lumbar spine in both sexes. Programs for osteoporosis screening should aim at older females and/or those with low BMI, frailty or a smoking habit.
Introduction
Taiwan has the world’s fastest aging population, making osteoporosis and related fractures pose ever-increasing menaces to Taiwanese elderly, since prevalence climbs rapidly with age [1]. Prevalence of osteoporosis is estimated at 49% among women over 50 years of age [2]. In China, about 88 million patients suffer from it [3]. Such fractures are associated with morbidity and mortality, decreased quality of life, as well as higher health care costs [4], yet osteoporosis is often not detected until fracture occurs. Hence it must be diagnosed as early as possible.
Diagnoses are based on bone mineral density (BMD) and comparison with reference norms. Diagnosis proposed by the World Health Organization (WHO) is calculated by T-score: i.e., BMD of a subject minus the peak BMD (PBMD) divided by standard deviation (SD) of the PBMD (mean BMD of young healthy adults of the same sex and race) [5-7]. A T-score ≤ -2.5 (BMD of 2.5 more SDs below peak mass of young, healthy, sex- and race-matched reference population, indicates osteoporosis. Some nations use different PBMD percentile criteria [3, 8]; BMD measurements are crucial for diagnosis. BMD measured by dual-energy X-ray absorptiometry (DXA) is the most widely used indicator; DXA of the spine or hip region is the recommended diagnostic tool [9]. No study in Taiwan has reported BMD reference normative data for any age. In clinical practice, diagnosis is based on manufacturer-supplied PBMD reference values, which may not be fully representative of a specific local population [10-12]. The present study used DXA-acquired BMDs at central skeletal sites (lumbar spine and hip) of a Taiwanese metropolitan community-dwelling older population so as to elicit BMD normative data and information on prevalence among Chinese older persons, using PBMDs of Asian populations in literature, and to determine factors associated with osteoporosis.
Materials and Methods
Population and participants
This study used population-based cross-sectional approach. Target population consisted of persons aged 65 or older residing in eight administrative neighborhoods of Taichung City in June, 2009. This city is located in west-central Taiwan and has a population of over one million, third largest islandwide. A total of 3997 elderly lived in these neighborhoods during the study period; about 4.58% of Taichung’s people were the same age. Sampling frame was the set of all records of individuals obtained from the Bureau of Households.
All eligible individuals were invited to participate. During household visits, we
excluded 1764 individuals as ineligible. Overall response rate was 49.0%; study was
approved by the Human Research Committee of China Medical University Hospital,
with written informed consent obtained from all participants. In all, 855 older persons
(402 females and 453 males) aged 65-98 years completed the prerequisite physical
examination. After excluding older persons with missing data for height, weight, and
BMD, a total of 711 subjects were finally enrolled. Exclusion rate was 16.8%. The
detailed methodology has been described elsewhere [13]. This study was approved by
the Ethical Review Board of China Medical University Hospital.
Measurements
Bone mineral density and osteoporosis
Corporation, Madison, WI) at central skeletal sites (hip, lumbar spine, femoral neck, trochanter, and Ward’s triangle). This machine was calibrated daily by physical phantom, data analyzed by Lunar enCORE2004 software version 8.60.006 (CV < 1% to measure diverse sites). Whole-body scan was performed on each subject lying supine and osteoporosis defined according to WHO diagnostic criteria: individual with BMD less than 2.5 SDs below young adult mean [5]. Given that there were no young adults in this study, we adopted the BMD reference values of Asian populations of young adults aged 20-39 years from literature. Young adult data from Chinese and Korean populations were all used to define the reference cutoff values. The Chinese and Korean cutoffs were based on predicted BMD at these ages reported by Lynn et al. [1] and Cui et al. [14], respectively.
Anthropometric measurement
Anthropometric measures gleaned from complete physical examination. Weights and heights were measured by autoanthropometer (Super-view, HW-666). Subjects were shoeless and wore light clothing during measurements. BMIs were derived from this formula: weight (in kilogram) / (height)2 (in meter).
Definitions of other variables
Data on sociodemographic characteristics (gender, age, educational attainment, marital status, smoking, drinking, physician-diagnosed disease, medication history) were collected during complete physical exam. Educational level was categorized as less than 7 years, 7-12 years, and >12 years. Marital status was divided into currently married or unmarried (single, widowed, divorced, or separated).
Smoking was classified as current, past, or never. Past smokers were those who had smoked at least 100 cigarettes during their lifetime and stopped. Drinking was categorized as current, never, and past. “Never” drinkers were those who self-reported
not regularly drinking beer, wine, or hard liquor. Instead of measuring leisure activity, we gauged frailty, as defined by Fried et al. [15]: shrinking, weakness, poor endurance and energy, slowness, as well as low physical activity level. Shrinking was defined as unintentional weight loss ≥3 kilograms in the previous year, weakness as grip strength in the lowest quintile at baseline based on subgroups of gender and BMI 15. Poor endurance and energy were gauged by self-reported exhaustion, as identified by two items from the Center for Epidemiological Studies-Depression Scale [16]. Slowness was measured by slowest quintile of the population based on time needed to walk 15 feet (4.572 m) according to subgroups of gender and standing height [15]. Low physical activity level was tallied by weighted score of self-reported kilocalories expended weekly. Lowest quintile of physical activity in this study was identified for each gender. Those with more than two of these components were considered frail. Statistical analysis
Continuous variables were reported as mean ± SD. Categorical variables were reported as percentages (95% confidence intervals, CI). Differences in proportions and means were assessed by χ2 test or analysis of variance. Prevalence was expressed with a 95% CI. Weighted prevalence via proportionate sampling of age, gender, or both was calculated. Multivariate logistic regression estimated odds ratios (ORs) of osteoporosis for sociodemographic factors, lifestyle and/or self-reported illness. All p values were obtained from two-sided tests. Statistical significance was set at p < 0.05. All analyses were performed using SAS version 9.2 (SAS Institute Inc, Cary, NC).
Results
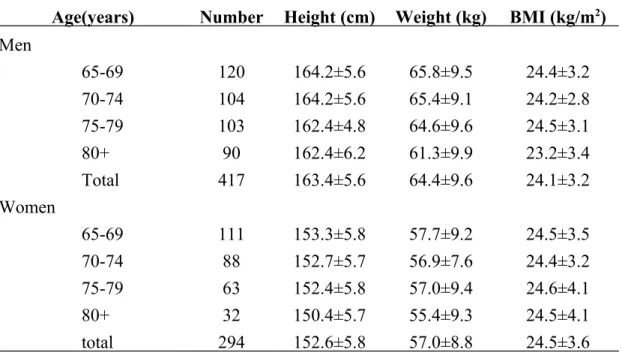
Over half of the subjects were male, aged 65-74 years, educational attainment of 7 years or more, and married. Mean height and weight decreased with age among 417 healthy Chinese male elderly; mean BMI decreased up to age 70-74, increased at age
75-79, then decreased again at age ≥80 (Table 1). Among 294 females, height and weight generally decreased with age. Average BMI was similar across age groups.
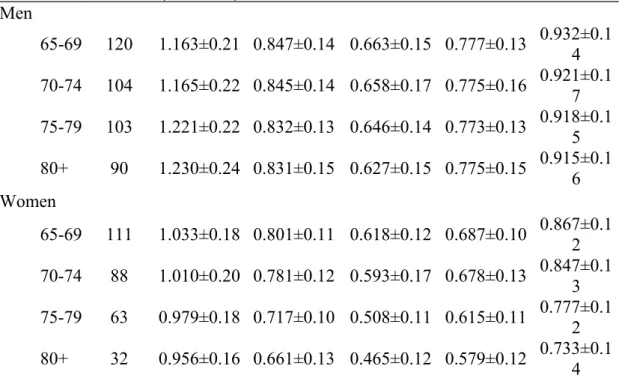
Among males over 65 years old, BMD increased at a rate of 0.003 g/cm2·year at the lumbar spine, decreased 0.001 g/cm2·year at the femoral and total hip, decreased 0.002 g/cm2·year at Ward’s triangle, and remained essentially constant at trochanter. Between ages 65 and >80, BMD increased by 5.8% at the lumbar spine, decreased by 1.9% at the femoral neck, decreased by 5.4% at Ward’s triangle, remained constant at trochanter, and decreased by 1.8% at the total hip (Table 2). Among females above 65 years, BMD decreased 0.004, 0.007, 0.008, 0.005, and 0.007 g/cm2·year at the lumbar spine, femoral neck, Ward’s triangle, trochanter, and total hip, respectively. Between ages 65 and >80, BMD decreased by 7.5%, 17.5%, 24.8%, 15.7%, and 15.5% at the lumbar spine, femoral neck, Ward’s triangle, trochanter, and total hip, respectively.
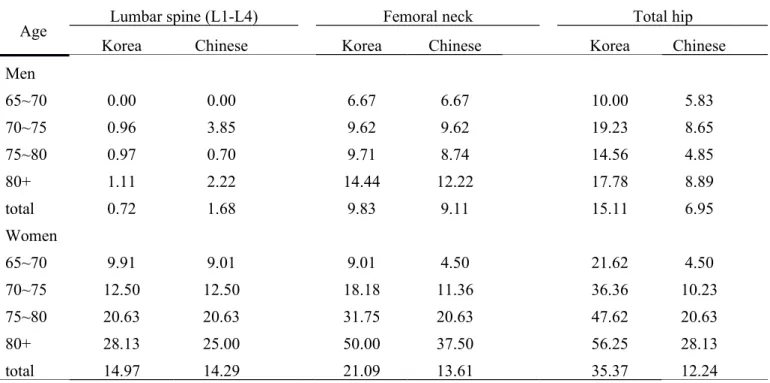
Using either Korean reference normative values, prevalence of osteoporosis for men was higher at all sites, increasing with age (Table 3). Prevalence was lower at the femoral neck with cutoffs of Chinese reference used than Korean one used. By contrast, prevalence was highest at the total hip with Korean cutoffs used. Table 4 plots prevalence and 95% CIs as per subgroups of demographic traits, lifestyle, and frailty. Osteoporosis was defined as presence of osteoporosis at lumbar spine, femoral neck, or total hip, using Chinese cutoffs. Prevalence was significantly higher in women and older persons with lower levels of BMI, higher in those of greater age and frailty. After multivariate adjustments for significant factors in crude analysis, age, gender, BMI, smoking status, and frailty status showed definite association with osteoporosis. ORs (95% CIs) were: 0.24 (0.15-0.40) for males; 1.86 (1.03-3.35), and 3.24 (1.67-6.28) for 70-74, and >80 years, respectively; 0.12 (0.05-0.29), 0.09 (0.04-0.23), and 0.08 (0.03-0.22) for BMIs of 18.5-24, 24-27, and ≥27 kg/m2, respectively;
2.66 (1.27-5.56) for smoking status, and 2.11 (1.16, 3.84) for frailty status. We further evaluated effect of frailty components and number of frailty components to find slow walk time a definite predictor for osteoporosis (OR: 1.75 (1.12-2.75), p<0.05, Figure 1A). Elders with three or more components of frailty were more susceptible than those with none (OR=2.74 (1.38-5.41); p<0.01, Figure 1B).
Discussion
Our study was first to rate osteoporosis prevalence in older non-institutionalized civilian population of a Taiwanese metropolitan area, using BMD reference values for Chinese and Koreans. BMD decrease rate was at least four times higher and prevalence of osteoporosis twice as high in females at various sites and increased with increased age at all sites. Highest increase rate was at the femoral neck in both sexes, using various population cutoffs. Osteoporosis was most common at the total hip and least common at the lumbar spine in both men and women. Nearly 50.00% and 56.25% of women aged ≥80 years had osteoporosis at the femoral neck and total hip. Prevalence of osteoporosis was also higher in older persons who smoked, those with lower BMIs, as well as those with frailty. Findings suggest osteoporosis as widespread among Taiwanese adults aged 65 and above, posing a serious public health concern in Taiwanese metropolitan areas.
A few representative surveys have been done in diverse populations to estimate osteoporosis [Korean 盛行率,台灣盛行營養調查那篇]. In general, the prevalence found in our study is lower than in regions that are more economically developed, including Europe, U.S.A., Canada, Netherlands, Australia, and Japan [美國歐洲日本 澳洲盛行率那篇], and the estimate of the prevalence in our study is closer to those in
Asian populations [Korean, 台灣盛行營養調查那篇]. In a study conducted in Korea, Chiu and colleagues identified age-standardized prevalence of osteoporosis among subjects aged 50–79 years in lumbar spine, and femoral neck was 40.1%, and 12.4% in women and 6.5% and 5.9%, in men, respectively [Korean 盛行率]. In a meta-analysis conducted by Zhang et al., ninety-one studies had included 51,906 men and 88,006 women aged 20 years and older in 38 cities in China. Their findings indicated that age standardized prevalence of osteoporosis was 23.9 %and 12.5% in women and 3.2%and 5.3 % in men aged 50 years and older at the lumbar spine and femoral neck, respectively [中國大陸盛行率]. The estimates of osteoporosis at the lumbar spine and femoral neck were similar to ours except for femoral neck in women. The overall osteoporosis prevalence in femoral neck of our study was 14.29% in women, which was much lower than that in Chiu’s (40.1%) [Korean 盛行率] and in Zhang’s (23.9%) [中國大陸盛行率]. On the contrary, the estimates of age-specific prevalence were much higher in developed countries than ours in women aged 70 years and older. A possible explanation for the higher prevalence being observed in developed countries is that the much higher level of urbanization increased the prevalence of risk factors for osteoporosis, such as extreme obesity, decreased physical activity, and smoking. Overall obesity, and smoking have been reported to be more prevalent in the urban population [Abdul-Rahim HF, 2001, Gu D, 2005].
Past years have seen underlying pathophysiological correlation between obesity and bone density actively researched due to conflicting findings regarding association of obesity with osteoporosis. Our study demonstrated obesity measured by BMI as inversely associated with prevalence of osteoporosis, consistent with previous studies showing beneficial effect of fat mass on increasing bone mass, thereby reducing risk of osteoporosis [17-19]. Positive association between obesity and bone mass can be attributed to several possible mechanisms. One is that body weight exerts the positive effect of mechanical loading on bone formation, particularly cortical elements [20-23]. Another is association of fat mass with the secretion of bone-active hormones from pancreatic β-cells and secretion of bone-active factors from adipocytes [19]. On the contrary, one study indicated that very high level of BMI was positively associated with prevalence of osteoporosis [BMI& 骨 質 密 度 2]. The possible explanation for the positive association of BMD and very high level of BMI may be an effect of body height because subjects with osteoporosis may have shorter height that increases BMI. Yet these aforementioned studies focus on bone mass, not osteoporosis; most are cross-sectional and cannot make causal inferences. Future longitudinal study should explore causal relationship between obesity and bone mass or osteoporosis.
Our study associated frailty and osteoporosis in Chinese elders dwelling in community, consistent with that in community-dwelling older American women, as reported by Alberto et al. [24] and Wang et al. [frailty& 骨密 3]. Possible common pathophysiologic mechanism that may forge links between osteoporosis and frailty: endocrine-immune dysregulation in both osteoporosis and sarcopenia, which further enhances risk of frailty. Age-related declines in serum estrogen and androgen levels contribute to increases in local bone levels of cytoclastic cytokines, followed by bone
loss [25]. In addition, presence of decreased gonadal hormones and IGF-1, along with high levels of cytokines and inflammatory mediators, enhance risk of sarcopenia and frailty [25].
The important contribution of our study was that our study was the only one that simultaneously reported prevalence of osteoporosis and examined whether frailty was associated with osteoporosis. Recently, there are four published papers focusing on reporting the prevalence of osteoporosis in Chinese using DXA to measure BMD. One reported the osteoporosis prevalence in young adult women [台灣女性盛行率], one in men aged 20 years and older [台灣男性盛行率], one in adults aged 20 years and older [台灣盛行率], and one in Chinese adults aged 50 years and older[中國大陸 盛行率]. Two of these studies had examined the association between osteoporosis or BMD with weight, BMI, and height, but none of them examined the association between frailty [台灣盛行率,台灣女性盛行率]. There was one study exploring the association between osteoporosis and frailty in Chinese elders conducted by Wang et al. [frailty &骨密 3] and one from Medicare enrollees residing in 12 contiguous ZIP code areas in Baltimore, Maryland of Women Health and Aging Study (II) [frailty & 骨密1]. Our study had three advantages over the study of Wang et al. First, we recruited all eligible elders in a well-defined population. On the contrary, the study conducted by Wang et al. used convenience sampling method and the mean age of
their sample was slightly older than ours (male:75.6±4.8 years; female: 76.9±5.2 years vs. male: 72.6±5.6 years; female: 74.8±6.8 years). Second, we further examined the association between components of frailty and osteoporosis. Our study findings showed that slow walking speed was the only component of frailty that was
associated with osteoporosis. Third, our size of sample is larger than that of Wang et al. (n=711 vs. 316), thus, our study provided more precise estimate. Due to difference in urbanization level between our study and Wang et al., the prevalence of obesity and physical activity level in these two populations were different. Our study provided the findings of elders residing in the metropolitan city.
Our study proved smoking a risk factor in older men and women, consistent with prior studies [26-34]. Many exploring effects of smoking on bone status have focused on women [26, 27, 34], but none involved Chinese women. Our study lends additional evidence for Chinese elderly. Cigarette smoke contains a variety of substances, with nicotine as one addictive, highly toxic component. Many studies correlate specific tobacco components with bone status [35, 36]. Chemicals such as toxic heavy metals, polychlorinated biphenyls, dioxin, and polycyclic aromatic hydrocarbons may account for negative impact on bone status [37, 38]. A possible mechanism by which smoking exerts its negative effect on bone status is that smoke exposure can inhibit bone formation and increase bone resorption, thereby increasing bone turnover [38].
This study tabulated representative sample of a Taiwanese elderly population. Standard protocols and instruments were used. All participants underwent complete physical examinations. To ensure quality data collection, strict personnel training
process and vigorous quality assurance programs were established. All these are the advantages, yet limitations are worth noting. First, study areas in relatively urban regions and study population comprising middle to upper middle class and relatively healthy can cause regional differences in BMD values and anthropometrics. Results may not apply to other populations or locales. Second, the study was cross-sectional, rather than longitudinal; causal association between osteoporosis and risk factors cannot be examined. Third, BMD values were measured at one point in time; BMD may be subject to survival effects, a limitation quite common to studies involving elderly. Those with more severe osteoporosis were more likely to die; association is expected to be attenuated. Third, 49.0% response rate may portend selection bias. To assess this possibility, we probed demographic traits of the eligible study subjects and participating subjects by comparing age and sex, finding similar distributions; differences ranged from 0.2 % to 2.9%. Non-differential distribution in age and sex indicates selection error as random; biased results in effect may be toward null, a low threat to data validity.
Conclusion
Our study had the largest sample of Taiwanese elderly to date. Results provide continuous BMD normative values at ages 65-98 for both sexes. Estimated prevalence of osteoporosis in men was 1.68%, 9.11% and 6.95% at the lumbar spine, femoral neck, and total hip; for women, 14.29%, 13.61%, and 12.24%, respectively. Factors associated with prevalence were gender, age, BMI, smoking, and frailty.
Acknowledgments
This study was supported by grants from the National Health Research Institutes
Taiwan Ministry of Health and Welfare Clinical Trial and Research Center of
Excellence (MOHW103-TDU-B-212-113002). Disclosure of interest
References
1. Lynn HS, Lau EMC, Au B, Leung PC. Bone mineral density reference norms for Hong Kong Chinese. Osteoporos Int 2005;16:1663-8.
2. Fujiwara S. Estimating incidence of osteoporosis by bone mineral density, from population based study (in Japanese). Jyouju kagaku kenkyuu kenkyuuhoukoku (Report of Aging and Health Reasearch) 1995;4:508-11.
3. Liu Z, Piao J, Pang L, Qing X, Nan S, Pan Z, Guo Y, Wang X, Li F, Liu J, Cheng X. The diagnostic criteria for primary osteoporosis and the incidence of osteoporosis in China. J Bone Miner Metab 2002;20:181-9.
4. Sabariego C, Brach M, Stucki G. Determinants of major direct medical cost categories among patients with osteroporosis, osteoarthritis, back pain or fibromyalgia undergoing outpatient rehabilitation. J Rehabil Med 2001;43:703-8. 5. WHO study group. Assessment of fracture risk and its application to screening for postmenopausal osteoporosis. WHO Technical Report Series 843, WHO: Geneva, 1994.
6. Kanis JA, Melton LJ III, Christiansen C, Johnston CC, Khaltaev N. The diagnosis of osteoporosis. J Bone Miner Res 1994;9:1137-41.
7. Hologic. QDR 4500 X-ray bone densitometer user’s guide. Hologic, Bedford, MA, 1996.
8. Orimo H, Hayashi Y, Fukunaga M, Sone T, Fujiwara S, Shiraki M, Kushida K, Miyamoto S, Soen S, Nishimura J, Oh-Hashi Y, Hosoi T, Gorai I, Tanaka H, Igai T, Kishimoto H; Osteoporosis Diagnostic Criteria Review Committee: Japanese Society for Bone and Mineral Research. Diagnostic criteria for primary osteoporosis: year 2000 revision. J Bone Miner Metab 2001;19:331-7.
9. Leib ES, Lewiecki EM, Binkley N, Hamdy RC; International Society for Clinical Densitometry. Official positions of the International Society for Clinical Densitometry. J Clin Densitom 2004;7(1):1-6.
10. Tobias JH, Cook DG, Chambers TJ, Dalzell N. A comparison of bone mineral density between Caucasian, Asian and Afro-Caribbean women. Clin Sci 1994;87:587-91.
11. Russell-Aulet M, Wang J, Thornston JC, Cott EW, Pierson RN Jr. Bone mineral density and mass in a cross-sectional study of white and Asian women. J Bone Miner Res 1993;8: 575-82.
12. Cundy T, Cornish J, Evans MC, Gamble G, Stapleton J, Reid IR. Sources of interracial variation in bone mineral density. J Bone Miner Res 1995;10:368-73. 13. Lin CC, Li CI, Chang CK, Liu CS, Lin CH, Meng NH, Lee YD, Chen FN, Li
TC. Reduced health-related quality of life in elders with frailty: a cross-sectional study of community-dwelling elders in Taiwan. PLoS One 2011;6(7):e21841. 14. Cui LH, Choi JS, Shin MH, Kweon SS, Park KS, Lee YH, Nam HS, Jeong SK,
Im JS. Prevalence of osteoporosis and reference data for lumbar spine and hip bone mineral density in a Korean population. J Bone Miner Metab
2008;26(6):609-17.
15. Fried LP, Tangen CM, Walston J, Newman AB, Hirsch C, Gottdiener J, Seeman T, Tracy R, Kop WJ, Burke G, McBurnie MA; Cardiovascular Health Study Collaborative Research Group. Cardiovascular Health Study Collaborative Research Group: Frailty in older adults: evidence for a phenotype. J Gerontol A Biol Sci Med Sci 2001;56(3):M146-M156.
16. Orme J, Reis J, Herz E. Factorial and discriminate validity of the Center for Epidemiological Studies depression (CES-D) scale. J Clin Psychol 1986;42:28-33.
17. Douchi T, Yamamoto S, Oki T, Maruta K, Kuwahata R, Nagata Y. Relationship between body fat distribution and bone mineral density in premenopausal Japanese women. Obstet Gynecol 2000;95:722-5.
18. Lau EM, Chan YH, Chan M, Woo J, Griffith J, Chan HH, Leung PC. Vertebral deformity in chinese men: Prevalence, risk factors, bone mineral density, and body composition measurements. Calcif Tissue Int 2000;66:47-52.
19. Reid IR. Relationships among body mass, its components, and bone. Bone 2002;31:547-55.
20. David V, Martin A, Lafage-Proust MH, Malaval L, Peyroche S, Jones DB, Vico L, Guignandon A. Mechanical loading down-regulates peroxisome proliferator-activated receptor gamma in bone marrow stromal cells and favors osteoblastogenesis at the expense of adipogenesis. Endocrinology 2007;148(5):2553-62.
21. Sen B, Xie Z, Case N, Ma M, Rubin C, Rubin J. Mechanical strain inhibits adipogenesis in mesenchymal stem cells by stimulating a durable betacatenin signal. Endocrinology 2008;149(12):6065-75.
22. Reid IR, Ames R, Evans MC, Sharpe S, Gamble G, France JT, Lim TM, Cundy TF. Determinants of total body and regional bone mineral density in normal postmenopausal women-a key role for fat mass. The Journal of clinical endocrinology and metabolism 1992;75(1):45-51.
23. Villareal DT, Apovian CM, Kushner RF, Klein S. Obesity in older adults: technical review and position statement of the American Society for Nutrition and NAASO, The Obesity Society. The American journal of clinical nutrition 2005;82(5):923-34.
24. Frisoli A Jr, Chaves PH, Ingham SJ, Fried LP. Severe osteopenia and osteoporosis, sarcopenia, and frailty status in community-dwelling older women:
results from the Women's Health and Aging Study (WHAS) II. Bone. 2011;48 (4):952-7.
25. Joseph C, Kenny AM, Taxel P, Lorenzo JA, Duque G, Kuchel GA. Role of endocrine-immune dysregulation in osteoporosis, sarcopenia, frailty and fracture risk. Mol Aspects Med. 2005;26(3):181-201.
26. Giampietro PF, McCarty C, Mukesh B, McKiernan F, Wilson D, Shuldiner A, Liu J, LeVasseur J, Ivacic L, Kitchner T, Ghebranious N. The role of cigarette smoking and statins in the development of postmenopausal osteoporosis: a pilot study utilizing the Marshfield Clinic Personalized Medicine Cohort. Osteoporos Int 2010;21(3):467-77.
27. Oncken C, Prestwood K, Kleppinger A, Wang Y, Cooney J, Raisz L. Impact of smoking cessation on bone mineral density in postmenopausal women. J Womens Health (Larchmt) 2006;15:1141-50.
28. Bernaards CM, Twisk JW, Snel J, van Mechelen W, Lips P, Kemper HC. Smoking and quantitative ultrasound parameters in the calcaneus in 36- year-old men and women. Osteoporos Int 2004;15(10):735-41.
29. Kanis J A, Johnell O, Oden A, Johansson H, De Laet C, Eisman JA, Fujiwara S, Kroger H, McCloskey EV, Mellstrom D, Melton LJ, Pols H, Reeve J, Silman A, Tenenhouse A. Smoking and fracture risk: a meta-analysis. Osteoporosis Int 2005;16(2):155-62.
30. Law MR, Hackshaw AK. A meta-analysis of cigarette smoking, bone mineral density and risk of hip fracture, recognition of a major effect. BMJ 1997;315(7112):841-6.
31. Ward KD, Klesges RC. A meta-analysis of the effects of cigarette smoking on bone mineral density. Calcif Tissue Int 2001;68(5):259-70.
32. Tamaki J, Iki M, Fujita Y, Kouda K, Yura A, Kadowaki E, Sato Y, Moon JS, Tomioka K, Okamoto N, Kurumatani N. Impact of smoking on bone mineral density and bone metabolism in elderly men: the Fujiwara-kyo Osteoporosis Risk in Men (FORMEN) study. Osteoporos Int 2010;22(1):133-41.
33. Sneve M, Emaus N, Joakimsen RM, Jorde R. The association between serum parathyroid hormone and bone mineral density, and the impact of smoking: the Tromso Study. Eur J Endocrinol 2008;158(3):401-9.
34. Cornuz J, Feskanich D, Willett WC, Colditz GA. Smoking, smoking cessation, and risk of hip fracture in women. Am J Med 1999;106 (3):311-4.
35. Broulik PD, Jaráb J. The effect of chronic nicotine administration on bone mineral content in mice. Horm Metab Res 1993;25(4):219-21.
36. Hollinger JO, Schmitt JM, Hwang K, Soleymani P, Buck D. Impact of nicotine on bone healing. J Biomed Mater Res 1999;45(4):294-301.
37. César-Neto JB, Duarte PM, Sallum EA, Barbieri D, Moreno H Jr, Nociti FH Jr. A comparative study on the effect of nicotine administration and cigarette smoke inhalation on bone healing around titanium implants. J Periodontol 2003;74(10):1454-9.
38. Gao SG. Bone turnover in passive smoking female rat: relationships to change in bone mineral density. BMC Musculoskeletal Disorders 2011;12:131.
Figure legends
Figure 1. Relationship between osteoporosis and frailty components (A) and number of frailty components (B). All odds ratios were derived from models considering age, gender, BMI, smoking, and drinking; adjusted odds ratios and their 95% CI shown as circle point and vertical bar.
(A)
0 1 2 3 4 5
Weight loss Exhaustion Low physical activity Walk time slowly Grip failure
Odds ratio (95% CI) 1.45 1.75 p<0.05 1.39 1.58 0.90 (B) 0 1 2 3 4 5 6 Frailty components=0 Frailty components=1 Frailty components=2 Frailty components 3
Odds ratio (95% CI) 1.20
2.74 p<0.01
1.43
Figure 1. Relationship between osteoporosis and frailty components (A) and number of frailty components (B). All odds ratios were derived from models considering age, gender, BMI, smoking, and drinking; adjusted odds ratios and their 95% CI shown as
Table 1. Age-stratified anthropometric traits (mean ± standard deviation) of subjects Age(years) Number Height (cm) Weight (kg) BMI (kg/m2)
Men 65-69 120 164.2±5.6 65.8±9.5 24.4±3.2 70-74 104 164.2±5.6 65.4±9.1 24.2±2.8 75-79 103 162.4±4.8 64.6±9.6 24.5±3.1 80+ 90 162.4±6.2 61.3±9.9 23.2±3.4 Total 417 163.4±5.6 64.4±9.6 24.1±3.2 Women 65-69 111 153.3±5.8 57.7±9.2 24.5±3.5 70-74 88 152.7±5.7 56.9±7.6 24.4±3.2 75-79 63 152.4±5.8 57.0±9.4 24.6±4.1 80+ 32 150.4±5.7 55.4±9.3 24.5±4.1 total 294 152.6±5.8 57.0±8.8 24.5±3.6
Table 2. Norm data for bone mineral density (BMD, g/cm2) at various skeletal sites in elders living in Taichung City, Taiwan
Age(years) Number Lumbar spine (L2-L4) (mean±sd) Femoral neck (mean±sd) Ward’s triangle (mean±sd) Trochanter (mean±sd) Total hip (mean±sd) Men 65-69 120 1.163±0.21 0.847±0.14 0.663±0.15 0.777±0.13 0.932±0.14 70-74 104 1.165±0.22 0.845±0.14 0.658±0.17 0.775±0.16 0.921±0.1 7 75-79 103 1.221±0.22 0.832±0.13 0.646±0.14 0.773±0.13 0.918±0.15 80+ 90 1.230±0.24 0.831±0.15 0.627±0.15 0.775±0.15 0.915±0.16 Women 65-69 111 1.033±0.18 0.801±0.11 0.618±0.12 0.687±0.10 0.867±0.12 70-74 88 1.010±0.20 0.781±0.12 0.593±0.17 0.678±0.13 0.847±0.13 75-79 63 0.979±0.18 0.717±0.10 0.508±0.11 0.615±0.11 0.777±0.12 80+ 32 0.956±0.16 0.661±0.13 0.465±0.12 0.579±0.12 0.733±0.1 4
Table 3. Prevalence of osteoporosis among Taiwanese elderly, using BMD reference values of Korean and Chinese population stratified by age and gender (%)
Age Lumbar spine (L1-L4) Femoral neck Total hip
Korea Chinese Korea Chinese Korea Chinese
Men 65~70 0.00 0.00 6.67 6.67 10.00 5.83 70~75 0.96 3.85 9.62 9.62 19.23 8.65 75~80 0.97 0.70 9.71 8.74 14.56 4.85 80+ 1.11 2.22 14.44 12.22 17.78 8.89 total 0.72 1.68 9.83 9.11 15.11 6.95 Women 65~70 9.91 9.01 9.01 4.50 21.62 4.50 70~75 12.50 12.50 18.18 11.36 36.36 10.23 75~80 20.63 20.63 31.75 20.63 47.62 20.63 80+ 28.13 25.00 50.00 37.50 56.25 28.13 total 14.97 14.29 21.09 13.61 35.37 12.24
Table 4. Prevalence of osteoporosis according to demographic, lifestyle, characteristics and self-reported illnesses
Total Prevalence of osteoporosis
P value for Chi-square test
Crude Adjusted
Variable N % n % (95% CI) OR (95% CI) OR (95% CI)
Gender <0.001 Women 294 41.35% 71 24.15% (19.26%, 29.04%) 1.00 1.00 Men 417 58.65% 46 11.03% (8.02%, 14.04%) 0.39 (0.26,0.59) *** 0.24 (0.15, 0.40) *** Age (years) <0.001 65-69 231 32.49% 25 10.82% (6.82%, 14.83%) 1.00 1.00 70-74 192 27.00% 32 16.67% (11.40%, 21.94%) 1.65 (0.94, 2.89) 1.86 (1.03, 3.35) * 75-80 166 23.35% 29 17.47% (11.69%, 23.25%) 1.74 (0.98, 3.11) 1.80 (0.96, 3.36) >80 122 17.16% 31 25.41% (17.68%, 33.14%) 2.81 (1.57, 5.02) *** 3.24 (1.67, 6.28) *** BMI (kg/m2) <0.001 18.5 ≦ 28 3.94% 17 60.71% (42.62%, 78.80%) 1.00 1.00 18.5-24 306 43.04% 53 17.32% (13.08%, 21.56%) 0.14 (0.06, 0.31) *** 0.12 (0.05, 0.29) *** 24-27 246 34.60% 30 12.20% (8.11%, 16.28%) 0.09 (0.04, 0.21) *** 0.09 (0.04, 0.23) *** 27 ≧ 131 18.42% 17 12.98% (7.22%, 18.73%) 0.10 (0.04, 0.24) *** 0.08 (0.03, 0.22) *** Smoking 0.5012 No 641 90.15% 103 16.07% (12.23%, 18.91%) 1.0 1.0 Yes 70 9.85% 14 20.00% (10.63%, 29.37%) 1.31 (0.70, 2.43) 2.66 (1.27, 5.56) ** Alcohol 0.6542 No 601 84.53% 101 16.81% (13.82%, 19.79%) 1.0 1.0
Yes 110 15.47% 16 14.55% (7.96%, 21.13%) 0.84(0.48, 1.49) 1.08 (0.55, 2.10)
Frailty 0.0002
Yes 79 11.11% 25 31.65% (21.39%, 41.09%) 2.72 (1.61, 4.59) *** 2.11 (1.16, 3.84)*
No 632 88.89% 92 14.56% (11.81%, 17.31%) 1.00 1.00
CI, confidence interval.