temperature based on objective functions
Yung-Yaw Chen
Department of Electrical Engineering, National Taiwan University, Taipei, Taiwan
Win-Li Lina)
Institute of Biomedical Engineering, National Taiwan University, Taipei, Taiwan
Hau-Li Liou
Department of Electrical Engineering, National Taiwan University, Taipei, Taiwan
Jia-Yush Yen
Department of Mechanical Engineering, National Taiwan University, Taipei, Taiwan
Ming-Jium Shieh
Institute of Biomedical Engineering, National Taiwan University, Taipei, Taiwan
~Received 16 March 1998; accepted for publication 2 March 1999!
The purpose of this paper is to develop and evaluate a self-tuning fuzzy logic controller for a scanned focused ultrasound hyperthermia system with the reference temperature (Tr) determined from objective functions. This work employs simulation programs to develop the power deposition for the scanned focused ultrasound system and to solve the responses of temperature profiles based on the transient bioheat transfer equation. A fuzzy logic control algorithm is employed to determine the output power level for the heating system and an observer for blood perfusion variation is used to enhance the capability of the controller to adjust the required output power level for the treatment due to the drastic change of the blood perfusion. The reference temperature (Tr) for the controller is based on objective functions to tune its value during the heating process, while a control tem-perature (Tc) from the thermosensors located in the tumor region is used as the input for the controller. The objective function based on the entire temperature profile is used to evaluate the appropriateness of the heating temperature distribution for a time-variational blood perfusion. Simulation results demonstrate that the tumor region can be rapidly heated to the desired tempera-ture level and maintained at that level despite blood perfusion variation. The resulting temperatempera-ture profile, the objective function, and the output power level are related to the magnitude of blood perfusion, but are almost independent of the Tc location and the initial setting value of Tr. The fuzzy logic control algorithm with Trdetermined from objective functions can be used for control-ling the entire temperature distribution through a single control temperature, and the combination of control and optimization allows appropriate temperature fields to be created during the entire heating process. The control algorithm does not require the accurate prior knowledge of the loca-tions of the thermosensors and the appropriate setting value for Tr. © 1999 American Association of Physicists in Medicine.@S0094-2405~99!01805-2#
Key words: self-tuning fuzzy logic controller, objective function, reference temperature, control temperature, scanned focused ultrasound hyperthermia
I. INTRODUCTION
The goal of hyperthermia treatment is to calculate the com-plete temperature field, to adjust power deposition param-eters, and then to optimize the proposed thermal treatment by maximizing the therapeutic effects of the tumor temperature distribution while minimizing normal tissue damage and pa-tient stress.1To achieve this goal, several investigators have proposed and/or applied control systems to hyperthermia treatments. For example, Fenn and Gerald2 investigated a computer-controlled adaptive phased-array radio-frequency hyperthermia system for improved therapeutic tumor heat-ing. The steepest decent algorithm is applied to derive the optimal power levels for several channels within the region of the tumor and neighboring normal tissues. The measured
data indicate that with an adaptive hyperthermia array it may be possible to maximize the applied electric field at a tumor position and simultaneously minimize the occurrences of hot spots at the target position. Van Baren et al.3 developed a feedback control algorithm for control of tumor temperature during phased-array ultrasound hyperthermia treatments. They set different desired temperatures as the reference tem-peratures for some thermosensors and the temtem-peratures in-duced by the specified power patterns are mutually decou-pled. Based on a simplified state-space model for the bioheat transfer equation and the least-squared error to evaluate the treatment, the tumor heating was controlled such that the actual temperatures were as close as possible to the specified temperatures. Potocki and Tharp4used the information from
sured temperatures and the regulated power outputs. Finally, Lin and co-workers5,6employed an optimization scheme and a control algorithm to control a two-dimensional~2D! tem-perature field for a scanned focused ultrasound system to overcome the blood perfusion variation. When applying the control algorithm to determined the magnitude of output power, they found that the locations and the target tempera-ture of control thermocouples had significant influence on the resulting temperature distribution and the output power level due to the Gaussian shape of the ultrasound power deposition combined with the circular scan path.
The goal of the above control algorithms mainly focused on the control of the thermosensors’ temperatures to the given values3,5 or on the occurrences of hot spots in the normal tissue while applying the maximum power in the tumor.2 However, the thermal performance would be strongly influenced by the locations of the measured tem-peratures and/or the given values for the control thermosensors.4–6The proposed control algorithm with a ref-erence temperature (Tr) based on objective functions can produce a temperature distribution which is able to optimize the proposed thermal treatment1 during the entire heating process, while the heating result is not significantly influ-enced by the control thermosensor locations or the given values of the reference temperatures.
The blood perfusion distribution is known to be one of the most important factors that affects temperature distributions in hyperthermia. A parametric study has been done7and the results show that appropriate temperature distributions can be obtained for a large range of spatial variations for blood perfusion ~1–10 kg m23s21for the normal tissue and 0–5 kg m23s21 for the tumor tissue! using optimization tech-niques. However, blood perfusion is also a time-variational unknown during the hyperthermia treatment; it is important to include some form of feedback control to compensate for this factor. Hence, the objective of this work is to develop a control algorithm to obtain the optimal temperature distribu-tion within the heating region with constraint on the output measured temperatures and containing blood perfusion that is initially unknown and/or varies with time. A uniform per-fusion for the tumor and normal tissue is assumed and an optimization method7 is employed to search for the set of scan parameters which can form a power deposition confor-mal to the tumor region. A self-tuning fuzzy logic controller with the reference temperature (Tr) based on objective func-tions is employed to tune the power level to meet the treat-ment requiretreat-ments. This fuzzy controller with this type of Tr can overcome the blood perfusion variation and drive the heating temperature field to the optimal condition, which is independent of the thermosensor location of the control tem-perature (Tc) and the initial setting value of Tr.
from the transducers arranged below the treatment volume. The four scan parameters ~tilt angle, rotation angle, focal depth, and scan radius! for the transducer that can be varied to obtain an appropriate heating configuration are shown. The magnitude of ultrasound output power can also be var-ied. When the transducer scanning speed is sufficient, the power deposition patterns could be considered symmetrical about the z axis for tissues with homogeneous ultrasound absorption properties. To calculate the absorbed power dis-tribution, first the power deposition pattern for a stationary transducer was calculated and the programs developed by Moros9 and Lin7 were used to tilt and rotate the stationary power deposition through given angles. Next, the power field was translated away from the central scan axis a distance equal to the scan circle radius to develop a power deposition pattern for a given scan radius. Finally a convolution integral of the stationary pattern was used to obtain the average power at each node to account for the scanning process. This program also converts the three-dimensional power field,
FIG. 1. ~a! The geometry of a scanned focused ultrasound heating system;
~b! the normalized power deposition for the set of scan parameters @tile
angle (ut) 40°, rotation angle (ur) 90°, scan radius (Rs) 1.0 cm, focal depth
10 cm~the distance between the skin and the focal plane!#, and the trans-ducer~radius of curvature 20 cm, diameter 10 cm, and frequency 1.0 MHz!;
~c! a 3 cm33 cm cylindrical tumor located in the central region and the
which is in Cartesian coordinates for the above tilting, rotat-ing, and translatrotat-ing, into a 2D field in cylindrical coordi-nates. Details of the above procedures are given by Lin.7An ultrasound transducer with a diameter of 10 cm, radius of curvature of 20 cm, and driving frequency of 1.0 MHz has been chosen for this study. To obtain a simple but realistic approximation of the power deposition, the ultrasound at-tenuation in tissue wa assumed to be an average of 10 Np/m for all simulations, and the power generated from all parts of the transducer was assumed to be attenuated equally at each depth.7,9
B. Temperature solver
To solve for the temperature distribution, Pennes’10 tran-sient bioheat transfer equation~BHTE! was used;
rc]T ]t 52k¹
2T1Wcb~T2T
ar!1Qp. ~1!
We chose the thermal properties to approximate averages for soft tissues.11–13 The thermal conductivity (k) is 0.5 (W m21°C21), the specific heat of blood (cb) is 3770 ~J kg21°C21!, and the arterial temperature (Tar) is 37 °C. The
density of absorbed ultrasonic power (Qp) was obtained ac-cording to the above power development. A blood perfusion (W) that keeps a constant value of space was used. The ana-tomic properties were assumed to be constant throughout the entire field, and metabolism was neglected due to its small contribution to the temperature changes.1,14 Thus, all cases had symmetrical, two-dimensional field (r,z). The diameter and the thickness of the cylindrical volume of the simulated tissue were both 20 cm. The boundary condition for the front end was a constant value, which was equal to the tempera-ture of the surface cooling water, and the other surface was a constant temperature 37 °C. The central axis was treated as adiabatic15,16because no energy transfer occurs in the radial direction at the center line due to the symmetry of both the power distribution and the anatomical properties.
C. Self-tuning fuzzy logic control algorithm
An overall control scheme is schematically shown in Fig. 2. A fuzzy logic controller with a blood perfusion variation observer is employed to determine the output power level for the heating system, and the control temperature (Tc) for the controller is selected from the thermosensors located within the tumor region. A time-varying reference temperature (Tr), which is based on objective functions associated with con-straints on temperature in the tumor and normal tissues, is
used as the target for Tc. The initial value for Tr is set between 43 and 46 °C. The sampling time for all simulations is 30 s. During the first five minutes ~ten steps!, the bang-bang control action and a fixed Tr are employed to give a fast rise time by using the maximum permissible power when Tc is low.
5
1. Design of self-tuning fuzzy logic controller In this study, a self-tuning fuzzy logic controller that is sufficiently robust over the ultrasound heating process is used.17,18The temperature different~e! between Tr and Tc, as well as the derivative (e˙! of the temperature difference, are regarded as the input variables for the fuzzy logic controller, while the derivative~p˙! of the output power ~p! for the con-troller is taken as the output variable. The fuzzy logic rule taken is
Ri: if e˙ is Ai and e is Bi then p˙ is Ci. ~2! The membership functions of fuzzy sets for the inputs and output are shown in Fig. 3, and Table I is used as the control rule base. This is a PI-like~proportional-integral! fuzzy logic controller.
To overcome the problem caused by variation of blood perfusion more effectively during the treatment process,19,20 a self-tuning mechanism is employed to observe the change of blood perfusion and modify the output power level for the fuzzy logic controller. The derivatives ( p˙,T˙c) of the output power and the control temperature together with the differ-ence ~e! between Tr and Tc are regarded as the input vari-ables for the self-tuning mechanism. A scale (kb) is taken as the output to more precisely adjust the output power level for FIG. 2. Conceptual block diagram of the self-tuning fuzzy logic controller
with an observer for the blood perfusion variation and the reference tem-perature (Tr) as defined by Eq.~5!.
FIG. 3. The input and output membership functions of the fuzzy sets for the self-tuning fuzzy logic controller. The fuzzy set NB means negative big; NM, negative medium; NS, negative small; ZE, zero; PS, positive small; PM, positive medium; and PB, positive big.
TABLEI. The rule base for the fuzzy logic controller.
e
\
e˙ P˙ NB NS ZE PS PB NB NB NB NM NS ZE NS NB NM NS ZE PS ZE NM NS ZE PS PM PS NS ZE PS PM PB PB ZE PS PM PB PBthe controller to meet the requirement of the dramatic blood perfusion variation. The self-tuning mechanism rule is de-fined as Rj: if T˙c~n21! is Aj and p˙~n21! is Bj and e~n21! is Cj then kb~n! is Dj, ~3! where T˙c~n21!5Tc~n21!2Tc~n22!, and p˙~n21!5p~n21!2p~n22!.
The membership functions for the inputs and output are shown in Fig. 4, and Table II is the self-tuning mechanism rule base.
2. Objective functions and reference temperature In order to achieve an optimal temperature field for the treatment region during the treatment process, a treatment goal must be defined. Subsequently, a suitable control algo-rithm is employed to appropriately vary the output power level when the ultrasound heating system is arranged accord-ing to the optimal scan parameters obtained from an optimi-zation algorithm. Conventionally, the treatment goal is to set an appropriate reference temperature for the control thermosensors,3,5and then use a control algorithm to tune the output power level for the heating system based on the dif-ference between the redif-ference and the control temperatures. The treatment goal given here is to heat the treatment region and maintain the temperature as close as possible to an ideal temperature distribution by minimizing an appropriate objec-tive function during the treatment.7 The ideal temperature
distribution defined here for the treatment region is a tem-perature profile between 43 and 46 °C for the tumor, and a maximum temperature for the normal tissue lower than 40 °C. Thus, the control algorithm chosen here is one which attempts to achieve this goal during the entire treatment pro-cess by minimizing the following least-squared objective function with a time-varying reference temperature:
J~n!5@J1~n!1J2~n!#/M, ~4!
where
J1~n!5(@Ti~n!246#21(@Tj~n!240#2,
with TiPtumor and .46 °C, TjPnormal tissue and .40 °C, J2~n!5(@Tk~n!243#2,
with TkPtumor and ,43 °C,
where J(n) is the objective function based on the measured temperatures of the tumor and normal tissues; J1(n) and
J2(n) represent the subobjective functions for the tumor/
normal tissue temperature higher than and the tumor tem-perature lower than the requirements, respectively; M repre-FIG. 4. The input and output membership functions of the fuzzy sets for the
self-tuning mechanism used as the blood perfusion variation observer.
FIG. 5. The temporal variation of blood perfusion during the heating pro-cess.
TABLEII. The rule base for the self-tuning mechanism used as the variation observer for blood perfusion.
T˙c P˙ e Kb T˙c P˙ e Kb T˙c P˙ e Kb NS NS NS PS ZE NS NS PS PS NS NS ZE NS NS ZE ZE ZE NS ZE ZE PS NS ZE NS NS NS PS NS ZE NS PS NS PS NS PS PB NS ZE NS PS ZE ZE NS PS PS ZE NS ZE NS ZE ZE ZE ZE ZE ZE ZE PS ZE ZE ZE NS ZE PS ZE ZE ZE PS ZE PS ZE PS NS NS PS NS PB ZE PS NS PS PS PS NS PS NS PS ZE PS ZE PS ZE ZE PS PS ZE ZE NS PS PS ZE ZE PS PS ZE PS PS PS NS
sents the total number of thermosensors, n denotes the heating time series, and i,j,k, are the indices for the ther-mosensor locations.
The objective function J(n) is based on the two subob-jective functions J1(n) and J2(n), which are associated with
constraints on temperature in the tumor and normal tissues ~hot/cold spots!. To achieve a treatment temperature always close to the ideal temperature distribution during the heating process, a time-varying reference temperature formed by J1(n) and J2(n) with a proper weighting is used for the
controller to supply a temporally appropriate power level to overcome the variation of blood perfusion, which is un-known in treatments,
Tr~n11!5Tr~n!1kp$@J2~n!#1/22k0@J1~n!#1/2%, ~5!
where Tr(n) is the reference temperature for the control ther-mosensor; and kp, k0 denote the gain and the weighting of
J1(n) and J2(n), respectively.
The gain (kp) determines the convergence speed, while the weighting (k0) is related to the final value of the
objec-tive function when a controller with this Tr is employed. In the following study, kp and k0 are taken as 0.5 and 1.0,
respectively, which can give a fast convergence speed and a low value of the objective function close to the minimum ~using optimization techniques7!.
III. RESULTS AND DISCUSSION
A cylindrical tumor with 3 cm for both diameter and thickness is located at a 10 cm depth, and a uniform blood perfusion was assumed for both tumor and normal tissue. The scan parameters used are 40° for tilt angle, 90° for ro-tation angle, 1.0 cm for scan radius, and 10 cm for the focal depth. Two thermoprobes~with nine measurement locations totally! are arranged: one is along the axial axis for the scan-ning transducer and the other is along the central axis of the heating volume. Figures 1~b! and 1~c! depict the control vol-ume, the tumor region, the thermosensor locations, and the two-dimensional ultrasound power deposition formed by this set of scan parameters. The blood perfusion is assumed to be FIG. 6. Effect of the reference temperature (Tr) on the temperature profiles and the objective function.~a! is the temperature profile for a fixed value of Tr543 °C. The solid and the dashed curves are for the thermosensors located in the tumor and normal tissue regions, respectively; the horizontal line is for
the fixed Tr; and the solid curve with open symbols is for Tc.~b! is the temperature profile for Tras defined by Eq.~5!; the curves for Tcand Trare close
together during the heating process.~c! is the response of the objective functions for Tr as defined by Eq.~5! or kept constant at 43, 44, 45, and 46 °C,
uniform within the treatment domain for tumor and normal tissue but varied temporally as shown in Fig. 5.19
The responses of the temperature profiles and the objec-tive function are used to evaluate the performance of the self-tuning fuzzy controller with regards to the location of the control temperature (Tc), the setting value of the refer-ence temperature (Tr), and the variation of blood perfusion. Figure 6~a! is the computer simulation result for the response of the temperature profiles when a fixed value of Trat 43 °C is used for the controller. Figure 6~a! indicates that with a fixed Tr, Tc can reach Tr within a short period of heating time and be maintained within a reasonable range even though the perfusion varies dramatically during the heating process. However, the temperature profile shows that the overall temperature field is influenced by the setting value of Tr and a higher Tr results in a higher entire temperature profile. This relationship between the temperature profile and the fixed value of Trreveals that the conventional controllers with a fixed Trresult in temperature distributions which de-pend on the value of Tr and cannot automatically meet the requirements for the hyperthermia treatment. To reduce the
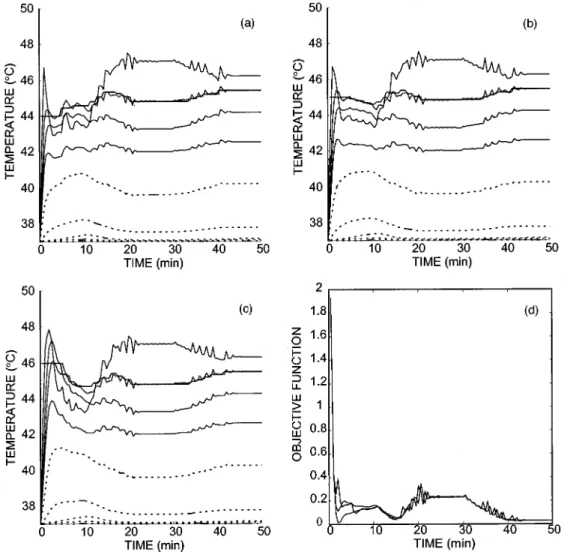
influences of Tr and blood perfusion on the overall tempera-ture field and to achieve a better temperatempera-ture profile for the entire heating process, a modified, time-varying Tr as de-fined by Eq. ~5! is employed. Figure 6~b! shows the re-sponses of the control temperature (Tc), the reference tem-perature (Tr), and the entire temperature profile when Tr as defined by Eq. ~5! is used for the self-tuning fuzzy logic controller. Figure 6~b! also illustrates that Tc follows Tr closely, and the measured tumor temperatures move to and then maintain in the range of 43–46 °C during the heating process. Figure 6~c!, which shows the response of the objec-tive functions for this Tras well as fixed Trequal to 43, 44, 45, and 46 °C, respectively, indicates that the objective func-tion is varied with Trand heating time, and that the response for this Tr is always in the lowest level except in the initial stage where the objective function is mainly influenced by the initial setting value of Tr. After the value of Tr is ad-justed, the objective function falls to the lowest level. The simulation results give evidence that the self-tuning fuzzy logic controller with Tr as defined by Eq. ~5! can drive the overall temperature profile to the optimal condition during FIG. 7. Effect of the initial setting value of Tron the temperature profiles and the objective functions.~a!–~c! are the response of Trand the temperature
profiles for Trinitially set at 44, 45, and 46 °C, respectively; the solid and the dashed curves are for the thermosensors within the tumor and the normal tissue
regions, respectively; the solid curve with open symbols is for Tc; and the solid curve close to Tcis for Tr.~d! is the response of the objective functions for Trinitially set at 44, 45, and 46 °C, respectively.
the entire treatment process instead of only maintaining be-tween Tcand Tr.
The influence of the initial setting value for Tr on the entire temperature profile during the heating process is also studied. Figures 7~a!–7~c! are the simulation results for the responses of temperature profiles when an initial value for Tr at 44, 45, or 46 °C is used for the controller, respectively. Figure 7~d! shows the objective functions for the initial value of Trset at 44, 45, and 46 °C. These figures demonstrate that the influence of the initial value of Tr on the temperature profile only appears in the early part of the heating process. These simulation results indicate that the system perfor-mance is not affected by initial setting of Tr.
To examine the influence of the Tclocation on Trand the entire temperature profile, the thermosensors 2, 3, and 4 are individually taken as Tc with Tr set to 43 °C initially. Fig-ures 8~a!–8~c!, which show the response of the temperature profiles and the temporal variations of Tcand Trwhile Tcis set to the thermosensors 2, 3, and 4, respectively, reveal that the entire temperature profiles for all three cases are very close. In addition, Tc is able to track Tr closely in all cases. Figure 8~d!, which shows the response of objective functions
for thermosensors 1, 2, 3, and 4 taken as Tc, shows that the objective functions for all four cases coincide with one an-other and remain at the same level except for some minor disturbances over the entire heating process. Both the tem-perature profile and the objective function obviously demon-strate that the treatment heating result is almost independent of the Tclocation when Tras defined by Eq.~5! is employed for the self-tuning fuzzy logic controller.
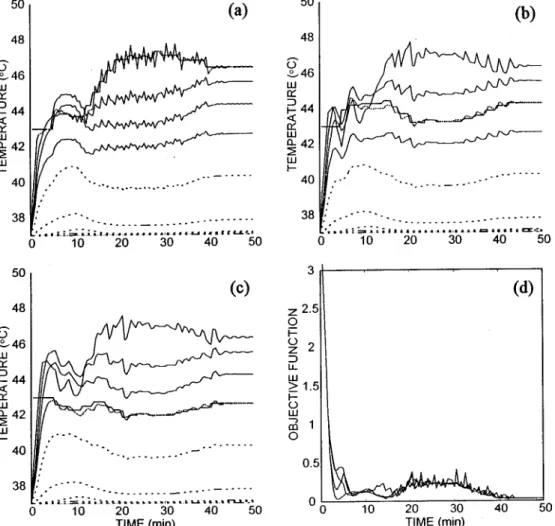
To examine the effects of the blood perfusion and the Tc location on the objective function and the output power level, the scan parameters ~tilt angle, rotation angle, scan radius, and focal depth! are maintained while the output power level is the only parameter to be tuned to achieve an appropriate temperature distribution. The blood perfusion is maintained constant for the entire volume at a value of 2, 5 or 10 kg m23s21, and the measured temperature for ther-mosensor 1, 2, 3, or 4 is taken as Tcfor the self-tuning fuzzy logic controller. Figures 9~a!–9~d! present the simulation re-sults showing the responses of the objective functions. The objective functions quickly come to the lowest level region and then are maintained at specific values which are related to the magnitude of the blood perfusion but independent of FIG. 8. Effect of the Tclocation on the reference temperature (Tr), the temperature profiles, and the objective function.~a!–~c! are the response of Trand the
temperature profiles for Tclocated at thermosensors 1, 2, and 3, respectively; the solid and the dashed curves are for the thermosensors within the tumor and
the normal tissue regions, respectively; the solid curve with open symbols is for Tc, and the solid curve close to Tcis for Tr.~d! is the response of the
the Tc location. A higher perfusion produces a larger value for the objective function. This finding obviously indicates that an appropriate temperature profile can be obtained and the profile adheres to the magnitude of the blood perfusion
but is independent of the Tc location as long as the ther-mosensor of Tc is located in the tumor region and Tr is determined by Eq.~5!. The effect of the blood perfusion on the temperature profile and the objective function can also be FIG. 9. Effect of the blood perfusion and the Tclocation on the objective
function and the output power level.~a!–~d! are the responses of the objec-tive functions for different blood perfusions, while Tcis located at
ther-mosensors 1, 2, 3, and 4, respectively; the three curves~from the bottom to the top! in each plot are for blood perfusion equal to 2, 5, and 10 kg m23s21, respectively.~e!–~g! are the responses of output power levels for different Tclocations, while the blood perfusion is 2, 5, and 10 kg m23s21,
seen in Figs. 7 and 8. The temperature profile related to the heating duration of 20–30 min is relatively more dispersed due to a higher blood perfusion ~20 kg m23s21!, however, the temperature profile still stays in the range of 43–46 °C to achieve a minimum objective function. Figures 9~e!–9~g!, which show the simulation results of the response of the output power levels for different blood perfusions, reveal that the output power approaches a specific value which is related to the magnitude of the blood perfusion but indepen-dent of the Tclocation~Tcvaried from thermosensor 1–4!. A higher output power is required to overcome the energy car-ried away by a higher blood perfusion. A higher perfusion appears to result in a greater fluctuation of output power level and the fluctuation is also related to the Tc location. The thermosensor of Tclocated at the location with a higher power density has a greater fluctuation of heating tempera-ture and output power level.5,6
IV. CONCLUSION
The paper presents an objective function-based Trused to adjust the reference temperature for a self-tuning fuzzy logic controller. The time-varying nature of the blood perfusion response illustrates that a controller of this design has the capability to provide appropriate regulation of ultrasound power for the scanned focused ultrasound heating system. Extensive simulation of the controller has shown that it has acceptable settling time, and that it is capable of maintaining the treatment temperatures within the desired range, compen-sating for the temporal variation of blood perfusion. The simulation results indicate that a control system of this de-sign has improved performance relative to existing control-lers in its robust performance, simple architecture, and algo-rithm, with no a priori requirement for blood perfusion identification. The simulation results using this control algo-rithm with Tr based on objective functions also demonstrate that there are no significant differences for the temperature profiles for different control thermosensor (Tc) locations and the initial setting value of the reference temperature (Tr). In the future, the control strategy should be tested in experi-mental evaluations to establish its robustness for patient safety and efficacy.
ACKNOWLEDGMENTS
The authors would like to thank the National Science Council and the Department of Health of the Republic of China for partially supporting this research under Contract Nos. NSC 87-2213-E-002-075 and DOH 87-HR-635, respec-tively.
a!Address for correspondence: Win-Li Lin, Institute of Biomedical
Engi-neering, College of Medicine, National Taiwan University, No. 1, Sec. 1, Jen-Ai Road, Taipei, Taiwan.
1R. B. Roemer, ‘‘Thermal dosimetry,’’ in Thermal Dosimetry and Treat-ment Planning, edited by M. Gautherie~Springer, Berlin, 1990!, pp. 119–
214.
2
A. J. Fenn and A. K. Gerald, ‘‘Experimental investigation of an adaptive feedback algorithm for hot spot reduction in radio-frequency phased-array hyperthermia,’’ IEEE Trans. Biomed. Eng. BME-43, 273–280~1996!.
3P. VanBaren, E. Beck, E. S. Ebbini, and C. A. Cain, ‘‘Feedback control
of temperature during hyperthermia treatments with phased-array ultra-sound applicators,’’ Proceedings of the 17th Annual Conference of IEEE Eng. in Med. and Biol. and 21st Canadian Med. and Biol. Eng. Confer-ence, Montreal, Canada, pp. 613–614~1995!.
4J. K. Potocki and H. S. Tharp, ‘‘Control strategy for hyperthermia,’’
Proceedings of the 2nd IEEE Conference on Control Application, Van-couver, Canada, Vol. 1, pp. 427–431~1993!.
5W.-L. Lin, R. B. Roemer, and K. Hynynen, ‘‘Theoretical and
experimen-tal evaluation of a temperature controller for scanned focused ultrasound hyperthermia,’’ Med. Phys. 17, 615–625~1990!.
6
W.-L. Lin, M. J. Shieh, R. B. Roemer, and C. Y. Wang, ‘‘Temperature control of ultrasound hyperthermia with optimal thermocouple location and target temperature,’’ Biomed. Eng. - Appl. Basis Comm. 5, 504–514
~1993!.
7W.-L. Lin, R. B. Roemer, E. G. Moros, and K. Hynynen, ‘‘Optimization
of temperature distributions in scanned focused ultrasound hyperther-mia,’’ Int. J. Hyperthermia 8, 61–78~1992!.
8A. W. Dutton, R. B. Roemer, and F. A. Gibbs, ‘‘A clincially integrated
scanned focused ultrasound hyperthermia,’’ Proceedings of the 7th Inter-national Congress on Hyperthermic Oncology~Rome, Italy, 1996!, Vol. 1, p. 92.
9
E. G. Moros, Simulations of scanned focused ultrasound hyperthermia: the effects of scanning speed, scanning pattern, and multiple tilted trans-ducers, Master thesis, University of Arizona~1987!.
10H. H. Pennes, ‘‘Analysis of tissue and arterial blood temperatures in the
resting human forearm,’’ J. Appl. Phys. 1, 93–122~1948!.
11H. F. Bowman, ‘‘Heat transfer mechanism and thermal dosimetry,’’ J.
Natl. Cancer Inst., Monograph 61, 437–445~1981!.
12
J. C. Chato, ‘‘Selected thermophysical properties of biological materi-als,’’ in Heat Transfer in Medicine and Biology: Analysis and
Applica-tions, edited by A. Shitzer and R. C. Eberhart, ~Plenum, New York,
1985!, Vol. 2, pp. 413–418.
13R. G. Gordon, R. B. Roemer, and S. M. Horvath, ‘‘A mathematical model
of the human temperature regulatory system—Transient cold exposure response,’’ IEEE Trans. Biomed. Eng. BME-23, 434–444~1976!.
14R. K. Jain, ‘‘Bioheat transfer: Mathematical models of thermal systems,’’
in Hyperthermia Cancer Therapy, edited by F. K. Storm~Hall Medical, Boston, 1983!, pp. 9–46.
15
J. H. Ferziger, Numerical Method for Engineering Application~Wiley, New York, 1981!.
16G. D. Smith, Numerical Solution of Partial Differential Equations: Finite Difference Methods~Clarendon, Oxford, 1989!.
17W. C. Daugherity, B. Rathakrishnan, and J. Yen, ‘‘Performance
evalua-tion of a self-tuning fuzzy controller,’’ Proceedings of the 1992 IEEE International Conference Fuzzy Systems—FUZZ-IEEE~San Diego, CA, 1992!, pp. 389–397.
18
C. C. Lee, ‘‘Fuzzy logic in control systems: Fuzzy logic controller—Part I,’’ IEEE Trans. Syst. Man Cybern. 20, 404–418~1990!.
19
D. P. Anhalt, K. Hynynen, and R. B. Roemer, ‘‘Patterns of changes of tumor temperatures during clinical hyperthermia: Implications for treat-ment planning, evaluation and control,’’ Int. J. Hyperthermia 11, 425– 436~1995!.
20C. W. Song, A. Lokshina, J. G. Rhee, M. Patten, and S. H. Levitt,
‘‘Im-plication of blood flow in hyperthermia treatment of tumors,’’ IEEE Trans. Biomed. Eng. BME-31, 9–16~1984!.