The Impact of CEO Characteristics on Corporate
Sustainable Development
Shihping Kevin Huang*
National Chiao Tung University, Hsinchu City, Taiwan
ABSTRACT
This study explores the relationship between CEO demographic characteristics and consistency
in corporate social responsibility (CSR) performance among
firms. The sample is based on
results from major ranking agencies between 2005 and 2010. A total of 661
firms were included
in the sample with 392 observations in total. The results indicate that
firms’ CSR performance,
as measured by the consistency of their CSR rankings, is associated with their CEOs’
educa-tional specializations in Master’s-level business administration (MBA) and science (MSc). In
addition, CEO tenure and gender are shown to affect
firms’ CSR performance. Furthermore,
a
firm’s number of employees also has a significant relationship with its CSR performance.
The results are encouraging for supporting universities’ efforts to integrate CSR issues into
their curricula. Copyright © 2012 John Wiley & Sons, Ltd and ERP Environment.
Received 2 February 2012; revised 9 April 2012; accepted 17 April 2012
Keywords: corporate social responsibility; CEO characteristics; corporate social performance; CSR ranking; sustainable development; CSR performance
Introduction
C
ORPORATE SOCIAL RESPONSIBILITY (CSR) IS NOT A ZERO SUM GAME BETWEEN BUSINESS AND SOCIETY. GOING BEYONDcompliance and creating shared value are crucial to any company’s CSR strategy (McWilliams and Siegel,
2001; Porter and Kramer, 2006; Waldman et al., 2006a, 2006b). Effective implementation of CSR
strategy allowsfirms to capture sustainable competitive advantage (McWilliams and Siegel, 2010). The
shareholder perspective believes that the purpose of thefirm is to maximize shareholder value (Friedman, 1970).
Consequently, many studies have been conducted to examine the linkage between corporatefinancial performance
(CFP) and CSR initiatives in order to rectify concerns from the shareholder perspective (Waddock and Graves, 1997; MacKey et al., 2007; Blomgren, 2011). Although the results between CFP and CSR initiatives have been mixed (McWilliams et al., 2006), major corporations such as Wal-Mart, Nike, and Starbucks, have started to integrate CSR practices into their corporate strategy as a response to stakeholder demand. Indeed, while the discourse of
CSR has been advanced from‘whether’ to ‘what’ and ‘how’ (Smith, 2003; Basu and Palazzo, 2008), companies have
exhibited different approaches toward CSR. Firms not only differ in their CSR performance but also in term of
consistency. Consistency is defined by Oxford Dictionaries as ‘the quality of achieving a level of performance which
*Correspondence to: Shihping Kevin Huang, PhD, Assistant Professor, Institute of Management Technology, National Chiao Tung University, 1001 University Road, Hsinchu City, 300, Taiwan. E-mail: kevin1003@gmail.com
Published online 21 May 2012 in Wiley Online Library (wileyonlinelibrary.com) DOI: 10.1002/csr.1295
does not vary greatly in quality over time’. CSR performance in this study is defined as ‘a firm’s consistent
appearance in CSR ranking’. CSR is more noticeable when firms become irresponsible (Bhattacharya and Sen,
2004; Aguilera et al., 2007). Thus performing in a consistent basis is a crucial factor. Scalet and Kelly (2010)
examined the ratings of 137firms listed in Innovest Global and CRO magazines between 2007 and 2008; they
found 37 firms had been dropped from the list. These firms, in many cases, had faced negative events that
precipitated their removal from the rankings. The results indicate that not everyfirm performs at a consistent level.
Diversities among companies’ CSR performance can be attributed to various causes, ranging from differences in
relevant institutions (Campbell, 2007; Matten and Moon, 2008) to CFP (Waddock and Graves, 1997). In any situation, managers are largely responsible for and are central to CSR initiatives (Agle et al., 1999; Waldman et al., 2006a, 2006b). However, studies have ignored the role of corporate leaders in formulating and implementing CSR policies (Waldman and Siegel, 2008). There is a lack of investigation into relevant managerial variables affecting CSR performance (Waldman et al., 2006a, 2006b; Angus-Leppan et al., 2010; Manner, 2010). This study
is an attempt tofill this literature void by exploring the connection between corporate decision makers’ attributes
and consistency in CSR performance by asking the following question: Which CEO demographical attributes affect CSR performance?
Drivers of CSR
The role of thefirm in society has been discussed in many studies (Garriga and Mele, 2004; Porter and Kramer, 2011). Defining CSR is not a straightforward endeavor but tends to depend upon perspective and point of view (Campbell, 2007; Matten and Moon, 2008). CSR goals and objectives are often conflicting or unclear as firms attempt to respond to various demands from diverse stakeholders, ranging from employees, customers, suppli-ers, and communities to media, NGOs and governments (McWilliams and Siegel, 2001; Ditlev-Simonsen and Midttun, 2011). The basic theme of CSR is‘the idea that it reflects the social imperatives and the social conse-quences of business success’ (Matten and Moon, 2008, P.405). However, the exact CSR manifestation and direction are largely at the discretion of thefirm (Matten and Moon, 2008). The major drivers associated with CSR can be divided into the following groups: stakeholder demands, performance, and motivation (Basu and Palazzo, 2008). The stakeholder theory suggests that ‘it can be beneficial for the firm to engage in certain CSR activities that non-financial stakeholders perceive to be important, because, absent this, these groups might withdraw their support for thefirm’ (McWilliams et al., 2006, p. 3). The performance-driven perspective has focused on the statistical relationship between CSR and CFP so as to justify the normative calls for managers to pay attention to CSR (Margolis and Walsh, 2003; Wood, 2010). In addition, the motivation–driven view stresses intrinsic motivations, such as moral virtue, and extrinsic reasons, such as reputation (Basu and Palazzo, 2008). Basu and Palazzo (2008) argue that‘simply documenting CSR-related activities without understanding their precipitating causes is unlikely to reveal real differences amongfirms, given the trend of rising homoge-neity and near standardization in CSR reporting’ (p.123). The major causes of CSR implementation depend upon those conditions relevant to the particular firm. Campbell (2007) identifies economic and institutional conditions as the primary basis forfirms to act in a socially responsible way. These basic economic conditions involve the firm’s financial performance, the level of industry competition, and the status of the economic environment. Institutional conditions include regulation and enforcement, the presence of independent monitoring organizations like NGOs and the press, institutionalized normative calls, as well trade unions and industry associations. Campbell (2007) also suggests that corporate managers’ experience in educational venues is likely to affect thefirm’s CSR implementation. However, it is the key decision-maker’s predominant attributes and personal qualities that tend to have the most pronounced effect upon the extent and the results of afirm’s CSR initiative (Waldman et al., 2006a, 2006b). Thefirm’s key decision maker, namely its CEO, is responsible for formulating corporate strategy pertaining to CSR (Waldman et al., 2006a, 2006b). The CEO is in a prime position to influence CSR strategy and practice (Waldman and Siegel, 2008; Battisti and Perry, 2011; Cassells and Lewis, 2011).
The Connection Between CSR Motivation and CEO Characteristics
CSR can be treated as a differentiation strategy (McWilliams and Siegel, 2001). It is suggested that‘firms pursuing product differentiation, image, or reputation-building strategies will have an incentive to be socially responsible’ (Waldman et al., 2006a, 2006b, p. 1704). One of the major purposes of thefirm is to satisfy customers by delivering a distinctive value proposition (Porter and Kramer, 2011). Polls have suggested that the majority of consumers consider CSR to be an important factor in making their purchasing decisions (Bhattacharya and Sen, 2004). Some companies respond to perceived CSR shortcomings reactively, as was evident in Wal-Mart’s attempt to create a ‘green’ rating scheme. Wal-Mart responded to stakeholder demand by requesting its suppliers disclose their sourc-ing information for this green ratsourc-ing (Keegan, 2011). On the other hand, some companies choose to embark upon CSR initiatives proactively. Ben and Jerry’s Ice Cream and the Body Shop are two such examples that have based their business models on CSR-driven strategies (Waldman et al., 2006a, 2006b). CSR offers managers an outlet to align their personal interests with a product differentiation strategy (McWilliams and Siegel, 2001). CSR is thus a strategic choice which allowsfirms to create shared value between managers’ personal interests and the social cause.
Strategic choice often reflects decision makers’ values and cognitive bases (Hambrick and Mason, 1984). One of the major themes of stakeholder theory deals with the way managers think about managing and how corporations are actually managed (Donaldson and Preston, 1995; Callan and Thomas, 2011). Stakeholder theory can be divided into three types: instrumental, normative, and descriptive (Donaldson and Preston, 1995). The instrumental aspect examines the connection between stakeholder management and traditional corporate objectives such as profitability. This instrumental aspect is concerned with consequences (Margolis and Walsh, 2003). The normative type identi-fies moral or philosophical guidelines of the operation and management of corporations (Donaldson and Preston, 1995). The descriptive type focuses on ‘whether and to what extent managers do in fact attend to various stakeholders and act in accordance with their interests’ (Margolis and Walsh, 2003, p. 279). The role of managerial leadership is imperative in stakeholder theory because strategic decisions are made by organizations’ powerful actors (Hambrick and Mason, 1984). The strategic choices of afirm’s CEO, its most powerful actor, are based on his or her personal interpretation, which is a function of his or her experiences, values, and personality (Hambrick, 2007). Since CEOs’ ideals mold their managers’ leadership practices, the key decision maker’s beliefs and value systems help to shape the wayfirms attend to various stakeholder demands. Accordingly, it is reasonable to expect that CEOs exert substantial influence over CSR as a strategic course for their firms. However, to move beyond merely positing a link between a firm’s CEO and its CSR performance, first we must identify applicable data to represent the CEO-CSR strategy relationship. To that end, this study will build upon Hambrick’s (2007) conclusion thatfirm leaders’ demographic characteristics can be used as proxies for their cognitive frames.
Theory and Hypotheses
Stakeholder theory implies that the extent to which managers attend to stakeholder interests is largely dependent upon the values and moral guidelines of managers. It is also suggested that the demographic composition of executives leads to different strategic choices (Cannella Jr. et al., 2008). CSR is a strategic choice. Therefore, executive demographic composition does have an impact on thefirm’s CSR strategy. Moreover, since stakeholders pay greater attention to irresponsible firms, it becomes crucial for firms to maintain a consistent level of CSR performance. This study is an attempt to examine the connection between executive demographic composition andfirm CSR performance. Wiersema and Bantel (1992) asserted several major demographic variables affecting strategic choice. These major variables are age, tenure, educational level, and educational specialization (Wiersema and Bantel, 1992). The executives’ gender also plays an important role in a company’s strategic outcome (Anderson, 2003). Five demographic variables of executives—age, gender, tenure, educational specialization, and nationality— were chosen for this study based on previous research (Hambrick and Mason, 1984; Bantel and Jackson, 1989; Wiersema and Bantel, 1992). Subsequent analysis is based on the following hypotheses:
Hypothesis 1. CEO gender is positively associated with consistency infirm CSR performance. Hypothesis 2. CEO average age is positively associated with consistency infirm CSR performance. Hypothesis 3. CEO tenure is positively associated with consistency infirm CSR performance.
Hypothesis 4. CEO educational specialization is positively associated with consistency infirm CSR performance. Hypothesis 5. CEO nationality is positively associated with consistency infirm CSR performance.
Research Design
Sample and Data
Related studies have utilized various research instruments such as surveys, content analyses and case studies (Waddock and Graves, 1997). This study uses regression analysis as the primary statistical technique. Many of the previous studies have been based upon the results from a single rating agency. However, since each agency actually applies different mechanism for measuring CSR performance, relying on the results of a single rating agency might result in source bias (Agle et al., 1999; Manner, 2010). To alleviate the potential bias problem, this study compiles major CSR rankings from the following rating agencies: the Global 100 by Corporate Knights between 2005 and 2010, CRO magazine’s 100 Best Corporate Citizens between 2005 and 2010, the Most Ethical Companies by Ethisphere between 2007 and 2010, and Newsweek’s Green Ranking between 2008 and 2010. A total of 661firms were included in the ranking. The listing frequencies of firms in these rankings range from 16 to 1. The average frequency is 2.69. The results indicate drastic disparity in terms of listing frequency in the sample. The sample was reduced to 487firms based upon availability of information. Financial data was collected for companies during the observed period in their respective rankings. The primary source of company data is the companies’ annual reports. Additional data was also collected from Datastream and Worldscope databases as well as LexisNexis. CEO demographic data was collected from the companies’ annual reports, websites, and press releases, as well as other data sources such as Dun & Bradstreet Reference Book of Corporate Management, Who’s Who in Finance and Industry, Business Week, Hoover’s Online, and SEC filings. We only used those observations with complete data for all variables. The screening process left us with 392 observations.
Dependent Variable: CSR Performance
‘What gets measured, gets managed’ (Dillenburg et al., 2003). Performance measurement is a crucial part of the management process. Effective measurements allow managers to monitor and adjust their strategy orientation. The definition or interpretation of CSR performance has varied among studies (MacKey et al., 2007). The most common variables for measuring CSR performance are accounting and market performance (McWilliams and Siegel, 2000; Margolis and Walsh, 2003; MacKey et al., 2007; Wood, 2010). Accounting performance is associated with thefirm’s financial results. Market performance is connected with equity and share value. The two variables are interrelated. Studies have used these indicators to analyze the relationship between a firm’s CSR activities and shareholder value (MacKey et al., 2007). However, sometimes maximizing shareholder wealth and benefitting stakeholders are competing objectives for organizational resources and managerial attention (Wood, 2010). Stakeholder interests are not always in line with those of the shareholders. Other studies have adopted different performance measurements such as CSR indices and ratings (Agle et al., 1999; Waldman et al., 2006a, 2006b; Angus-Leppan et al., 2010; Manner, 2010). This study applies the rating results between 2005 and 2010 from four major CSR rating agencies as the dependent variable.
Independent Variables: CEOs’ Demographic Compositions
This study adopts five variables – gender, age, tenure, educational specialization, and nationality – which are associated with CEO demographic compositions. These variables have been applied extensively in the related research (Wiersema and Bantel, 1992; Anderson, 2003). However, applying CEO demographic variables to CSR performance is still a rarity. Manner (2010) found that a CEO’s educational specialization, tenure, and gender do have an impact on the firm’s CSR performance. However, the sample in Manner’s research comprises only US firms with results from a single rating agency. Furthermore, Manner’s study did not have sufficient analyses of graduate degrees in science and engineering or CEO nationality. Waldman et al. (2006a, 2006b) have suggested that mangers from developed countries are slightly more aware of CSR issues during the decision making process. Some studies have underscored the importance of MBA and science education on students’ perceptions of CSR related issues (Woodruff, 2006; Lucena and Schneider, 2008; Navarro, 2008; Wu et al., 2010). Consequently, this study also tests business and science education as variables. The educational specialization variable includes eight categories: no university level degree, Bachelor of Arts (BA) in humanities and social science, Bachelor of Science and Engineering (BS), Master’s degree in science and engineering (MS), Master’s degree in business (MBA), Master of Arts in social science and humanities (MA), PhD in science and PhD in non-sciencefields. A CEO with a BA degree, for example, was entered as a dummy variable equal to one and zero otherwise. Each educational degree was applied using the same process. The gender of CEOs was recorded as a dummy variable, one for male and zero for female. In addition, nationality was also examined with a dummy variable for each of the prospective geographical regions, with one for the nationality in question and zero otherwise. CEO North American nationality, for example, was a dummy variable for which one represented North American countries and zero represented non-North American countries. The same coding process was then repeated to cover each geographical region.
Control Variables: Firm Attributes
The previous studies have suggested other factors such as thefirm’s financial performance and firm size might influence a firm’s CSR performance (Wood, 2010). This study also includes several control variables, such as operating profit before tax (OPBT), return on equity (ROE), and number of employees. An average of each firm’s financial variables was taken for their respective periods used for the CSR ranking data.
Analysis of Results
Table 1 lists the descriptive results of statistics and correlations for all the variables. Number of employees is the only control variable that is correlated with firm ranking frequency. The firm’s OPBT and ROE appear not to be correlated with ranking frequency. CEO tenure, gender, and educational specialization in MBA and MS degrees are correlated with ranking frequency. On the other hand, CEO age, nationality and educational background in certainfields, namely BA, BS, MA, and PhD degrees, are not correlated. Based on the results of Table 1, we can reject hypothesis 2 that there is a significant correlation between CEO age and firm CSR performance, as well as Hypothesis 5 since we did not observe any correlation between CEO nationality and firm CSR performance. Additionally, in terms of educational specialization, the results in Table 1 indicate that only some CEOs’ educational specializations affect the CSR performance of theirfirms. The results indicate that CEOs with MBA and MS degrees have better CSR performance.
Table 2 reveals the regression results for the frequency of thefirms’ CSR performance. Model A in Table 2 is the baseline model comprised only of the control variable– in this case, number of firm employees. Employee size is positively related to the firm’s consistent performance in CSR rankings. It appears that the number of company employees does play a role in thefirm’s CSR performance. The two additional control variables such as ROE and OPBT have weak associations withfirm CSR performance. We further examine the changes in adjusted R² and found that the adjusted R² for employee size (0.0438) is higher than OPBT and ROE (0.0373) as listed in Table 2. The results of adjusted R² for the control variables reveal that employee size is better suited for explaining afirm’s
Mean s.d. 1 2 3 4 5 6 7 8 9 10 11 12 13 14 15 16 17 18 19 20 1 3.18 2.73 2 55.2 7 6.15 0.0 5 3 15.91 10. 27 0.1 2 * 0.4 5 *** 4 0.84 0.36 0.10 + 0.0 2 0.11 + 5 0.02 0.14 0.0 9 0.0 2 0.0 0 0.0 0 6 0.58 0.49 0.05 0.0 4 0.14 * 0.0 6 0.02 7 0.38 0.49 0.0 3 0.0 2 0.0 3 0.0 4 0.0 6 0.1 3 * 8 0.63 0.48 0.1 6 ** 0.0 2 0.0 9 0.0 9 0.0 4 0.1 7 ** 0.0 7 9 0.18 0.38 0.1 2 * 0.0 0 0.0 4 1.46 + 0.0 7 0.1 4 ** 0.24 *** 0.08 10 0.06 0.24 0.0 8 0.0 2 0.0 3 0.0 9 0.0 4 0.0 7 0.0 5 0.04 0.1 4 * 11 0.12 0.32 0.0 3 0.1 1 + 0.0 3 0.0 2 0.17 ** 0.0 7 0.1 1 0.0 4 0.09 0.05 12 0.06 0.24 0.0 2 0.0 9 0.08 0.0 5 0.0 4 0.1 3 * 0.04 0.10 + 0.1 4 * 0.0 5 0.0 1 13 0.63 0.48 0.0 2 0.0 3 0.0 4 0.0 9 0.11 + 0.09 0.12 * 0.1 4 * 0.01 0.10 + 0.0 8 0.1 3 * 14 0.35 0.48 0.0 4 0.0 9 0.0 9 0.0 8 0.0 6 0.0 9 0.0 3 0.01 0.0 8 0.1 7 ** 0.0 6 0.05 0.58 *** 15 0.10 0.29 0.0 1 0.1 3 + 0.20 *** 0.0 6 0.04 0.02 0.0 1 0.11 + 0.0 3 0.1 1 + 0.0 8 0.11 + 0.23 *** 0.1 9 ** 16 0.00 0.06 0.05 0.0 3 0.00 0.0 2 0.0 0 0.0 7 0.08 0.0 4 0.03 0.02 0.16 ** 0.0 2 0.08 0.0 4 0.0 2 17 0.01 0.10 0.0 6 0.0 6 0.0 1 0.0 5 0.0 2 0.02 0.0 8 0.0 1 0.05 0.03 0.0 4 0.0 3 0.06 0.0 7 0.0 3 0.0 1 18 3.13 0.77 0.0 9 0.21 *** 0.20 *** 0.0 7 0.09 0.10 0.0 5 0.0 2 0.11 + 0.0 2 0.0 4 0.08 0.00 0.0 3 0.04 0.10 0.0 2 19 0.35 2.11 0.02 0.0 1 0.0 6 0.0 4 0.0 2 0.0 2 0.9 0 0.0 6 0.08 0.02 0.0 4 0.0 2 0.0 1 0.0 6 0.00 0.0 1 0.0 1 0.0 4 20 4.42 0.63 0.22 *** 0.0 7 0.14 ** 0.0 7 0.07 + 0.10 + 0.0 4 0.06 0.10 + 0.0 1 0.0 5 0.0 2 0.14 * 0.1 1 + 0.05 0.04 0.0 1 0.40 *** 0.08 Table 1. Correlations and summary statistics P value in parentheses. + P < 0.1, *p < 0.05, **p < 0.01, ***p < 0.001 1. CSR ranking frequency; 2. Age; 3. Tenure; 4. Gender; 5. High school degree; 6. Bachelor of arts; 7. Bachelor of science and engineering; 8. MBA; 9. Mas ter ’s degree in science and engineering; 10. Master of arts; 11. PhD; 12. PhD in science and engineering; 13. North American; 14. European; 15. Asian; 16. South Americ an; 17. A fican; 18. Operating pro fit before tax; 19. ROE; 20. Employee size
Table 2. Dependent variable: Ranking frequency Models model A model B model C model D model E model F model G model H model I model J model K model L model M model N model O model P model Q Tenure 0.026 + 0.029 + 0.030 + 0.026 + 0.033 * 0.029 + 0.031 * 0.033 * (0.097) (0.062) (0.051) (0.088) (0.034) (0.060) (0.042) (0.031) Gender 0.878 ** 0.954 * 0.768 + 0.747 + 0.847 * 0.823 + 0.611 0.689 (0.043) (0.028) (0.075) (0.086) (0.049) (0.059) (0.156) (0.109) MBA 0.960 ** 1.014 ** 0.909 ** 1.033 *** 0.962 ** 1.089 *** 0.987 ** 1.041 *** (0.003) (0.002) (0.005) (0.001) (0.003) (0.001) (0.002) (0.001) MS 1.024 ** 1.033 ** 0.930 * 1.130 ** 0.930 * 1.147 ** 1.049 ** 1.056 *** (0.013) (0.012) (0.024) (0.005) (0.023) (0.004) (0.010)) (0.009) Control variable OPBT 0.016 0.045 0.038 0.011 0.058 0.030 0.084 0.004 0.009 0.073 0.034 0.068 0.005 0.041 0.046 0.031 (0.942) (0.839) (0.864) (0.959) (0.790) (0.893) (0.702) (0.986) (0.966) (0.739) (0.876) (0.755) (0.980) (0.851) (0.829) (0.885) ROE 0.001 0.007 0.007 0.011 0.018 0.015 0.005 0.024 0.005 0.022 0.007 0.003 0.029 0.013 0.011 0.018 (0.994) (0.930) (0.922) (0.880) (0.813) (0.844) (0.948) (0.748) (0.950) (0.769) (0.926) (0.968) (0.694) (0.853) (0.884) (0.801) Employee 0.944 *** 0.937 *** 0.911 *** 0.963 *** 0.989 *** 0.986 *** 0.936 *** 0.962 *** 0.960 *** 1.009 *** 1.004 *** 1.048 *** 0.982 *** 0.977 *** 1.020 *** 1.059 *** 1.032 *** (0.000) (0.001) (0.001) (0.000) (0.000) (0.000) (0.001) (0.000) (0.000) (0.000) (0.000) (0.000) (0.000) (0.000) (0.000) (0.000) (0.000) constant 0.993 1.010 1.115 0.451 1.758 1.550 0.521 1.922 + 1.663 1.229 1.026 2.411 * 1.354 1.096 2.590 * 1.944 2.075 + (0.370) (0.375) (0.327) (0.699) (0.127) (0.178) (0.654) (0.095) (0.148) (0.299) (0.387) (0.038) (0.251) (0.353) (0.026) (0.107) (0.084) R² 0.0471 0.0471 0.0561 0.0604 0.0758 0.0673 0.0716 0.0878 0.0767 0.0859 0.0768 0.1003 0.1000 0.0880 0.1131 0.1065 0.1209 Adj. R² 0.0438 0.0373 0.0431 0.0475 0.0631 0.0545 0.0556 0.0721 0.0607 0.0701 0.0609 0.0848 0.0813 0.0691 0.0946 0.0880 0.0996 R² ( v.s. model B) 0 0.009 0.0133 0.0287 0.0202 0.0245 0.0407 0.0296 0.0388 0.0297 0.0532 0.0529 0.0409 0.066 0.0594 0.0738 Table 2. Full sample regressions on CSR P value in parentheses. + P < 0.1, *p < 0.05, **p < 0.01, ***p < 0.001 Table 2. Dependent variable: Ranking frequency Models model A model B model C model D model E model F model G model H model I model J model K model L model M model N model O model P model Q Tenure 0.026 + 0.029 + 0.030 + 0.026 + 0.033 * 0.029 + 0.031 * 0.033 * (0.097) (0.062) (0.051) (0.088) (0.034) (0.060) (0.042) (0.031) Gender 0.878 ** 0.954 * 0.768 + 0.747 + 0.847 * 0.823 + 0.611 0.689
CSR performance than OPBT and ROE. CEO gender is not significant when tested in combination with MBA and MS degrees as indicated in model P and model Q. However, the CEO’s gender might influence the firm’s CSR performance since gender is the only independent variable with a negative coefficient. The positive relationship between CEO educational specialization (specifically MBA and MS degrees) and consistent CSR performance is stronger than that between gender and CSR performance. A CEO having an MBA degree is the most crucial factor in improving model B’s R², followed by an MS degree, and then the other factors, gender and tenure. In comparison with Model B, the R² differences for MBA is 0.0287, MS is 0.0202, gender is 0.0133, and tenure is 0.009, shown in Table 3. The results in Table 2 indicate that a CEO with an MBA or an MS degree is the major factor influencing a firm’s CSR performance.
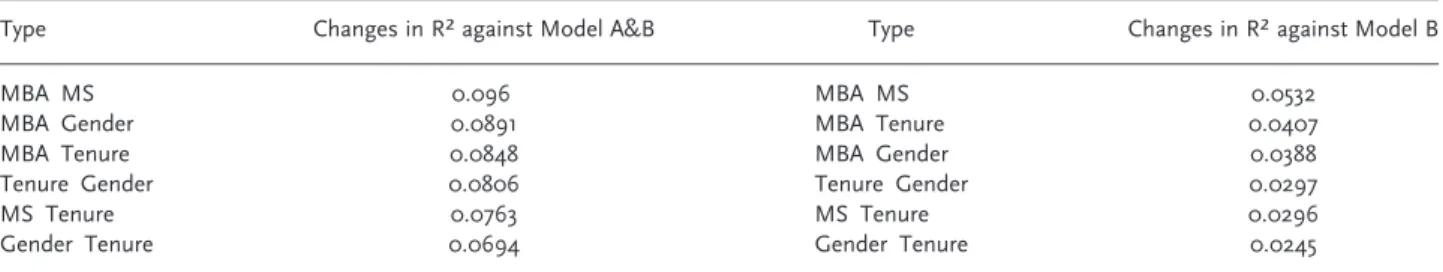
Moreover, we also pair up variables to test the changes in R² in comparison with model B as listed in Table 4. The results are consistent with previous results indicating CEOs with an MBA or MS degree generally perform better in CSR. On the other hand, the CEO’s gender and tenure appear to have weaker associations.
Discussion and Conclusion
We set out to analyze the connection between CSR performance offirms and CEO demographic composition. We successfully collected data based on the major CSR rating agencies, consisting of 392 observations as the sample base. In light of our empiricalfindings, we can discuss several pertinent observations. A firm’s CSR performance is associated with its CEO’s educational specialization in two categories: MBA and MS degrees. However, other educational specializations of CEOs – BS, BA, MA, PhD degrees, along with no degree beyond a high school diploma– do not appear to be significantly associated with the firm’s CSR performance. Furthermore, CEO gender and tenure also influence a firm’s CSR performance. CEO nationality and age, on the other hand, do not appear to be associated with CSR performance.
This study attempts to examine managerial variables affecting firm CSR performance. Waldman et al. (2006a, 2006b) suggested that the upper echelons perspective should be included to further our understanding of the role of leadership in CSR as a strategic choice. If CSR is treated as a strategic choice, our evidence supports our assertion that the demographic attributes of CEOs appear to influence firms’ CSR performance. Furthermore, stakeholder theory suggests that managerial values and belief systems help to shape the way managers attend to various
Type Changes in R² against Model A
MBA 0.0287
MS 0.0202
Gender 0.0133
Tenure 0.009
Table 3. Relative R2differences against Model A
Type Changes in R² against Model A&B Type Changes in R² against Model B
MBA MS 0.096 MBA MS 0.0532
MBA Gender 0.0891 MBA Tenure 0.0407
MBA Tenure 0.0848 MBA Gender 0.0388
Tenure Gender 0.0806 Tenure Gender 0.0297
MS Tenure 0.0763 MS Tenure 0.0296
Gender Tenure 0.0694 Gender Tenure 0.0245
stakeholder demands. A manager’s upbringing and past experiences influence his or her value system. Our study supports stakeholder theory by accounting for the influence of managerial background in the firm’s CSR initiative. However, we alsofind firm size, in terms of number of employee, exerts a significant influence over the firm’s CSR performance. One possible explanation could be the fact that larger corporations have better visibility from the perspective of rating agencies. Large corporations, such as Wal-Mart and Starbucks, sometimes play a leading role in CSR implementation, especially with the increasing emphasis on supply chain efficiency. Small and medium size firms such as Wal-Mart’s suppliers have to comply with a large corporation’s CSR policy. As a result, the CEO’s support of CSR initiatives in the large corporation becomes crucial in the overall implementation of CSR throughout the supply chain.
Although this study did not examine the linkage between universities’ CSR efforts and the impact on CEO influence over CSR, it is interesting to note that CEO educational specialization in MBA or MS degrees is associated withfirm CSR performance. CSR education has been introduced in many universities around the world to promote social development and raise students’ awareness of the issues. Although there is no guarantee that university education can changed a student’s behavior, studies show that environmental education does increase students’ sen-sitivity to environmental issues (Thomas, 2005). The board of directors of the Accreditation Board for Engineering and Technology (ABET) approved new accreditation criteria, Engineering Criteria 2000 (EC2000), in 1998. One of the major criteria requires accredited institutions to demonstrate that their students have ‘an understanding of professional and ethical responsibility’. Curriculum is required to integrate knowledge of contemporary issues in a global societal context under the EC2000 (Newberry, 2004). The Association to Advance Collegiate Schools of Business (AACSB) also requires business schools to incorporate ethics in their curricula. Studies have found that most business schools around the globe have started to integrate CSR in their curriculum design (Matten and Moon, 2004; Wu et al., 2010). Perhaps, our results indicate that universities’ CSR promotion might have an impact on their student bodies since there is a correlation between CEOs possessing an MBA or MS degree andfirms demonstrating consistent CSR performance. Thus universities may prove to be an important and constructive link between business and society.
The author has made a concerted effort to reduce problems resulting from bias in this research; however, there are still some potential limitations. First, the ranking results consist of mostly American and some European companies. The results lack significant representation from other parts of the world, for example Asia and South America. As a result, it is prudent to treat the purported connection between CEOs’ nationality and CSR perfor-mance with caution. Second, time lag presents a limitation. There might be a lag of an indeterminate length of time between the change in CEO and the effect on a company’s CSR performance. Furthermore, ranking agencies might not be responsive enough to take full account of these changes. Third, it is imperative to acknowledge not only the regional but also the cultural differences in terms of the CEO’s role in the company. For instance, in many European countries the Board of Directors might have greater influence over a company’s CSR performance than its CEO does. Finally, other CEO demographic factors not accounted for in this research, such as marital status (Roussanov and Savor, 2012), might also affect a company’s CSR performance. The exploration into such unexamined CEO demographic variables might prove fruitful as a future research topic.
Acknowledgements
The author wishes to thank the National Science Council’s funding support (NSC 100-2410-H-009-047).
References
Agle B, Mitchell R, Sonnenfeld J. 1999. Who matters to CEOs? An investigation of stakeholder attributes and salience, corporate performance, and CEO values. Academy of Management Journal 42: 507–525.
Aguilera R, Rupp D, Williams C, Ganapathi J. 2007. Putting the S back in corporate social responsibility: A multilevel theory of social change in organizations. Academy of Management Review 32: 836–863.
Anderson D. 2003. The integration of gender and political behavior into Hambrick and Mason’s upper echelons model of organizations. Journal of American Academy of Business 3: 29–36.
Angus-Leppan T, Metcalf L, Benn S. 2010. Leadership styles and CSR practice: An examiniation of sensemaking, institutional drivers and CSR leadership. Journal of Business Ethics 93: 189–213.
Bantel K, Jackson S. 1989. Top management and innovations in baking: Does the composition of the top management team make a difference? Strategic Management Journal 10: 107–124.
Basu K, Palazzo G. 2008. Corporate social responsibility: A process model of sensemaking. Academy of Management Review 33: 122–136. Battisti M, Perry M. 2011. Walking the talk? Environmental responsibility from the perspective of small-business owners. Corporate Social
Responsibility and Environmental Management 18: 172–185.
Bhattacharya C, Sen S. 2004. Doing better at doing good: When, why, and how consumers respond to corporate social initiatives. California Management Review 47: 9–24.
Blomgren A. 2011. Does corporate social responsibility influence profit margins? A case study of executive perceptions. Corporate Social Responsibility and Environmental Management 18: 263–274.
Callan S, Thomas J. 2011. Executive compensation, corporate social responsibility, and corporatefinancial performance: A multi-equation framework. Corporate Social Responsibility and Environmental Management 18: 322–351.
Campbell J. 2007. Why would corporations behave in socially responsible ways? An institutional theory of corporate social responsibility. Academy of Management Review 32: 946–967.
Cannella Jr. A, Park J, Lee H. 2008. Top management team functional background diversity andfirm performance: examining the roles of team member colocation and environmental uncertainty. Academy of Management Journal 51: 768–784.
Cassells S, Lewis K. 2011. SMEs and environmental responsibility: do actions reflect attitudes? Corporate Social Responsibility and Environmental Management 18: 186–199.
Dillenburg S, Green T, Erekson H. 2003. Approaching socially responsible investment with comprehensive rating scheme: Total social impact. Journal of Business Ethics 43: 167–177.
Ditlev-Simonsen C, Midttun A. 2011. What motivates managers to pursue corporate responsibility? A survey among key stakeholders. Corporate Social Responsibility and Environmental Management 18: 25–38.
Donaldson T, Preston L. 1995. The stakeholder theory of the corporation: Concepts, evidence, and implications. Academy of Management Review 20: 65–91.
Friedman M. 1970. The social responsibility of business is to increase its profits. New York Times Magazine September 13: 32–33. Garriga E, Mele D. 2004. Corporate social responsibility theories: Mapping the territory. Journal of Business Ethics 53: 51–71. Hambrick D. 2007. Upper Echelons theory: an update. Academy of Management Review 32: 334–343.
Hambrick D, Mason P. 1984. Upper echelons: the organization as a reflection of its top managers. Academy of Management Review 9: 193–206.
Keegan P. 2011. The trouble within green product rating. Fortune August 15: 32–36.
Lucena J, Schneider J. 2008. Engineers, development, and engineering education: From national to sustainable community development. European Journal of Engineering Education 33: 247–257.
MacKey A, MacKey T, Barney J. 2007. Corporate social responsibility andfirm performance: Investor preferences and corporate strategies. Academy of Management Review 32: 817–835.
Manner M. 2010. The impact of CEO characteristics on corporate social performance. Journal of Business Ethics 93: 53–72.
Margolis J, Walsh J. 2003. Misery loves companies: rethinking social initiatives by business. Administrative Science Quarterly 48: 268–305. Matten D, Moon J. 2004. Corporate social responsibility education in Europe. Journal of Business Ethics 54: 323–337.
Matten D, Moon J. 2008. Implicit and explicit CSR: A conceptual framework for a comparative understanding of corporate social responsibility. Academy of Management Review 33: 404–424.
McWilliams A, Siegel D. 2000. Corporate social responsibility andfinancial performance: Correlation or misspecification? Strategic Management Journal 21: 603–609.
McWilliams A, Siegel D. 2001. Corporate social responsibility: A theory of thefirm perspective. Academy of Management Review 26: 117–127. McWilliams A, Siegel D. 2010. Creating and capturing value: Strategic corporate social responsibility, resource-based theory, and sustainable
competitive advantage. Journal of Management 1–15. DOI: 10.1177/0149206310385659
McWilliams A, Siegel D, Wright P. 2006. Corporate social responsibility: Strategic implications. Journal of Management Studies 43: 1–18. Navarro P. 2008. The MBA core curricula of top-ranked U.S. business schools: A study in failure? Academy of Management Learning & Education 7:
108–123.
Newberry B. 2004. The dilemma of ethics in engineering education. Science and Engineering Ethics 10: 343–351.
Porter M, Kramer M. 2006. Strategy & society: The link between competitive advantage and corporate social responsibility. Harvard Business Review 84: 78–92.
Porter M, Kramer M. 2011. Creating shared value: How to reinvent capitalism - and unleash a wave of innovation and growth. Harvard Business Review 89: 62–77.
Roussanov N, Savor P. 2012. Status, marriage, and manager’s attitudes to risk. NBER Working Paper, March 2012. Scalet S, Kelly T. 2010. CSR rating agencies: what is their global impact? Journal of Business Ethics 94: 69–88. Smith C. 2003. Corporate social responsibility: whether or how? California Management Review 45: 52–76.
Thomas T. 2005. Are business students buying it? A theoretical framework for measuring attitudes toward the legitimacy of environmental sustainability. Business Strategy and the Environment 14: 186–197.
Waldman D, Siegel D. 2008. Defining the socially responsible leader. The Leadership Quarterly 19: 117–131.
Waldman D, Siegel D, Javidan M. 2006a. Components of CEO transformational leadership and corporate social responsibility. Journal of Management Studies 43: 1703–1725.
Waldman D, de Luque M, Washburn N, House R, Adetoun B, Barrasa A, Wilderom C. 2006b. Cultural and leadership predictors of corporate social responsibility vales of top management: A globe study of 15 countries. Journal of International Business Studies 37: 823–837. Wiersema M, Bantel K. 1992. Top management team demography and corporate strategic change. Academy of Management Journal 35: 91–121. Wood D. 2010. Measuring corporate social performance: A review. International Journal of Management Review 50–84. DOI:
10.1111/j.1468-2370.2009.00274.x
Woodruff P. 2006. Educating engineers to create a sustainable future. Journal of Environmental Engineering 132: 434–444.
Wu Y, Huang S, Kuo L, Wu W. 2010. Management education for sustainability: A web-based content analysis. Academy of Management Learning & Education 9: 520–531.