國立交通大學
生物資訊研究所
碩 士 論 文
以高斯演化方式預測蛋白質-蛋白質嵌合位置
A Gaussian evolutionary method for predicting
protein-protein interaction sites
研 究 生:劉康平
指導教授:楊進木 教授
國立交通大學
生物資訊研究所
碩 士 論 文
以高斯演化方式預測蛋白質-蛋白質嵌合位置
A Gaussian evolutionary method for predicting
protein-protein interaction sites
研 究 生:劉康平
指導教授:楊進木 教授
以高斯演化方式預測蛋白質-蛋白質嵌合位置
A Gaussian evolutionary method for predicting
protein-protein interaction sites
研 究 生:劉康平 Student:Kang-Ping Liu 指導教授:楊進木 教授 Advisor:Dr. Jinn-Moon Yang
國 立 交 通 大 學 生 物 資 訊 研 究 所
碩 士 論 文
A Thesis Submitted to Institute of Bioinformatics
National Chiao Tung University in Partial Fulfillment of the Requirements for the Degree for Master in Bioinformatics
June 2009
Hsinchu, Taiwan, Republic of China
I
以高斯演化方式預測蛋白質-蛋白質嵌合位置
學生: 劉康平 指導教授: 楊進木 國立交通大學生物資訊研究所碩士班摘要
研究蛋白質-蛋白質之間的交互作用在分子生物的領域中扮演非常重要的 任務,一個可行的策略是先辨認及研究蛋白質-蛋白質交互作用的區域,再根據 交互作用區域的特性進行分析,並且了解蛋白質的功能。在這篇論文研究中,我 們發展了一個適用於預測蛋白質-蛋白質交互作用區域的函式,結合了原子的疏 水性以及蛋白質的二級結構的特性,利用高斯演算法進行最佳化後,在測試評量 中有不錯的表現。我們使用了104個蛋白質結構進行最佳化函式的訓練,在訓練 的 資 料 中 我 們 成 功 的 預 測 超 過 半 數 以 上 的 蛋 白 質 - 蛋 白 質 交 互 作 用 區 域 (65.4%)。此外,我們將訓練之後的最佳化函式測試在50個沒有出現在訓練資料 內的蛋白質結構中,我們的函式可以成功的預測其中的46%蛋白質-蛋白質交互 作用區域,我們相信在函式中使用的參數對於分析蛋白質-蛋白質之間的交互作 用是有幫助的,並且可以應用到不同的方法上來預測蛋白質-蛋白質交互作用區 域。此外,我們修改著名的蛋白質-配體嵌合工具”GEMDOCK”成為蛋白質-蛋白 質嵌合工具,並且使用內建的蛋白質-配體計分程式來計算蛋白質-蛋白質嵌合的 結果。我們測試了50個蛋白質結構,並且發現修改後的”GEMDOCK”在搜尋蛋白 質-蛋白質嵌合之空間結構仍然保有相當的水準,可是在計算最佳嵌合結構時, 原始的蛋白質-配體計分程式對於辨認蛋白質-蛋白質交互作用的情況仍然不 足。未來,我們將會整合蛋白質-蛋白質交互作用區塊之預測到”GEMDOCK”中, 並且改進蛋白質-配體計分程式成為蛋白質-蛋白質計分程式,以及發展可以改變 蛋白質構形的策略,用以解決”unbound”蛋白質-蛋白質嵌合問題。A Gaussian evolutionary method for predicting protein-protein
interaction sites
Student: Kang-Ping Liu Advisor: Dr. Jinn-Moon Yang
Institute of Bioinformatics National Chiao Tung University
Abstract
Protein-protein interactions play a pivotal role in modern molecular biology. Therefore, identifying the interface between two interacting proteins is a matter of great scientific and practical interest. In this study, we proposed a Gaussian Evolutionary Method (GEM) to optimal atomic and 2nd structure parameters for predicting protein-protein interaction sites. The training set of GEM consist 104 unbound proteins from PDB, and we are able to predict the location of the interface on 65.4%. In addition, we apply trained GEM to testing set of 50 unbound proteins. Our method can predict 98% proteins among whole testing set and have 46% successfully prediction and 42.3% average specificity. A prediction is assumed successful if over half of the predicted continuous interface patch is indeed interface (specificity). The parameters of GEM may be useful for analysis of protein-protein interfaces, and can apply to different methods for interfaces prediction. Furthermore, we have modified famous protein-ligand docking tool “GEMDOCK” for protein-protein docking using original scoring functions. We tested 50 bound protein-protein docking and found that search strategies of GEMDOCK works well in rigid-body protein-protein docking, however, the scoring functions of protein-ligand docking seems poor to identify correct protein-protein binding conformations. In the future, we will combine protein-protein interaction sites prediction into GEMDOCK
III
and improve scoring function of GEMDOCK for protein-protein docking and develop soft-body protein-protein docking strategies for solving unbound-unbound protein docking problems.
Acknowledgements
The most appreciation is for my advisors, Dr. Jinn-Moon Yang. Because of his advices and instructions, I could finish this thesis. I am very grateful for Dr. Jinn-Moon Yang and thanks for his suggestions on optimizing parameters of GEMDOCK and properties of protein-protein interacting sites. He helped me to understand the problem of protein-protein interaction and how to solve mistakes. Without his suggestions and comments on writing thesis, I can’t accomplish this work. Thanks my advisors very much.
I also must thank to everyone in Yang’s lab. We work together, and have funs together. Thanks for guys who discuss with me. Finally, I wound thank my whole family, for their support during past twenty-eight years.
V
CONTENTS
Abstract (in Chinese)………..……….I Abstract ………...………...………...………II Acknowledgements…..………IV List of Tables…………..………..VI List of Figures…………....………...……….VII
Chapter 1 Introduction…………..………...………1
1.1 Protein-protein interacting interface prediction………....1
1.2 Related Works………3
1.3 Evolutionary Algorithms………6
Chapter 2 Materials and Methods………8
2.1 Flowchart of our method………8
2.2 Training data set………10
2.3 Atomic and structure parameters for protein interface prediction……12
2.4 Definition of surface and interface………13
2.5 Definition of different-sized surface patch………14
2.6 Definition of specificity, sensitivity and success………15
2.7 Scoring function of surface residue………16
2.8 Training procedure of GEM………17
Chapter 3 Results……….……….…19
3.1 Training results………19
3.2 Testing results………20
3.3 Rigid-body protein-protein docking using GEMDOCK………21
Chapter 4 Discussions………..………24
Chapter 5 Conclussion…….…...…..………...………27
List of Tables
Table 1. List of training data set……….……….…10 Table 2. Atomic parameters used for protein-protein interaction sites prediction…...12 Table 3. Gaussian Evolutionary Method parameters….……….…….…18 Table 4. Summary of training results from 104 unbound proteins………….…….…19 Table 5. Prediction specificities of 50 unbound proteins……….…20 Table 6. Results of protein-protein docking using GEMDOCK……….…22
VII
List of Figures
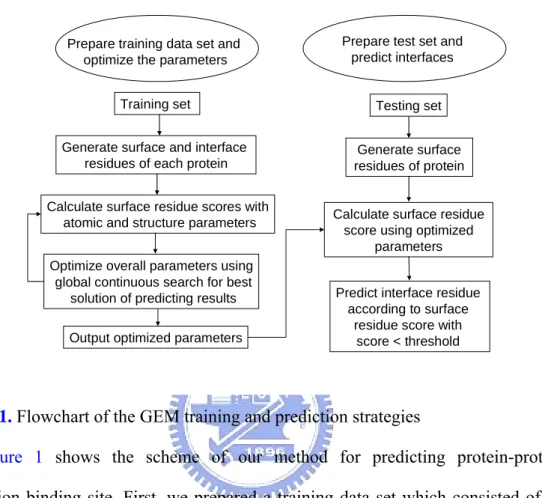
Figure 1. Flowchart of the GEM training and prediction strategies……….…8
Figure 2. Flowchart of identifying different-sized surface patch……….…...14
Figure 3. Good test cases for GEMDOCK………..……….…...21
Figure 4. Prediction results of training set and testing set.………..……….…...24
1 Introduction
1.1 Protein-protein interacting interface prediction
Protein-protein interactions play a pivotal role in modern molecular biology. Study of the energetics and mechanism of protein-protein association is a matter of great scientific and practical interest. In the recent years, large-scale experiments on whole genomes [1-5] have identified many interacting protein pairs. However, the residues involved in these interactions are generally not known and the vast majority of the interactions remain to be characterized structurally. The prediction of the specific amino acid residues that play essential roles in protein-protein interactions is an important step towards deciphering the functional mechanism of proteins. Identifying the interface between two interacting proteins is an essential intermediate step for a wide range of applications such as the design of mutants for experimental verification of the interactions, the development of drugs that target protein-protein interactions, understanding the mechanism of the molecular recognition and as an aid to predicting complexes through docking and homology modeling.
It is widely accepted that protein structural knowledge on a residue and atom level share common properties that can be used to distinguish a protein-protein interacting interface from the rest of a protein [6-9]. The hydrophobic interaction is one of the major contributors to the affinity of the association [10, 11]. Fernandez-Recio et al. [12, 13] successfully extract the desolvation properties of protein surface to construct atomic solvation parameters for predicting protein-protein interaction sites. However, no single attribute absolutely identifies interface from the rest of a protein [8] , and parameters from different analysis cause different prediction results. Therefore, combination of more physical–chemical properties [7, 14-17] and using computational methods to assist the finding of best parameters are needed for predicting protein-protein interaction sites.
2
The aim of this work is to combine secondary structure information with atomic solvation parameters and optimize these parameters using GEM [18-23] method for developing an interface prediction program. The GEM was used to optimize the 18 parameters, which composed of 10 of the atom properties derived form Fernandez-Recio et al. [12, 13] and 8 of the secondary structure properties from DSSP [24]. Based on these visualized optimizing parameters, we are able to predict and analyze interface residues of proteins not included in the training set, without any prior knowledge of the binding partner.
1.2 Related Works
Many groups have attempted to discern the distinguishing features of protein-protein interaction interfaces and these features can be divided into two groups, those that require knowledge of the structures of the interacting proteins (for example surface area, B-factors) and those that require no structure input (for example multiple sequence alignment information, amino acid hydrophobicity). Because sequence and structural features have been much studied in predicting protein-protein interaction surfaces, no single feature has been inextricably linked to protein-protein interfaces.
The sequence-based features in predicting protein-protein interaction surfaces have several methods, such as a) residue composition and propensity, b) hydrophobicity, c) features derived from MSAs. For example, Jones and Thornton [7] first used residue interface propensities as a feature, the ratios of amino acids contributing to the interface compared to amino acid composition of the whole protein surface. They showed that the mean frequency of tryptophan was higher than that of alanine. Dong Q et al. [25] used Z-scores rather than residue frequencies and interface propensities have been calculated at the profile level
The hydrophobic effect is often a major contributor to binding affinity and has been noted that many interfaces have a hydrophobic core surrounded by a ring of polar residues [26, 27]. Gallet X et al. [28] showed that the interface residues can be predicted to some extent by using the hydrophobic moment and averaged hydrophobicity. However, other studies have shown that hydrophobic features do not appear to be useful for general interface prediction [29] and the magnitude of the hydrophobic effect is insufficient to identify interfaces [7, 30, 31].
Residue conservation at the interface is observed to be slightly higher than those of general surface residues. Various methods have been used PSI-BLAST to capture
4
characteristics indicative of interaction sites and calculate conservation from multiple-sequence alignments [32, 33]. However, residue conservation is not significantly different from those in the protein interior [34-36], since many conserved residues are buried and contribute to protein folding and stability. The conservation is really only discriminatory when surface residues are compared and Guharoy and Chakrabarti [37] found that the interface core tends to be more conserved than the periphery in protein complexes.
The structure-based features in predicting protein-protein interaction surfaces have several methods, such as a) solvent accessible surface area, b) B Factors, c) electrostatic potential, d) sensitive sub-family specific methods. Many studies used the solvent accessibilities of individual residues or those averaged over a surface patch to predict protein-protein interaction sites. For example, Jones et al. [7, 8] found that surface patches of complex residues in the unbound interface have a higher solvent accessible surface area than other surface patches. Porollo and Meller [38] predicted RSA and the observed RSA in detached monomers (dSA) and found that predicted RSA tended to be more consistent with the level of surface exposure in protein complexes than the unbound structures of individual protein chains.
The feature of B Factors has been used to improve predictor performance, since interface surfaces are less flexible than the rest of the protein surface [39]. For example, Chung et al. [40] weighted conservation scores by a normalized B-factor, in this way, the conservation scores of the residues in the flexible regions are reduced and the conservation scores of the residues in the rigid regions are increased.
The simple electrostatics could drive the formation of many complexes, and has been the presence of a significant population of charged and polar residues on protein-protein interfaces [31, 41-44]. Chung et al. [40] and Bradford et al. [45] have successfully used electrostatic potentials to improve predicting performance.
The sensitive sub-family specific methods have been developed to uncover functionally important residues in proteins with known structure using information from the differential conservation at the sub-family level [46-48]. Ofran et al. [49] and Pazos et al. [50] have used Evolutionary Trace to locate protein–protein binding sites successfully. Wang et al. [51] also showed that combination of sequence profiles methods and evolutionary trace methods seemed to improve predicting performance.
6
1.3 Evolutionary Algorithms
An evolutionary algorithm is based on ideas genetics and natural selection to solve problems, especially difficult optimization problems. The first step is coded to a chromosome, which is represented as solution and initialed randomly. The second step is that find out batter solution in searching space by mutations and crossovers. The final step is to find a reliable solution by repeating mutation, crossover, and selection again and again. Selection is most important function which is decided to pick up the batter solution in an evolutionary algorithm.
In general the coding function of genetic algorithms has two main developed but strongly related implementations. First coding function is binary-represented which may introduce an additional multimodality, making the combined objective function more complex than the original function. To achieve better performance, second coding function is real-coded genetic algorithms. However, they generally employ random-based mutations and hence, still require lengthy local searches near local minimums. In contrast, evolution strategies and evolutionary programming [52], mainly use real-valued representation and focus on self-adaptive Gaussian mutations. This type of mutation has succeeded in continuous optimization and has been widely regarded as a good operator for local searches. Unfortunately, experiments show that self-adaptive Gaussian mutation leaves individuals trapped near local minimums for rugged functions.
GEM is proposed to improve the above approaches and has a good performance for many problems. GEM is a multi-operator approach that combines three mutation operators: decreasing-based Gaussian mutation, self-adaptive Gaussian mutation, and self-adaptive Cauchy mutation. It incorporates family competition and adaptive rules for controlling step sizes to construct the relationship among these three operators. To balance the search power of exploration and exploitation, each of operators is
designed to compensate for the disadvantages of the other. The details of GEM were described as previous works [21, 23], and had been successfully applied for some specific problems, such as protein-ligand docking, drug screening, and protein side-chain prediction [18-20, 22, 23]. In this study, we use the GEM to find out the most suitable weight of each parameter for protein-protein interacting interface prediction.
8
2 Materials and Methods
2.1 Flowchart of our methodPrepare training data set and optimize the parameters
Prepare test set and predict interfaces
Training set
Generate surface and interface residues of each protein
Calculate surface residue scores with atomic and structure parameters
Optimize overall parameters using global continuous search for best
solution of predicting results Output optimized parameters
Testing set
Generate surface residues of protein
Calculate surface residue score using optimized
parameters
Predict interface residue according to surface
residue score with score < threshold
Figure 1. Flowchart of the GEM training and prediction strategies
Figure 1 shows the scheme of our method for predicting protein-protein interaction binding site. First, we prepared a training data set which consisted of 52 complexes (104 chains) from a widely used benchmark [53]. For each chain in this data set, the protein surface and interacting interface are generated. Based on these data, we calculated all surface residues scores and trained the GEM parameters to distinguish interacting residues from non-interacting residues by ranking scores of surface residues. The surface residue with the score lower than a given threshold was predicted as an interface residue. To each predicted area, we apply specificity and sensitivity [45] to measure performance of our method. Specificity was defined as number of interface residues in predicted area/number of predicted area residues. Sensitivity was defined as number of interface residues in predicted area/number of interface residues. A prediction was deemed a success if predicted area with over 50%
specificity [16]. The results were than used to calculate accuracy of success, and GEM tuned atomic and structure parameters of scoring function using global continuous search to find best solution of average specificity and success rate from 104 training proteins. Second, in order to prediction, for each protein, we generated surface residues and these residues could then be calculated their scores using the optimized parameters from above. Residues predicted to be part of the interface were according to the scores lower than a given threshold.
10
2.2 Training data set
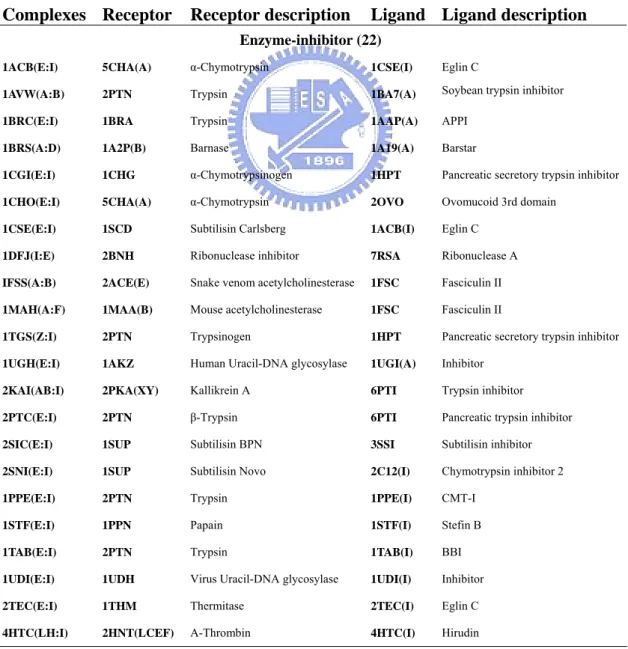
Here we used 104 unbound protein chains according to 52 protein complexes selected from the protein-protein docking benchmark [53] which was a non-redundant benchmark for testing protein-protein docking algorithms. We discarded 7 complexes, which have large structure conformation change between unbound and bound structures, from the original benchmark. Our data set consisted of 22 (44 chains) enzyme-inhibitor complexes, 19 (38 chains) antibody-antigen complexes, and 11 complexes (22 chains) others. Table 1 list the training set using in this study.
Table 1. List of training data set
Complexes Receptor Receptor description Ligand Ligand description
Enzyme-inhibitor (22)
1ACB(E:I) 5CHA(A) α-Chymotrypsin 1CSE(I) Eglin C
1AVW(A:B) 2PTN Trypsin 1BA7(A) Soybean trypsin inhibitor
1BRC(E:I) 1BRA Trypsin 1AAP(A) APPI
1BRS(A:D) 1A2P(B) Barnase 1A19(A) Barstar
1CGI(E:I) 1CHG α-Chymotrypsinogen 1HPT Pancreatic secretory trypsin inhibitor
1CHO(E:I) 5CHA(A) α-Chymotrypsin 2OVO Ovomucoid 3rd domain
1CSE(E:I) 1SCD Subtilisin Carlsberg 1ACB(I) Eglin C
1DFJ(I:E) 2BNH Ribonuclease inhibitor 7RSA Ribonuclease A
IFSS(A:B) 2ACE(E) Snake venom acetylcholinesterase 1FSC Fasciculin II 1MAH(A:F) 1MAA(B) Mouse acetylcholinesterase 1FSC Fasciculin II
1TGS(Z:I) 2PTN Trypsinogen 1HPT Pancreatic secretory trypsin inhibitor
1UGH(E:I) 1AKZ Human Uracil-DNA glycosylase 1UGI(A) Inhibitor
2KAI(AB:I) 2PKA(XY) Kallikrein A 6PTI Trypsin inhibitor
2PTC(E:I) 2PTN β-Trypsin 6PTI Pancreatic trypsin inhibitor
2SIC(E:I) 1SUP Subtilisin BPN 3SSI Subtilisin inhibitor
2SNI(E:I) 1SUP Subtilisin Novo 2C12(I) Chymotrypsin inhibitor 2
1PPE(E:I) 2PTN Trypsin 1PPE(I) CMT-I
1STF(E:I) 1PPN Papain 1STF(I) Stefin B
1TAB(E:I) 2PTN Trypsin 1TAB(I) BBI
1UDI(E:I) 1UDH Virus Uracil-DNA glycosylase 1UDI(I) Inhibitor
2TEC(E:I) 1THM Thermitase 2TEC(I) Eglin C
Antibody-antigen (19)
1AHW(DE:F) 1FGN(LH) Antibody Fab 5G9 1BOY Tissue factor
1BVK(DE:F) 1BVL(LH) Antibody Hulysll Fv 3LZT Lysozyme
1DQJ(AB:C) 1DQQ(LH) Hyhel–63 Fab 3LZT Lysozyme
1MLC(AB:E) 1MLB(AB) IgG1 D44.1 Fab fragment 1LZA Lysozyme
1WEJ(LH:F) 1QBL(LH) IgG1 E8 Fab fragment 1HRC Cytochrome C
1BQL(LH:Y) 1BQL(LH) Hyhel-5 Fab 1DKJ Lysozyme
1EO8(LH:A) 1EO8(LH) Bh151 Fab 2VIU(A) Influenza virus hemagglutinin
1FBI(LH:X) 1FBI(LH) IgG1 Fab fragment 1HHL Lysozyme
1IAI(MI:LH) 1AIF(LH) IgG1 Idiotypic Fab 1IAI(LH) Igg2A anti-idiotypic Fab
1JHL(LH:A) 1JHL(LH) IgG1 Fv fragment 1GHL(A) Lysozyme
1KXQ(D:E) 1PIF(A) α-Amylase 1KXQ(E) Camelid AMD9 Vhh domain
1KXT(A:B) 1PIF(A) α-Amylase 1KXT(B) Camelid AMB7 Vhh domain
1KXV(A:C) 1PIF(A) α-Amylase 1KXV(C) Camelid AMD10 Vhh domain
1MEL(B:M) 1MEL(B) Vh single-domain antibody 1LZA Lysozyme
1NCA(LH:N) 1NCA(LH) Fab NC41 7NN9 Influenza virus neuraminidase
1NMB(LH:N) 1NMB(LH) Fab NC10 7NN9 Influenza virus neuraminidase
1QFU(LH:A) 1QFU(LH) Igg1-k Fab 2VIU(A) Influenza virus hemagglutinin
2JEL(LH:P) 2JEL(LH) Jel42 Fab fragment 1POH A06 phosphotransferase
2VIR(AB:C) 2VIR(AB) Igg1-lamda Fab 2VIU(A) Influenza virus hemagglutinin Others (11)
1AVZ(B:C) 1AVV HIV-1 NEF 1SHF(A) FYN tyrosin kinase SH3 domain
1L0Y(A:B) 1BEC T-cell receptor βchain 1B1Z(A) Exotoxin A1
1WQ1(G:R) 1WER RAS activating domain 5P21 RAS
2MTA(LH:A) 2BBK(LH) Methylamine dehydrogenase 1AAN Amicyanin
2PCC(A:B) 1CCA Cytochrome C peroxidase 1YCC Iso-1-Cytochrome C
1A0O(A:B) 1CHN Che A 1A0O(B) Che Y
1ATN(A:D) 1ATN(A) Actin 3DNI Deoxyribonuclease I
1GLA(G:F) 1GLA(G) Glycerol kinase 1F3G GSF III
1IGC(LH:A) 1IGC(LH) IgG1 Fab fragment 1IGD ProteinG
1SPB(S:P) 1SUP Subtilisin 1SPB(P) Subtilisin prosegment
12
2.3 Atomic and structure parameters for protein interface prediction
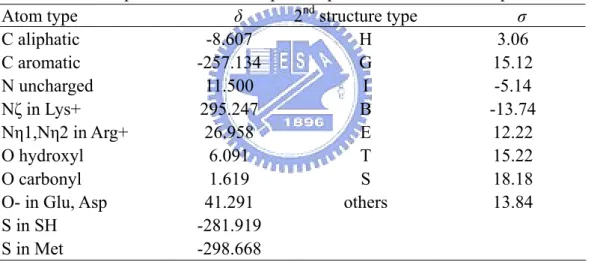
In order to describe interface behavior clearly, we used atomic and structure parameters which combined attributes of hydrophobic properties and structure properties to achieve this purpose. The atomic parameters consisted of 10 hydrophobic parameters δ based on octanol/water transfer energies optimized for protein-protein binding [12, 13] and the structure parameters consisted of 8 secondary structure parametersσ based on DSSP [24] as described in Table 2. Training set of 104 high-resolution crystal structures was then used to train the overall parameters by GEM.
Table 2. Atomic parameters used for protein-protein interaction sites prediction
Atom type δ 2nd structure type σ
C aliphatic -8.607 H 3.06 C aromatic -257.134 G 15.12 N uncharged 11.500 I -5.14 Nζ in Lys+ 295.247 B -13.74 Nη1,Nη2 in Arg+ 26.958 E 12.22 O hydroxyl 6.091 T 15.22 O carbonyl 1.619 S 18.18
O- in Glu, Asp 41.291 others 13.84
S in SH -281.919
2.4 Definition of surface and interface
Surface and interface residues for the proteins were identified based on information in the PDB coordinate files. Briefly, solvent accessible surface areas (ASA) for each residue are calculated using DSSP [24]. A residue is defined to be a surface residue if its ASA is at least 25% of its nominal maximum area [54] as defined by Rost and Sander [55] . The distance-based definition of interface used here was that a surface residue is defined as an interface residue if its side-chain center is within 4.5Å of the side-chain center of a residue belonging to another chain in the complex. There is no indication that this criterion is better or worse than others [56]. Ofran et al. [49], for example, used a cut-off distance that if any of residue atoms < 6Å from any atom of the other protein. Sternberg and coworkers [57] set a cut-off distance of 8 Å between the Cα atoms.
14
2.5 Definition of different-sized surface patch
E i = +5.1 E i= -8.9 E i= -10.2 0 20 10 -10 -20 E i 0 5 10 15 20 d (Å) ODA Value -10.2 Surface residues i = 1,2…N i = 1 d d d (A) (B) (C)
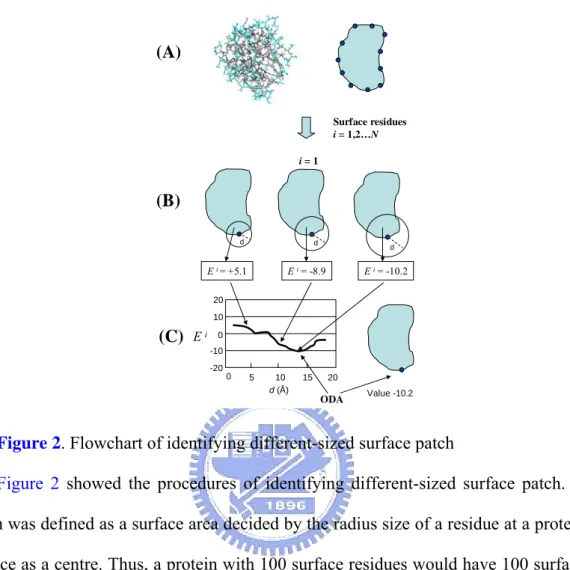
Figure 2. Flowchart of identifying different-sized surface patch
Figure 2 showed the procedures of identifying different-sized surface patch. A patch was defined as a surface area decided by the radius size of a residue at a protein surface as a centre. Thus, a protein with 100 surface residues would have 100 surface patches. To ensure that we did not measure through the protein, the following procedure was followed. (A) A Cβ of every surface residue on the protein (a Cα for
glycine) was used to calculate distances between all surface residues. The patch was grown from the single starting (seed) residue and subsequently used to generate series of surface patch. However, equal-area patches may poorly represent the real protein interaction sites that vary significantly in size. Therefore, (B) different-sized surface patches were generated by selecting all surface residues at different distances (d = 1, 2, …, 20Å) from a given seed [13]. (C) The final patch size of the seed was according to the lowest score of a surface patch. Scores of different-sized surface patches were calculated based on the atomic ASA of their component residues and secondary
structure (section 2.7). This process was iterated using the newly acquired residues, until the total number of residues in the patch was equal to the total number of residues in the surface.
2.6 Definition of specificity, sensitivity and success
To each predicted area, we apply specificity and sensitivity [45] to measure performance of our method. In this study, specificity was defined as number of interface residues in predicted area/number of predicted area residues. Sensitivity was defined as number of interface residues in predicted area/number of interface residues. A prediction was deemed a success if predicted area with over 50% specificity [16].
16
2.7 Scoring function of surface residue
The desolvation properties of a given surface residue were calculated using an atomic ASA-based model [58, 59], and we combined new attribute of secondary structure properties to consider interface structure information.
The surface residue score S of residue k is calculated as , ) (
∑
× + = m i i i i k ASA S δ σwhere m is total number residues of different-sized surface patch. δi is the atomic
parameter for atom type i. σi is the structure parameter for 2nd structure type i. ASAi is
solvent accessible surface area of atom i. The atomic parameters for the different atom types are shown in Table 2. The lowest score of different-sized surface patch is selected for the final score of residue k.
To assess how hydrophobic a surface residue is with respect to the whole protein, the Z score of its hydrophobic pocket is calculated as
, γ S S Z k k − =
where S is the average surface patch score of all of the residues in the protein surface, and γ is the standard deviation. Residues with Zk lower than a given
threshold (Zcut) are taken as the hydrophobic pockets and we find Zcut = -1.5 has better
2.8 Training procedure of GEM
GEM is a multi-operator approach that combines three mutation operators: decreasing-based Gaussian mutation, self-adaptive Gaussian mutation, and self-adaptive Cauchy mutation. It incorporates family competition and adaptive rules for controlling step sizes to construct the relationship among these three operators. To balance the search power of exploration and exploitation, each of operators is designed to compensate for the disadvantages of the other. The details of GEM were described as previous works [21, 23], and had been successfully applied for some specific problems, such as protein-ligand docking, drug screening, and protein side-chain prediction [18-20, 22, 23].
Here, we provide an outline of our GEM for predicting protein-protein interaction sites, which can be represented by adjustable variables of atomic and structure parameters (Table 2) as ), ,..., , , ,..., , (δ1 δ2 δ10 σ1 σ2 σ8
where δ is the atomic parameter and σ is the structure parameter of surface residue scoring function. The values of parameters are then used in the surface residue scoring function and predicting results are presented as specificity and success rate. In order to determine that the performance of adjustable parameters, we use a fitness function which combines specificity and success rate for GEM training. In this work, we use GEM to look for the most suitable atomic and structure parameters for identifying protein interfaces by minimizing a fitness function which is described as fellow
, ) 1 (
∑
− + = N p p p Fitness ψ ωwhere N is total number of training proteins. ψp is the specificity of predicting results
of the protein p based on the training values of atomic parameters. In order to raise success rate of prediction, we add information of success rate to our fitness function
18
(ωp). The value of ωp is depend on ψp. When ψp is over 0.5 or equal to 0, than ωp
would be set to -1 or 0.5, respectively. If ψp is lower than 0.5 and not equal to 0, then
ωp would be set to 0.
Generally, the method use global continuous-search mechanisms based on Gaussian mutations. And the steps involved are as follows:
1. Initialize the atomic and structure parameters of surface residue scoring function. The initial values for the parameters are selected from the feasible region (-300, 300). Repeat this N times to generate the initial population of N parameters for a surface residue scoring function. Evaluate the objective value of each parameters based on the fitness function.
2. Change the value of atomic and structure parameters by genetic operators to generate offspring. Evaluate the objective values of the offspring.
3. Use selection operators to select N solutions from the atomic and structure parameters of both parent and offspring solutions.
4. Repeat steps 2 and 3 until one of the terminating conditions is satisfied.
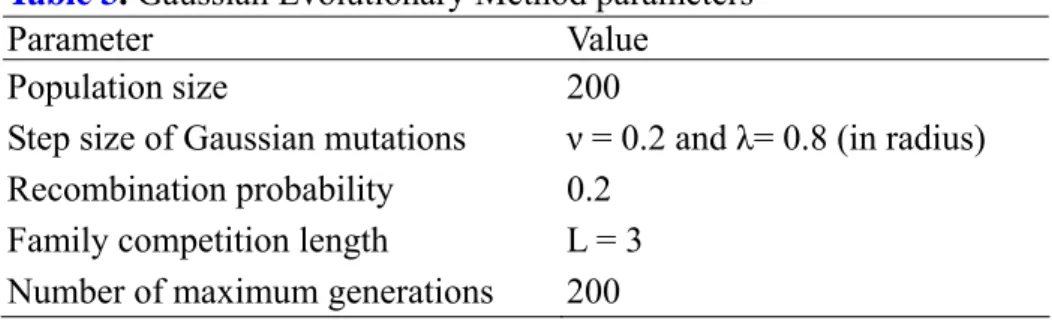
The GEM parameters used in this paper are listed in Table 3 such as population size, initial step sizes of Gaussian mutations, recombination probability, and family competition length in this work. The GEM optimization stops when either the convergence is below certain threshold value or the iterations exceed a maximal preset value which was set to 200. These parameters were selected after many attempts to predict interaction sites for test proteins with various initial values.
Table 3. Gaussian Evolutionary Method parameters
Parameter Value
Population size 200
Step size of Gaussian mutations ν = 0.2 and λ= 0.8 (in radius) Recombination probability 0.2
Family competition length L = 3 Number of maximum generations 200
3 Results
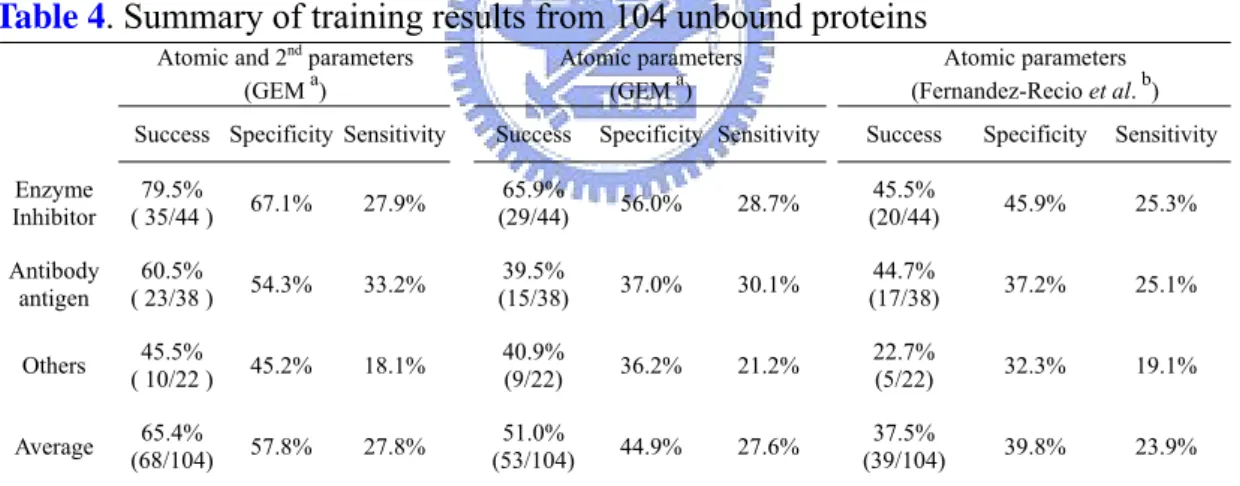
3.1 Training resultsThe results of the GEM method for the training set are summarized in Table 4. GEM is able to predict the location of the interface on 65.4% (68/104) proteins in the training dataset. The average specificity and sensitivity are 57.8% and 27.8%, respectively. If we only train atomic parameters by GEM and use optimized atomic parameters to predict training set, the success of prediction is decreasing to 51.0% and the average specificity and sensitivity are 44.9% and 27.6%, respectively. In addition, if we used atomic parameters based on Fernandez-Recio et al. [13] without any optimization, the performance of prediction is the worse. Combination of physical–chemical properties and using computational methods to assist the finding of best parameters are useful for predicting protein-protein interaction sites.
Table 4. Summary of training results from 104 unbound proteins
Atomic and 2nd parameters (GEM a)
Atomic parameters (GEM a)
Atomic parameters (Fernandez-Recio et al. b) Success Specificity Sensitivity Success Specificity Sensitivity Success Specificity Sensitivity Enzyme Inhibitor 79.5% ( 35/44 ) 67.1% 27.9% 65.9% (29/44) 56.0% 28.7% 45.5% (20/44) 45.9% 25.3% Antibody antigen 60.5% ( 23/38 ) 54.3% 33.2% 39.5% (15/38) 37.0% 30.1% 44.7% (17/38) 37.2% 25.1% Others ( 10/22 ) 45.5% 45.2% 18.1% 40.9% (9/22) 36.2% 21.2% 22.7% (5/22) 32.3% 19.1% Average (68/104) 65.4% 57.8% 27.8% (53/104)51.0% 44.9% 27.6% (39/104) 37.5% 39.8% 23.9%
a The parameters which are optimized by GEM
20
3.2 Testing results
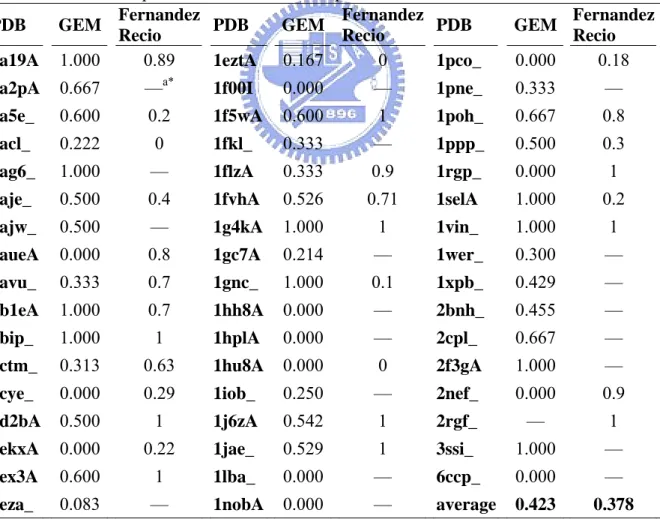
The overall accuracy of GEM in predicting the protein-protein interaction sites of 50 test proteins is shown in Table 5. In order to test our performance of predicting protein-protein interaction sites, we tested our parameters against a accompanying paper of Fernandez-Recio et al. [13] and found that our Atomic Parameters had performed at least as well as their Atomic Solvation Parameters. The results of this test are summarized in Table 5, in which it can be seen that our method can predict 98% proteins among whole testing set and have 42.3% average specificity, better than Fernandez-Recio’s results which can predict 60% protein among whole testing set and have 37.8% average specificity.
Table 5. Prediction specificities of 50 unbound proteins
PDB GEM Fernandez Recio PDB GEM Fernandez Recio PDB GEM Fernandez Recio 1a19A 1.000 0.89 1eztA 0.167 0 1pco_ 0.000 0.18 1a2pA 0.667 —a* 1f00I 0.000 — 1pne_ 0.333 — 1a5e_ 0.600 0.2 1f5wA 0.600 1 1poh_ 0.667 0.8 1acl_ 0.222 0 1fkl_ 0.333 — 1ppp_ 0.500 0.3 1ag6_ 1.000 — 1flzA 0.333 0.9 1rgp_ 0.000 1 1aje_ 0.500 0.4 1fvhA 0.526 0.71 1selA 1.000 0.2 1ajw_ 0.500 — 1g4kA 1.000 1 1vin_ 1.000 1 1aueA 0.000 0.8 1gc7A 0.214 — 1wer_ 0.300 — 1avu_ 0.333 0.7 1gnc_ 1.000 0.1 1xpb_ 0.429 — 1b1eA 1.000 0.7 1hh8A 0.000 — 2bnh_ 0.455 — 1bip_ 1.000 1 1hplA 0.000 — 2cpl_ 0.667 — 1ctm_ 0.313 0.63 1hu8A 0.000 0 2f3gA 1.000 — 1cye_ 0.000 0.29 1iob_ 0.250 — 2nef_ 0.000 0.9 1d2bA 0.500 1 1j6zA 0.542 1 2rgf_ — 1 1ekxA 0.000 0.22 1jae_ 0.529 1 3ssi_ 1.000 — 1ex3A 0.600 1 1lba_ 0.000 — 6ccp_ 0.000 — 1eza_ 0.083 — 1nobA 0.000 — average 0.423 0.378
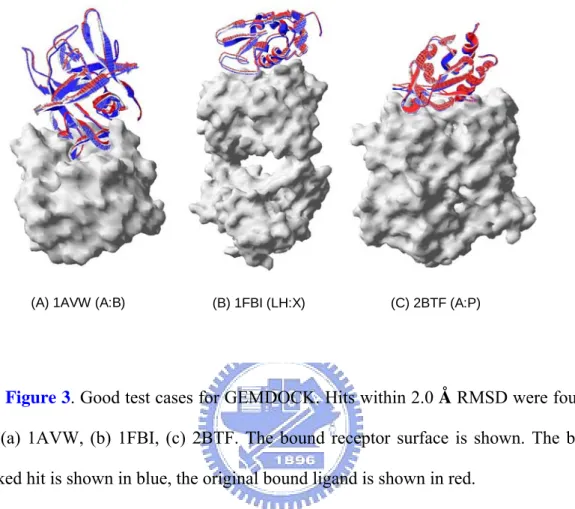
3.3 Rigid-body protein-protein docking using GEMDOCK
(A) 1AVW (A:B) (B) 1FBI (LH:X) (C) 2BTF (A:P)
Figure 3. Good test cases for GEMDOCK. Hits within 2.0 Å RMSD were found
for (a) 1AVW, (b) 1FBI, (c) 2BTF. The bound receptor surface is shown. The best ranked hit is shown in blue, the original bound ligand is shown in red.
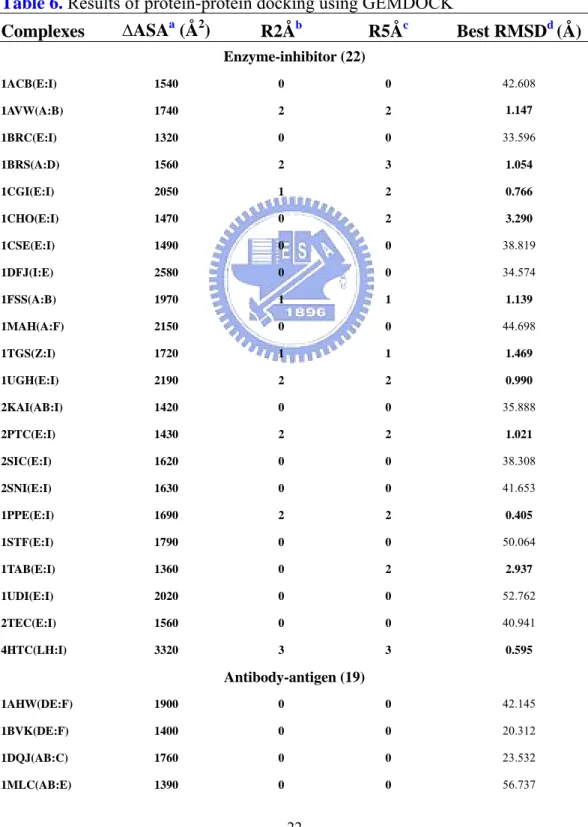
We have modified GEMDOCK for rigid-body protein-protein docking and using original empirical scoring function which works well in protein-ligand docking. The former combines both discrete and continuous global search strategies with local search strategies to speed up convergence, whereas the latter results in rapid recognition of possible protein-protein interacting conformations. We have tested on 52 bound protein complexes which are used in our training set and the results are listed on Table 6. The results show that modified GEMDOCK predicts 3 times for each complex and the performance of enzyme-inhibitor (50%) better than antibody-antigen (11%) and others (27%). Figure 3 shows that modified GEMDOCK could give us confident binding conformations in some good test cases, and RMSD of these cases are smaller than 2Å. However, the overall performance is not satisfied
22
since scoring function using here is for protein-ligand docking, fortunately, the search strategies of GEMDOCK is work for protein-protein docking. In the future, we will improve scoring function of GEMDOCK for protein-protein docking and develop soft-body protein-protein docking strategies for solving unbound-unbound protein docking problems.
Table 6. Results of protein-protein docking using GEMDOCK
Complexes ∆ASAa (Å2) R2Åb R5Åc Best RMSDd (Å)
Enzyme-inhibitor (22) 1ACB(E:I) 1540 0 0 42.608 1AVW(A:B) 1740 2 2 1.147 1BRC(E:I) 1320 0 0 33.596 1BRS(A:D) 1560 2 3 1.054 1CGI(E:I) 2050 1 2 0.766 1CHO(E:I) 1470 0 2 3.290 1CSE(E:I) 1490 0 0 38.819 1DFJ(I:E) 2580 0 0 34.574 1FSS(A:B) 1970 1 1 1.139 1MAH(A:F) 2150 0 0 44.698 1TGS(Z:I) 1720 1 1 1.469 1UGH(E:I) 2190 2 2 0.990 2KAI(AB:I) 1420 0 0 35.888 2PTC(E:I) 1430 2 2 1.021 2SIC(E:I) 1620 0 0 38.308 2SNI(E:I) 1630 0 0 41.653 1PPE(E:I) 1690 2 2 0.405 1STF(E:I) 1790 0 0 50.064 1TAB(E:I) 1360 0 2 2.937 1UDI(E:I) 2020 0 0 52.762 2TEC(E:I) 1560 0 0 40.941 4HTC(LH:I) 3320 3 3 0.595 Antibody-antigen (19) 1AHW(DE:F) 1900 0 0 42.145 1BVK(DE:F) 1400 0 0 20.312 1DQJ(AB:C) 1760 0 0 23.532 1MLC(AB:E) 1390 0 0 56.737
1WEJ(LH:F) 1180 0 0 49.428 1BQL(LH:Y) 1630 0 0 56.011 1EO8(LH:A) 1530 0 0 60.475 1FBI(LH:X) 1690 2 2 0.890 1IAI(MI:LH) 1890 0 0 66.795 1JHL(LH:A) 1240 0 0 18.284 1KXQ(D:E) 2140 0 0 51.302 1KXT(A:B) 1620 0 0 46.379 1KXV(A:C) 1620 0 0 29.846 1MEL(B:M) 1690 0 0 31.372 1NCA(LH:N) 1950 1 1 1.353 1NMB(LH:N) 1350 0 0 42.987 1QFU(LH:A) 1840 0 0 57.265 2JEL(LH:P) 1500 0 0 46.708 2VIR(AB:C) 1260 0 0 48.825 Others (11) 1AVZ(B:C) 1260 0 0 33.498 1L0Y(A:B) 1130 0 0 61.263 1WQ1(G:R) 2910 1 2 1.319 2MTA(LH:A) 1460 0 0 36.863 2PCC(A:B) 1140 0 0 57.244 1A0O(A:B) 1130 0 0 47.668 1ATN(A:D) 1770 0 0 53.990 1GLA(G:F) 1300 0 0 23.888 1IGC(LH:A) 1330 0 0 45.528 1SPB(S:P) 2230 2 2 0.242 2BTF(A:P) 2060 3 3 0.669 a
∆ASA: change in accessible surface area (ASA) on complex formation was calculated, by using the program NACCESS.[53]
b
R2Å: Number of predictions with RMSD smaller than 2 Å among 3 rounds
c
R5Å: Number of predictions with RMSD smaller than 5 Å among 3 rounds
d
24
4 Discussion
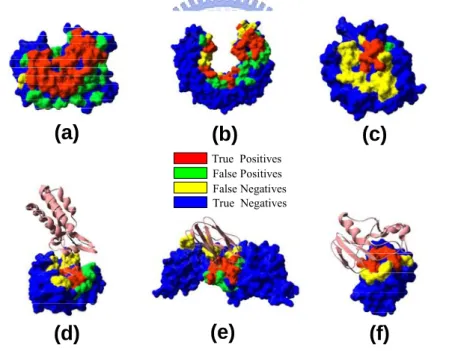
Figure 4 shows six examples of the prediction outcome of the training set (figure 4a, 4b and 4c) and testing set (figure 4d, 4e and 4f). Predicted interface and non-interface residues, identified by the GEM, are shown as color coded patches as follows: Red spheres = true positives (TP), actual interface residues that are predicted as such; Blue strands = true negatives (TN), non-interface residues that are predicted as such; Yellow spheres = false negatives (FN), interface residues that are misclassified as non-interface residues; Green spheres = false positives (FP), non-interface residues that are misclassified as interface residues. From the figure 4, one clearly sees that not all the interface was predicted, but that the predicted part fits the interface well.
(a)
(b)
(c)
(d)
(e)
(f)
True Positives False Positives False Negatives True NegativesFigure 4. Prediction results of training set and testing set. The partner molecule(s)
in the bound conformation after superimposition of the corresponding molecule in the complex is represented in ribbon. (a) Prediction on 1dqj_r of the Hyhel-63 Fab, (b) prediction on 1dfj_r of the ribonuclease inhibitor, (c) prediction on 1acb_r of the α-Chymotrypsin, (d) prediction on 2cpl of the Cyclophilin a, (e) prediction on 1ctm of the Cytochrome f, (f) prediction on 1a19A of the Barstar.
(c)
(d)
(a)
(b)
Figure 5. Case study of limitations. (a) 1ahw_l, green : prediction area, yellow :
interface, blue : others, red block : fibronectin type III modules; (b) The target protein 1wej_l is shown in ribbons, green : prediction area, yellow : interface, blue : others, purple : heme; (c) pink : 1noc A chain, green : 1noc B chain and grey : 1nos; (d) 1pco, green : prediction area, yellow : interface, blue : others; and 1eth A chain (ribbon with pink color).
There are some limitations in the current implementation of the method. Figure 5 shows the limitations in the performance between the training set (figure 5a and figure 5b) and testing set (figure 5c and figure 5d). Figure 5a shows the structure of 1ahw_l. Although our prediction area is far from the interface, this structure consists of two fibronectin type III modules whose hydrophobic cores merge in the domain-domain interface and our prediction is almost invariably symmetrical. Figure 5b shows the structure of 1wej_l. The prediction of our method is located nearby heme propionate, this result may due to the residues nearby the heme are more hydrophobic than protein-protein interaction site. Figure 5c shows the structures of bound protein complex : 1noc A chain and B chain and unbound protein : 1nos. After structure
26
alignment of 1noc A chain and 1nos, unfortunately, contact residues between 1nos and 1noc B chain are less than the bound protein complex, and it is difficult for our method to identify interaction site of 1nos. Figure 5d shows the structure of 1pco and 1eth A chain. The surface of 1eth A chain (colipase) can be divided into a rather hydrophilic part, interacting with 1pco (lipase), and a more hydrophobic part, formed by the tips of the fingers [60]. This suggests that interface of 1pco is more hydrophilic than the surface, and our method do not prove to be very useful in this case.
5 Conclusion
We have developed a method for predicting protein-protein binding sites using GEM. To train the GEM and to test the prediction method we collected dataset of 104 unbound proteins—the nonredundant benchmark for testing protein-protein docking algorithms. We were able to successfully predict the location of the binding site on 65.4% of the 104 proteins in training set. In addition, we tested GEM to predict 50 unbound proteins and had 46% successfully prediction in testing set. The performance were achieved using only 18 attributes so prediction results should be improved when more properties that distinguish between interfaces and the rest of the protein surface become available.
This method can be further improved on several aspects. First, we notice that hydrophilic effect may be main force of protein-protein interaction in some cases (figure 5d), and our predictions are poor. This is due to the fact that most interfaces of training set are hydrophobic and our parameters perform this characteristic faithfully. Therefore, it may be useful to classify interfaces of training set according to hydrophobic or hydrophilic, and each protein has two predicting areas which are hydrophobic patch and hydrophilic patch. Second, sequence conservation tends to be important attribute to identify protein-protein interface [35]. Third, the effect of 2nd structure information is not very clear, therefore, we intend to understand it of our model. Finally, we will apply our approach to other data set and to study the behavior of our model. In the future, we will combine protein-protein interaction sites prediction into GEMDOCK and improve scoring function of GEMDOCK for protein-protein docking and develop soft-body protein-protein docking strategies for solving unbound-unbound protein docking problems.
28
Reference
[1] A. C. Gavin, M. Bosche, R. Krause, P. Grandi, M. Marzioch, A. Bauer, J. Schultz, J. M. Rick, A. M. Michon, C. M. Cruciat, M. Remor, C. Hofert, M. Schelder, M. Brajenovic, H. Ruffner, A. Merino, K. Klein, M. Hudak, D. Dickson, T. Rudi, V. Gnau, A. Bauch, S. Bastuck, B. Huhse, C. Leutwein, M. A. Heurtier, R. R. Copley, A. Edelmann, E. Querfurth, V. Rybin, G. Drewes, M. Raida, T. Bouwmeester, P. Bork, B. Seraphin, B. Kuster, G. Neubauer, and G. Superti-Furga, "Functional organization of the yeast proteome by systematic analysis of protein complexes," Nature, vol. 415, pp. 141-7, 2002.
[2] L. Giot, J. S. Bader, C. Brouwer, A. Chaudhuri, B. Kuang, Y. Li, Y. L. Hao, C. E. Ooi, B. Godwin, E. Vitols, G. Vijayadamodar, P. Pochart, H. Machineni, M. Welsh, Y. Kong, B. Zerhusen, R. Malcolm, Z. Varrone, A. Collis, M. Minto, S. Burgess, L. McDaniel, E. Stimpson, F. Spriggs, J. Williams, K. Neurath, N. Ioime, M. Agee, E. Voss, K. Furtak, R. Renzulli, N. Aanensen, S. Carrolla, E. Bickelhaupt, Y. Lazovatsky, A. DaSilva, J. Zhong, C. A. Stanyon, R. L. Finley, Jr., K. P. White, M. Braverman, T. Jarvie, S. Gold, M. Leach, J. Knight, R. A. Shimkets, M. P. McKenna, J. Chant, and J. M. Rothberg, "A protein interaction map of Drosophila melanogaster," Science, vol. 302, pp. 1727-36, 2003.
[3] Y. Ho, A. Gruhler, A. Heilbut, G. D. Bader, L. Moore, S. L. Adams, A. Millar, P. Taylor, K. Bennett, K. Boutilier, L. Yang, C. Wolting, I. Donaldson, S. Schandorff, J. Shewnarane, M. Vo, J. Taggart, M. Goudreault, B. Muskat, C. Alfarano, D. Dewar, Z. Lin, K. Michalickova, A. R. Willems, H. Sassi, P. A. Nielsen, K. J. Rasmussen, J. R. Andersen, L. E. Johansen, L. H. Hansen, H. Jespersen, A. Podtelejnikov, E. Nielsen, J. Crawford, V. Poulsen, B. D. Sorensen, J. Matthiesen, R. C. Hendrickson, F. Gleeson, T. Pawson, M. F. Moran, D. Durocher, M. Mann, C. W. Hogue, D. Figeys, and M. Tyers, "Systematic identification of protein complexes in Saccharomyces cerevisiae by mass spectrometry," Nature, vol. 415, pp. 180-3, 2002.
[4] S. Li, C. M. Armstrong, N. Bertin, H. Ge, S. Milstein, M. Boxem, P. O. Vidalain, J. D. Han, A. Chesneau, T. Hao, D. S. Goldberg, N. Li, M. Martinez, J. F. Rual, P. Lamesch, L. Xu, M. Tewari, S. L. Wong, L. V. Zhang, G. F. Berriz, L. Jacotot, P. Vaglio, J. Reboul, T. Hirozane-Kishikawa, Q. Li, H. W. Gabel, A. Elewa, B. Baumgartner, D. J. Rose, H. Yu, S. Bosak, R. Sequerra, A. Fraser, S. E. Mango, W. M. Saxton, S. Strome, S. Van Den Heuvel, F. Piano, J. Vandenhaute, C. Sardet, M. Gerstein, L. Doucette-Stamm, K. C. Gunsalus, J. W. Harper, M. E. Cusick, F. P. Roth, D. E. Hill, and M. Vidal, "A map of the interactome network of the metazoan C. elegans," Science, vol. 303, pp. 540-3,
2004.
[5] P. Uetz, L. Giot, G. Cagney, T. A. Mansfield, R. S. Judson, J. R. Knight, D. Lockshon, V. Narayan, M. Srinivasan, P. Pochart, A. Qureshi-Emili, Y. Li, B. Godwin, D. Conover, T. Kalbfleisch, G. Vijayadamodar, M. Yang, M. Johnston, S. Fields, and J. M. Rothberg, "A comprehensive analysis of protein-protein interactions in Saccharomyces cerevisiae," Nature, vol. 403, pp. 623-7, 2000. [6] S. Jones and J. M. Thornton, "Principles of protein-protein interactions,"
Proceedings of the National Academy of Sciences of the United States of America, vol. 93, pp. 13-20, 1996.
[7] S. Jones and J. M. Thornton, "Prediction of protein-protein interaction sites using patch analysis," Journal of Molecular Biology, vol. 272, pp. 133-143, 1997.
[8] S. Jones and J. M. Thornton, "Analysis of protein-protein interaction sites using surface patches," Journal of Molecular Biology, vol. 272, pp. 121-132, 1997.
[9] I. M. Nooren and J. M. Thornton, "Diversity of protein-protein interactions,"
EMBO Journal, vol. 22, pp. 3486-3492, 2003.
[10] I. A. Vakser and C. Aflalo, "Hydrophobic docking: a proposed enhancement to molecular recognition techniques," Proteins: Structure, Function and Genetics, vol. 20, pp. 320-329, 1994.
[11] L. Young, R. L. Jernigan, and D. G. Covell, "A role for surface hydrophobicity in protein-protein recognition," Protein Science, vol. 3, pp. 717-729, 1994. [12] J. Fernandez-Recio, M. Totrov, and R. Abagyan, "Identification of
protein-protein interaction sites from docking energy landscapes," Journal of
Molecular Biology, vol. 335, pp. 843-865, 2004.
[13] J. Fernandez-Recio, M. Totrov, C. Skorodumov, and R. Abagyan, "Optimal docking area: a new method for predicting protein-protein interaction sites,"
Proteins: Structure, Function, and Bioinformatics, vol. 58, pp. 134-143, 2005.
[14] P. Fariselli, F. Pazos, A. Valencia, and R. Casadio, "Prediction of protein--protein interaction sites in heterocomplexes with neural networks,"
European Journal of Biochemistry, vol. 269, pp. 1356-1361, 2002.
[15] M. Keil, T. E. Exner, and J. Brickmann, "Pattern recognition strategies for molecular surfaces: III. Binding site prediction with a neural network,"
Journal of Computational Chemistry, vol. 25, pp. 779-789, 2004.
[16] H. Neuvirth, R. Raz, and G. Schreiber, "ProMate: a structure based prediction program to identify the location of protein-protein binding sites," Journal of
Molecular Biology, vol. 338, pp. 181-199, 2004.
30
profile and residue neighbor list," Proteins: Structure, Function and Genetics, vol. 44, pp. 336-343, 2001.
[18] J. M. Yang, "Development and evaluation of a generic evolutionary method for protein-ligand docking," Journal of Computational Chemistry, vol. 25, pp. 843-857, 2004.
[19] J. M. Yang and C. C. Chen, "GEMDOCK: a generic evolutionary method for molecular docking," Proteins: Structure, Function, and Bioinformatics, vol. 55, pp. 288-304, 2004.
[20] J. M. Yang, J. T. Horng, and C. Y. Kao, "A genetic algorithm with adaptive mutations and family competition for training neural networks," International
Journal of Neural Systems, vol. 10, pp. 333-352, 2000.
[21] J. M. Yang and C. Y. Kao, "A family competition evolutionary algorithm for automated docking of flexible ligands to proteins," IEEE Transactions on
Information Technology in Biomedicine, vol. 4, pp. 225-237, 2000.
[22] J. M. Yang and T. W. Shen, "A pharmacophore-based evolutionary approach for screening selective estrogen receptor modulators," Proteins: Structure,
Function, and Bioinformatics, vol. 59, pp. 205-220, 2005.
[23] J. M. Yang, C. H. Tsai, M. J. Hwang, H. K. Tsai, J. K. Hwang, and C. Y. Kao, "GEM: a Gaussian Evolutionary Method for predicting protein side-chain conformations," Protein Science, vol. 11, pp. 1897-1907, 2002.
[24] W. Kabsch and C. Sander, "Dictionary of protein secondary structure: pattern recognition of hydrogen-bonded and geometrical features," Biopolymers, vol. 22, pp. 2577-2637, 1983.
[25] Q. Dong, X. Wang, L. Lin, and Y. Guan, "Exploiting residue-level and profile-level interface propensities for usage in binding sites prediction of proteins," BMC Bioinformatics, vol. 8, pp. 147, 2007.
[26] F. Glaser, D. M. Steinberg, I. A. Vakser, and N. Ben-Tal, "Residue frequencies and pairing preferences at protein-protein interfaces," Proteins: Structure,
Function and Genetics, vol. 43, pp. 89-102, 2001.
[27] T. A. Larsen, A. J. Olson, and D. S. Goodsell, "Morphology of protein-protein interfaces," Structure, vol. 6, pp. 421-7, 1998.
[28] X. Gallet, B. Charloteaux, A. Thomas, and R. Brasseur, "A fast method to predict protein interaction sites from sequences," Journal of Molecular
Biology, vol. 302, pp. 917-26, 2000.
[29] A. Koike and T. Takagi, "Prediction of protein-protein interaction sites using support vector machines," Protein Engineering Design and Selection, vol. 17, pp. 165-73, 2004.
hydropathy in multisubunit proteins," Proteins: structure, function, and
bioinformatics, vol. 9, pp. 37-55, 1991.
[31] L. Lo Conte, C. Chothia, and J. Janin, "The atomic structure of protein-protein recognition sites," Journal of Molecular Biology, vol. 285, pp. 2177-98, 1999. [32] S. F. Altschul, T. L. Madden, A. A. Schaffer, J. Zhang, Z. Zhang, W. Miller,
and D. J. Lipman, "Gapped BLAST and PSI-BLAST: a new generation of protein database search programs," Nucleic Acids Research, vol. 25, pp. 3389-402, 1997.
[33] W. S. Valdar, "Scoring residue conservation," Proteins: structure, function,
and bioinformatics, vol. 48, pp. 227-41, 2002.
[34] J. R. Bradford and D. R. Westhead, "Asymmetric mutation rates at enzyme-inhibitor interfaces: implications for the protein-protein docking problem," Protein Science, vol. 12, pp. 2099-103, 2003.
[35] D. R. Caffrey, S. Somaroo, J. D. Hughes, J. Mintseris, and E. S. Huang, "Are protein-protein interfaces more conserved in sequence than the rest of the protein surface?" Protein Science, vol. 13, pp. 190-202, 2004.
[36] N. V. Grishin and M. A. Phillips, "The subunit interfaces of oligomeric enzymes are conserved to a similar extent to the overall protein sequences,"
Protein Science, vol. 3, pp. 2455-8, 1994.
[37] M. Guharoy and P. Chakrabarti, "Conservation and relative importance of residues across protein-protein interfaces," Proceedings of the National
Academy of Sciences of the United States of America, vol. 102, pp. 15447-52,
2005.
[38] A. Porollo and J. Meller, "Prediction-based fingerprints of protein-protein interactions," Proteins: structure, function, and bioinformatics, vol. 66, pp. 630-45, 2007.
[39] C. Cole and J. Warwicker, "Side-chain conformational entropy at protein-protein interfaces," Protein Science, vol. 11, pp. 2860-70, 2002.
[40] J. L. Chung, W. Wang, and P. E. Bourne, "Exploiting sequence and structure homologs to identify protein-protein binding sites," Proteins: structure,
function, and bioinformatics, vol. 62, pp. 630-40, 2006.
[41] M. C. Lawrence and P. M. Colman, "Shape complementarity at protein/protein interfaces," Journal of Molecular Biology, vol. 234, pp. 946-50, 1993.
[42] A. J. McCoy, V. Chandana Epa, and P. M. Colman, "Electrostatic complementarity at protein/protein interfaces," Journal of Molecular Biology, vol. 268, pp. 570-84, 1997.
[43] F. B. Sheinerman, R. Norel, and B. Honig, "Electrostatic aspects of protein-protein interactions," Current Opinion in Structural Biology, vol. 10,
32
pp. 153-9, 2000.
[44] D. Xu, S. L. Lin, and R. Nussinov, "Protein binding versus protein folding: the role of hydrophilic bridges in protein associations," Journal of Molecular
Biology, vol. 265, pp. 68-84, 1997.
[45] J. R. Bradford and D. R. Westhead, "Improved prediction of protein-protein binding sites using a support vector machines approach," Bioinformatics, vol. 21, pp. 1487-1494, 2005.
[46] P. Aloy, E. Querol, F. X. Aviles, and M. J. Sternberg, "Automated structure-based prediction of functional sites in proteins: applications to assessing the validity of inheriting protein function from homology in genome annotation and to protein docking," Journal of Molecular Biology, vol. 311, pp. 395-408, 2001.
[47] G. Casari, C. Sander, and A. Valencia, "A method to predict functional residues in proteins," Nature Structural Biology, vol. 2, pp. 171-8, 1995.
[48] S. Madabushi, H. Yao, M. Marsh, D. M. Kristensen, A. Philippi, M. E. Sowa, and O. Lichtarge, "Structural clusters of evolutionary trace residues are statistically significant and common in proteins," Journal of Molecular
Biology, vol. 316, pp. 139-54, 2002.
[49] Y. Ofran and B. Rost, "Predicted protein-protein interaction sites from local sequence information," FEBS Letters, vol. 544, pp. 236-239, 2003.
[50] F. Pazos, M. Helmer-Citterich, G. Ausiello, and A. Valencia, "Correlated mutations contain information about protein-protein interaction," Journal of
Molecular Biology, vol. 271, pp. 511-23, 1997.
[51] B. Wang, P. Chen, D. S. Huang, J. J. Li, T. M. Lok, and M. R. Lyu, "Predicting protein interaction sites from residue spatial sequence profile and evolution rate," FEBS Letters, vol. 580, pp. 380-4, 2006.
[52] D. K. Gehlhaar, G. M. Verkhivker, P. A. Rejto, C. J. Sherman, D. B. Fogel, L. J. Fogel, and S. T. Freer, "Molecular recognition of the inhibitor AG-1343 by HIV-1 protease: conformationally flexible docking by evolutionary programming," Chemistry and Biology, vol. 2, pp. 317-24, 1995.
[53] R. Chen, J. Mintseris, J. Janin, and Z. Weng, "A protein-protein docking benchmark," Proteins: Structure, Function and Genetics, vol. 52, pp. 88-91, 2003.
[54] C. Yan, D. Dobbs, and V. Honavar, "A two-stage classifier for identification of protein-protein interface residues," Bioinformatics, vol. 20 Suppl 1, pp. I371-I378, 2004.
[55] B. Rost and C. Sander, "Conservation and prediction of solvent accessibility in protein families," Proteins: Structure, Function, and Genetics, vol. 20, pp.
216-226, 1994.
[56] S. Ansari and V. Helms, "Statistical analysis of predominantly transient protein-protein interfaces," Proteins: Structure, Function, and Bioinformatics, vol. 61, pp. 344-355, 2005.
[57] M. J. Sternberg, H. A. Gabb, and R. M. Jackson, "Predictive docking of protein-protein and protein-DNA complexes," Current Opinion in Structural
Biology, vol. 8, pp. 250-256, 1998.
[58] D. Eisenberg and A. D. McLachlan, "Solvation energy in protein folding and binding," Nature, vol. 319, pp. 199-203, 1986.
[59] L. Wesson and D. Eisenberg, "Atomic solvation parameters applied to molecular dynamics of proteins in solution," Protein Science, vol. 1, pp. 227-235, 1992.
[60] M. P. Egloff, L. Sarda, R. Verger, C. Cambillau, and H. van Tilbeurgh, "Crystallographic study of the structure of colipase and of the interaction with pancreatic lipase," Protein Science, vol. 4, pp. 44-57, 1995.