phys. stat. sol. (c) 1, No. 12, 3579 – 3582 (2004) / DOI 10.1002/pssc.200405510
© 2004 WILEY-VCH Verlag GmbH & Co. KGaA, Weinheim
Temperature dependence of magnetic properties
in Ni-Mn-Ga shape memory alloys
M.D. Lee*1 , N.V. Nong3 , N.P. Thuy3 , Y.D. Yao1,2 , S.F. Lee2 , Y. Liou2 , Y.Y. Chen2 , and C.R. Wang4 1
Department of Materials Science and Engineering, National Chiao Tung University, Hsinchu 300, Taiwan
2
Institute of Physics, Academia Sinica, Taipei 115, Taiwan
3
International Training Institute for Materials Science (ITIMS), Hanoi, Viet Nam
4
Department of Physics, Tunghai University, Taichung 407, Taiwan
Received 27 June 2004, accepted 14 October 2004 Published online 20 December 2004
PACS 72.15.–v, 75.30.Kz, 75.50.Cc, 75.60.Ej
Due to exhibiting giant field-induce strain, the Ni2MnGa shape memory alloys are great interest for both
scientific researches and industry applications. The non-stoichiometric Ni50Mn25+xGa25–x alloys with x varied
from 1.5, 2.5 to 4 have been fabricated by arc-melting. Martensitic transformation temperature for struc-ture transformation from tetragonal to cubic (TM) was observed from the magnetization, electrical resistiv-ity and X-ray diffraction studies as functions of temperature below 400 K. We found that TM increases roughly from 280 K to 310K with increasing x from 1.5 to 4. However, the Curie transition (TC) is
roughly at 380 K for all the samples, it is insensitive to the variation of Mn/Ga ratio. The electrical resis-tivity data exhibit a deep near TM and a slope change near TC. We have experimentally demonstrated that
the shape memory effect can be occurred at room temperature with a proper concentration variation of Mn and Ga.
© 2004 WILEY-VCH Verlag GmbH & Co. KGaA, Weinheim
1 Introduction
Ferromagnetic shape memory alloy (FSMA) Ni2MnGa provides the possibility in
microelectromechani-cal systems (MEMS) [1, 2] with large induced strain [3]. Up to 6% magnetic-field-induced strain has been reported at room-temperature in magnetic fields below 1 T [4]. With decreasing temperature, the structure of Ni2MnGa transformed from cubic austenite to tetragonal martensitic, and it
shows giant strain related to the motion of the martensitic twin boundary by magnetic field [5–7]. Many efforts have been focused on the magnetic behaviors of Ni2MnGa system, and relatively very few reports
[8] on its electrical resistivity behavior. In this study, we reported the properties of electrical resistivity and magnetization measurement as a function of temperature of the varied Ni2MnGa compound alloys.
2 Experiments
The ingot of NiMnGa samples was prepared by arc-melting with the high purity elements (99.99 at %) under an Ar atmosphere, and remelted at least three times to ensure homogeneity. They were
vacuum-*
3580 M. D. Lee et al.: Temperature dependence of magnetic properties in Ni-Mn-Ga shape memory alloys
© 2004 WILEY-VCH Verlag GmbH & Co. KGaA, Weinheim
sealed in quartz tube and annealed at 1100 o
C for ten days, followed by ice water quenching for three samples of NiMnGa where Mn is substituted for Ga from x = 1.5 to 4 in Ni50Mn25+xGa25–x.
A powder specimen for X-ray analysis was prepared from the same ingot which was studied using the Philips X’Pert X-ray diffractometer with CuKα radiation. The electrical resistivity was measured using a commercial (Quantum design) Physical Property Measurement System (PPMS). The magnetization of these compounds were measured in superconducting quantum interference device (SQUID) magnetometer.
3 Results and discussion
Crystal structure of different temperature from 100 K to 370 K was analyzed by X-ray diffraction for all the samples. Take the Ni50Mn26.5Ga23.5 in Fig. 1 for example. It is clear that when the temperature is above
280 K, two peaks appear near 2θ = 44° and 81°, which shows that the single phase is of cubic austenite structure. For the type of cubic L21, Ni atoms occupy (0,0,0) and (1/2,1/2,1/2) site, Mn occupy
(1/4,1/4,1/4) site, and Ga occupy (3/4,3/4,3/4) site [9]. When temperature decreases below 260 K, four peaks that occur near 2θ = 43°,45°,80° and 83° were monitored, indicating that pure tetragonal marten-site phase crystallizes. For this structure, Ga atoms are placed on the corners and center of cell. A Mn atom is placed between one pair of Ga along the c axis, and another Mn atom occupy the center of face which vertical with c-axis. Ni atoms occupy the faces of the tetragonal cell, such that two of them lay at 1/4 and 3/4 height at the center of the face [10]. The cubic and the tetragonal co-exist in the temperature that ranges from 260 K to 280 K. It is clear in X-ray diffraction pattern that with the decrease of tempera-ture, the structure transform from cubic to tetragonal in Ni2MnGa alloy.
40 50 60 70 80 90
2
θ
100K 220K 240K 260K 280K 300K 350K 370K In te ns ity (a .u .) 270KNi50Mn26.5Ga23.5 Fig. 1 X-ray diffraction at different temperatures from 100 K to 370 K for Ni50Mn26.5Ga23.5 alloy.
phys. stat. sol. (c) 1, No. 12 (2004) / www.pss-c.com 3581
© 2004 WILEY-VCH Verlag GmbH & Co. KGaA, Weinheim
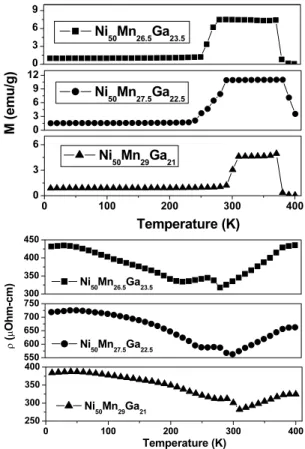
Figure 2 shows the typical temperature dependence of magnetization curves M(T) for alloys of Ni50Mn25+xGa25– x (x = 1.5, 2.5, 4) in low magnetic field H = 100 Oe. These results indicate the existence
of two sharp phase transitions: For example Ni50Mn26.5Ga23.5, the transition occurred at 280K is related to
the martensitic transition (TM) from tetragonal structure at low temperature to cubic structure at high
temperature. The result is consistent with Fig. 1. The TM increases from 280 K for sample with x = 1.5 to
290 and 310 K for samples with x = 2.5 and 4 as shown in Fig. 2. However, the Curie transition (TC) is
roughly at 380 K for all the samples, therefore, it is insensitive to the addition of Mn/Ga ratio [11]. Figure 3 shows the electrical resistivity as a function of temperature between 10 and 400 K for sam-ples Ni50Mn25+xGa25– x (x = 1.5, 2.5, 4) under an external magnetic field of 100 Oe. For temperatures
below 50 K, the resistivity is roughly independent to the temperature [8]. For temperatures between 50 K and TM, it decreases with increasing temperature. The structure transforms from tetragonal below TM to
cubic above it. For temperatures above TM, the resistivity increases with increasing temperature;
how-ever, it shows a knee near Tc = 380 K. This is a typical behavior for magnetic phase transition at Tc.
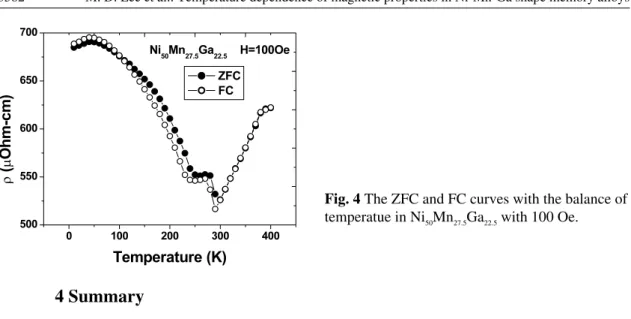
Figure 4 shows the electrical resistivity curves under zero field cooling (ZFC) and field cooling (FC) for Ni50Mn27.5Ga22.5. The applied magnetic field is kept at 100 Oe. It is obvious that ZFC and FC
curves overlap in cubic structure region (i.e. above TM). For temperatures below TM, the ZFC and FC
curves becomes apart from each other, and those curves insensitive to magnetic field. At 10 K, the chan-ge of resistivity is only 0.14% for field increased to 3 T. Near the structure transition temperature, which is between 280 K to 300 K, the resistivity data exhibit a hysteresis, and the variation of the resistivity is roughly 7%. 0 100 200 300 400 0 3 6 0 3 6 9 0 3 6 9 12 Temperature (K) Ni50Mn29Ga21 Ni50Mn26.5Ga23.5 M ( em u /g ) Ni50Mn27.5Ga22.5 300 350 400 450 0 100 200 300 400 250 300 350 400 550 600 650 700 750 Ni50Mn26.5Ga23.5 Temperature (K) ρ ( µ Oh m -c m ) Ni50Mn29Ga21 Ni50Mn27.5Ga22.5
Fig. 2 Magnetization curves for Ni50Mn25+xGa25–x
(x = 1.5, 2.5, 4) in low magnetic field H = 100 Oe.
Fig. 3 Resistivity as a function of temperature for
the alloys Ni50Mn25+xGa25–x (x = 1.5, 2.5, 4) with
3582 M. D. Lee et al.: Temperature dependence of magnetic properties in Ni-Mn-Ga shape memory alloys
© 2004 WILEY-VCH Verlag GmbH & Co. KGaA, Weinheim
0 100 200 300 400 500 550 600 650 700 Ni50Mn27.5Ga22.5 H=100Oe ρ ( µ Oh m-cm ) Temperature (K) ZFC FC
4 Summary
Martensitic transformation temperature for structure transformation from tetragonal to cubic was ob-served from the magnetization, electrical resistivity and X-ray diffraction studies as functions of tem-perature below 400 K for three Ni50Mn25+xGa25–x alloys with x varied from 1.5, 2.5 to 4. TM increases
roughly from 280 K to 310 K with increasing x from 1.5 to 4. However, the Curie transition (TC) is
roughly at 380 K for all the samples, it is insensitive to the variation of Mn/Ga ratio.
References
[1] J.W. Dong, L.C. Chen, C.J. Palmstrom, R.D. James, and S. McKerman, Appl. Phys. Lett. 75, 1443 (1999).
[2] M. Wuttig, C. Craciunescu, and Jian Li, Mater. Trans. JIM 41, 933 (2000).
[3] K. Ullakko, J.K. Huang, C. Kantner, R.C.O’Handley, and V.V. Kokorin, Appl. Phys. Lett. 69, 1966 (1996).
[4] S.J. Murray, M. Marioni, P.G. Tello, S.M. Allen, and R.C. O’Handley, J. Magn. Magn. Mater. 226, 945 (2001).
[5] R. Tickle, R.D. James, T. Shield, M. Wuttig, and V.V. Kokorin, IEEE Trans. Magn. 35, 4301 (1999). [6] S.J. Murray, M. Mariono, A.M. Kukla, J. Robinson, R.C. O’Handley, and S.M. Allen, J. Appl. Phys.
87, 5775 (2000).
[7] H.D. Chopra, Chunhai Ji, and V.V. Kokorin, Phys. Rev. B 61, 913 (2000).
[8] P.G. Tello, F.J. Castano, R.C. O’Handley, and S.M. Allen, J. Appl. Phys. 91, 8234 (2002) [9] C. Jiang, G. Feng, S. Gong, and H. Xu, Mater. Sci. Eng. A 342, 231 (2003).
[10] G. Mogylnyy, I. Glavatskyy, N. Glavatska, O. Soderberg, Y. Ge, and V.K. Lindroos, Scripta Mater.
48, 1427 (2003).
[11] O. Heczko, L. Straka, N. Lanska, K. Ullakko, and J. Enkovaara, J. Appl. Phys. 91, 8228 (2002).
Fig. 4 The ZFC and FC curves with the balance of