The Prediction and Investitive Decision Software of
Stock Price with Support Vector Machine and Fuzzy
Theory
Wei-Cheng LeeDepartment of Computer Science and Information Engineering
National Formosa University, Taiwan Email: [email protected]
Jin-Tsong Jeng
Department of Computer Science and Information Engineering
National Formosa University, Taiwan Email: [email protected] Abstract ― In this paper, the prediction and
investitive decision software of stock price with support vector regression machine and fuzzy decision is proposed. Firstly, we used support vector regression machine for Taiwan stock price that used daily and practical price to input data and to implement stock approximated simulation and prediction. Furthermore, used learned model data from generate of learning to future stock price trend for prediction analysis and technical index analysis that combine fuzzy decision theory for develop optimal investitive decision. According to this method to handle buy, sell or unhandled, let investor to find out this trend. Finally, investitive decision software is implemented with .net environment.
Keywords ― Support Vector Machine, Support
Vector Regression, Technical Analysis, Fuzzy Theory, Investment Decision
I. INTRODUCTION
According to Directorate-General of Budget, Accounting and Statistics, Executive Yuan, R.O.C. investigate shows, the richness 20 percent of family, holds 55 percent of finance property all over the country, 51 percent of real property. Contrast with England, America or any country, these rates can only raise and can’t reduce in the future. Consequently, either you don’t want to investment, or no choice to learning it, which is kind of trend in the future, and further, under current save rates lower to inflation can help you to earn money. To discuss about estimate of stock investment tool, also have many people think risks over high, need to more time and money to invest in the estimated profit, and a large mass of people more than half regard as kind of gambling for stock knowledge, unable to evaluation stock will be rise or fall by oneself. Consequently, we used Support vector machine (SVM) and C# to develop stock price
forecasting system, can help have an investor of requirement determine and prediction latter stock price trend by using this system.
II. BACKGROUND INFORMATION A. Support Vector Machines
Support vector machines [1~2] had been extended to apply for biotechnology [3], image recognize [4], text categorization [5] field and to solve individually field categorization related to a topic for discussion. The purpose of support vector machine is found enough accuracy regression equation or recognize machine for latter unknown input to recognize.
B. Support Vector Regression
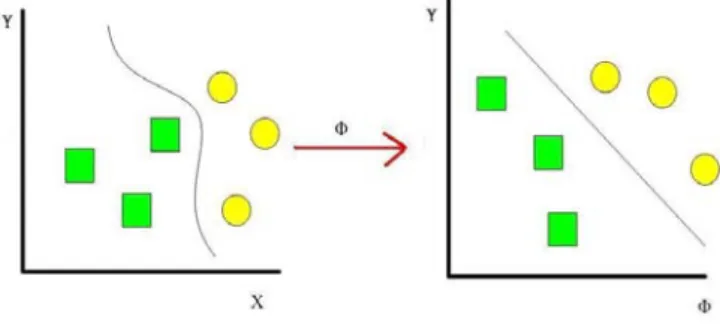
Support vector regression (SVR) [6] was been proposed and used to one of method of prediction in recent year. Its principal based on statistical learning theory [7] and structural risk minimization principle theorem [8]. Support Vector Regression to get corresponding relation between independent variables and dependent variables (via a function ø) from original lower rank raised to higher rank characteristic space, via this method to find a new corresponding function, such that projected optimum of prediction effect, show in Figure 1.
C. Technical index analysis
So called technical analysis [9] is analysis for market behavior of stock market. That characteristic for behavior of market in the past and present, apply to method of statistics, develop some will help investor using market of objective and scientism to estimation commerce in suitable time. The behavior of market include is high and low of price, variation of price, occur these change transaction amount of accompany and time of finish these variation. Technical analysis is one kind of generally apply to analysis tool of stock market, either one kind of tool, or a quite profound knowledge. We can say, if without help of technical analysis, investor want to get success in stock market is fantastic.
D. Fuzzy theory
Since 1965, control expert L.A. Zadeh composite predecessors conception in multivalue logic, after proposed one kind of method be able to nature and society phenomenon, have not fuzzy conception [10~11] of absolute explicit extension, until present to research develop through 40 years ago, that theory method already perfect day by day, already extensively used to apply in nature science, society science, humanities science and more field, such as image recognize, automatic control, psycho analysis, finance manage are belong to field of Fuzzy application.
There are four properties in the basic architecture of fuzzy systems that include fuzzifier, fuzzy rule base, fuzzy inference engine and defuzzifier and shown in Figure 2.
Figure 2: Basic architecture of Fuzzy system.
Fuzzifier is get crisp external input data transform to suitable semantic fuzzy information; Fuzzy rule base is saving solve to be related to problem in want of knowledge and rule; Fuzzy inference engine is hereby execute approximate inference or fuzzy inference, simulate way of humanity think decision to solve to be confronted with problem; Defuzzifier is get fuzzy information
of fuzzy inference engine, transform to crisp number of external able to accept.
III. SYSTEM ARCHITECTURE AND ANALYSIS
A. Architecture of SVR model
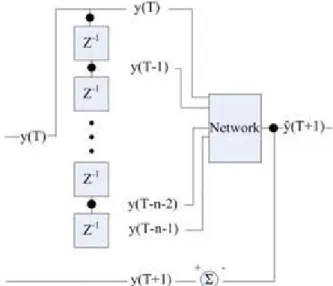
We can see if we used under multi-point to one-point output for original model, learning graph is more precise than original and used low support vector point even if have not bad learning efficiency and result, show in Figure 3. We also use this frame to write as experience input of learning used older parameter point, and then we could get prediction point in the future. When training data, price of daily can separate into parts one-to-one and ten-to-one two format. One-to-one means one input for one output, we adopt input is number of days, output is stock price opening quotation. Ten-to-one means ten input for one output, we adopt input is stock opening quotation before ten days corresponding to opening quotation of next day.
Figure 3: The architecture of SVR Model.
The major goal to separately is we want to know practical input stock price to do prediction whether more precise than simple use number of days. SVM approximate the function using the following:
( )
x w( )
x bf = φ + (1)
where φ
( )
x is the high dimensional feature space which is non-linearly mapped from the input spacex. The coefficients w and b are estimated by:
min
∑
(
( )
( )
( )
)
= + n i i x f i y L n C w 1 2 , 2 1 (2)where
( )
( )
( )
(
)
( )
( )
( )
( )
( )
( )
⎩ ⎨ ⎧ − − − ≥ = . 0 , , otherwise i x f i y if i x f i y i x f i y L ε ε (3)In equation (13), the first term is the regularization term and the second term is the empirical risk. They are measured by the ε-insensitive loss function given by equation (14), parameter C is referred to as the regularized constant and it determines the trade-off between the empirical risk and the regularization term, parameter ε is called the tube size and it is equivalent to the approximation accuracy placed on the training data points.
B. Architecture of system
We used C# to writing program and add support vector regression machines as main architecture to be directed against stock price to learning and prediction, user can use our system download stock price from past to present and via system draw learning graph and prediction graph to analysis and estimate, our system frame graph shown in Figure 4.
Figure 4: The architecture of software systems.
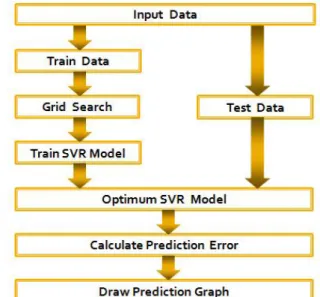
The main conception of this system could via training data, via grid search to find optimum model file for the purpose of prediction in the future after user input data, furthermore, after via test data and calculate an error, can obtain to want to prediction graph, shown in Figure 5. In finding optimum model, we add one kind of method calls Grid Search, shown in Figure 6.
Figure 5: The architecture of prediction systems.
Figure 6: Grid search concept graph.
C. Fuzzy decision
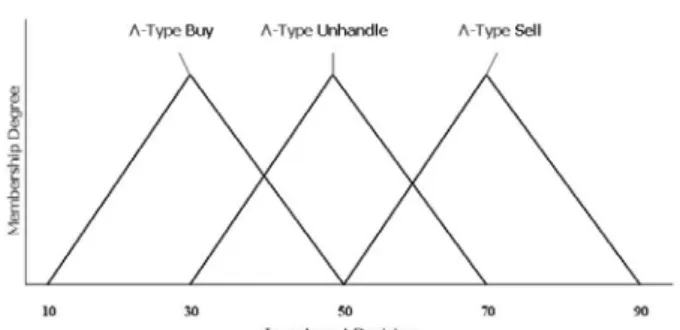
In this paper, we get size of technical index divide to three condition of high, middle and low, therefore, divide to three set of high, middle and low. Furthermore, the three sets corresponding to S-Type, Λ-Type and Z-Type three kind membership degree, respectively. Figure 7 shows the technical index membership function. Besides, investitive decision also divides to buy, sell and unhandle three conditions. Therefore, the three set of buy, sell and unhandle are belong to Λ-Type kind of membership degree, respectively. Figure 8 shows the investitive decision membership function.
Figure 8: The investitive decision membership function.
In this paper, we used five technical index, namely %R, KD, BIAS, RSI and MACD. In addition, we used prediction value of SVR calculate as one index in order to modify other index. As a result high, middle and low of each technical index representative numeral range are not equivalent; therefore, in order to fit in with practical condition, we define high, middle and low of each technical index corresponding to membership function, respectively. Technical index membership function saves in Table 1. Investment decision membership function saves in Table 2. (1) average of ten days price × 0.8 × 90%. (2) average of ten days price × 0.8 × 110%. (3) average of ten days price × 0.8.
(4) average of ten days price. (5) average of ten days price × 1.2.
(6) average of ten days price × 1.2 × 90%. (7) average of ten days price × 1.2 × 110%.
Table 1: The technical index membership function.
Table 2: The investitive decision membership function.
According to fuzzy set and membership function of the front establish, get input technical
index to fuzzifier, individual to calculate technical index for membership degree of individual set.
According to size of technical index to transforms to statement of「If…then…」to establish rule database. In this paper, we have six input variable, each rule are use six input variable as premise and use "AND" logical operator to connect with input variable of each rule, conclusion is buy, sell or unhandle three kind condition, each rule are use six variable to permutation, rule saves in Table 3.
Table 3: The rule database for the proposed systems.
According to establish rule database, compare fuzzifiler technical index with rule of rule database and execute approximate inference. We used standard of fuzzy set operator, Mamdani implication and Product Inference Engine, formula as: Fuzzy union:
(
A∪B)( )
x =max(
A( ) ( )
x,B x)
. (4) Fuzzy intersection:(
A∩B)( )
x =min(
A( ) ( )
x ,B x)
. (5) Funny complement:( )
x A( )
x A =1− . (6) Mamdani implication:(
A→B)( ) ( ) ( )
x =A x ×B x . (7)Product Inference Engine:
( ) max max
(
( )
1( )
1 2( )
2( )
)
. 1 ⎥⎥ ⎥ ⎦ ⎤ ⎢ ⎢ ⎢ ⎣ ⎡ ∈ = ′ ′ × × × = y B x A x A x A l l l X x y B m l (8) Finally, we used to get conclusion of fuzzy inference to defuzzifier to obtain crisp conclusion to decision buy or sell, formula as:( )
( )
∑
∑
= = ′ ′ × = m l l m l l l B h B h p y 1 1 * . (9)
IV. RESULTS AND DISCUSSION
In this paper, we used C.J. Lin LibSVM (aLibrary for Support Vector Machine) [12] tool of develop and C# writing program to execute develop to test and verify. In period of test and verify, we use grid search for trains set to find parameter combination of optimum, furthermore utilize this parameter combination to training data set to found practical support vector regression prediction model. Finally, we used test set to estimate how about support vector regression prediction model for prediction capability of new data.
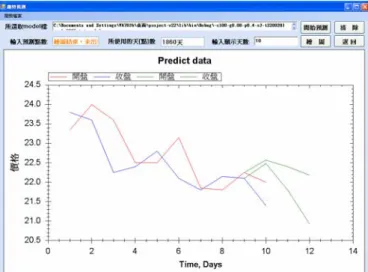
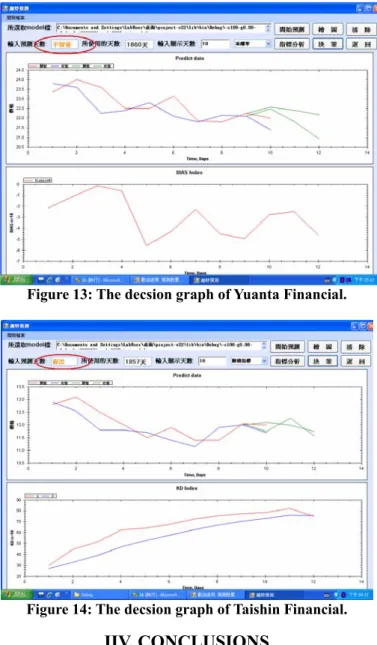
We practice running two examples to view and test, Yuanta Financial and Taishin Financial two companies, respectively. Below four graphs are two company graphs of training and prediction, respectively. Figures 9 and 10 are example 1, Figures 11 and 12 are example 2. That is, four graphs are Yuanta Financial and Taishin Financial two company graph of daily transaction information from the 91th year to 8th month of 98th year of the Republic Era. About have approach 2000 points to learning. The graph of learning and prediction have precisely to prove our system have precise. Besides of we also used Yuanta Financial and Taishin Financial two company example of daily transaction information from the 91th year to 8th month of 98th year of the Republic Era to show condition of fuzzy approximate inference. About have approach 2000 points to learning, show in Figures 13 and 14.
Figure 9: The training graph of Yuanta Financial.
Figure 10: The prediction graph of Yuanta Financial.
Figure 11: The training graph of Taishin Financial.
Figure 13: The decsion graph of Yuanta Financial.
Figure 14: The decsion graph of Taishin Financial.
IIV. CONCLUSIONS
In this paper, we proposed fuzzy decision to improve our previous results. We use opening quotation, closing quotation, highest quotation and lowest quotation data to generate the Williams index, KD index, BIAS, RSI Index and MACD Index. We integrate these index and output for prediction of stock price of SVR with fuzzy decision that contrast to before only via opening quotation to regard as frame of prediction the whole stock price have obvious improve. That is, after pass through this period using SVR for prediction of stock price and calculate Williams index, KD index, BIAS, RSI Index and MACD Index, and furthermore combine with Fuzzy theory to execute approximate inference to find optimum investitive decision, and according to execute to deal with buy, sell or unhandled for the investor understand this trend. Finally, investitive decision software is implemented with .net environment.
ACKNOWLEDGEMENTS
The authors wish to thank that this work was supported by National Science Council Under Grant NSC 96-2221-E-150-070-MY3.
REFERENCES
[1] M. A. Hearst, "Support vector machines," IEEE
Intelligent Systems, Vol. 13, No. 4, pp.18~28, 1998.
[2] V. Cherkassky and F. Mulier, Learning from
Data: Concepts Theory and Methods, New York: Wiley-Interscience, 1998.
[3] W. Brock, L.J. Josef, and B. Lebaron, "Simple
technical trading rules and the stochastic properties of stock returns," Journal of Finance, Vol. XLVII, No. 5, 1731-1764,1992.
[4] M. Pontil and A. Verri, "Support vector
machines for 3D object recognition," IEEE Trans. On PAMI, Vol. 20, No. 6, pp. 637-646, 1998.
[5] T. Joachims, "Text categorization with support
vector machines," In Proceedings Of European Conference on Machine Learning (ECML), 1998.
[6] H. Drucker, C.J.C. Burges, L. Kaufman, A.
Smola and V. Vapnik, "Support vector regression machines," In. M.C. Mozer, M.I. Jordan, and T. petsche, editors, Advances in Neural Information Processing Systems, Vol. 9, MIT press, Cambridge, MA, pp. 155-161, 1997.
[7] V.N. Vapnik, The Nature of Statistical Learning
Theory, Springer, New York, 1995.
[8] B. Schkopf, C. Burges and V. Vapnik,
"Extracting support data for a given task," In First International Conference on Knowledge Discovery & Data Mining, Menlo Park, pp. 252-257, 1995.
[9] John J. Murphy "Technical Analysis of the
Financial Markets," Prentice Hall Press, 1999.
[10] G. Klir and B. Yuan "Fuzzy Sets and Fuzzy
Logic Theory and Application," Pearson Education Taiwan Ltd, 2002.
[11] S.W. Yu and C.H. Kuo "The application of
genetic algorithm and fuzzy theory to investment strategies of Taiwan stock index futures," Chinese Management Review, Vol. 7, No. 2, pp. 136~148, April 2004.
[12] http://www.csie.ntu.edu.tw/~cjlin/libsvm/index