Value Partners Center for Investing Newsletter - Profitability of the Value Investing Strategy in the Hong Kong Stock Market
7
0
0
全文
(2) Profitability of the Value Investing Strategy in the Hong Kong Stock Market. Introduction The value investing strategy is practiced widely in the U.S. market, and has been proven successful time and again by prominent investors such as Warren Buffet. Asian investors would like to know if we can also benefit from this strategy. This paper studies the extent to which the value investing strategy can generate excess return for those investing in stocks listed on the Hong Kong stock market. We find that value investing can provide investors with promising future returns based on our quantitative criteria for value stocks. In particular, portfolios consisted of stocks in the top 20th percentile based on our value measurements consistently outperformed the Hang Seng Index in the past 22 years.. Data Sample and Methodology In this paper, we report the detailed profitability and performance of the value investing strategy for stocks traded on the Hong Kong Stock Exchange. Our source for the monthly prices, total return index and market value of each stock is Datastream; and that for total assets, total liability, net income, depreciation, total number of shares outstanding, earnings per share is Worldscope. Exchange traded funds (ETFs) and warrants are excluded in our study. Our data sample also omits the bottom one-third of stocks based on their market value. This way, any penny stocks filed for bankruptcy will be eliminated each month. Our portfolio focuses on the period between January 1990 and December 2011 because the availability of accounting variables prior to 1990 was very limited and twenty-two years is a reasonably long time period. We also test the value investing strategy separately for alternative time periods from January 2000 to December 2011 and from January 2005 to December 2011. The value of stocks is measured by many metrics; in this study we have chosen the most popular one in the industry, which is the book-to-market ratio (BM) of individual stocks. The book value of a stock is total asset minus total liability. We calculate the equalweighted return of a portfolio by using the simple average of all stocks’ returns in the portfolio and the value-weighted return of a portfolio by weighing each stock’s return based on its market capitalization. The book-to-market ratio (BM) is the book value divided by a stock’s total market capitalization. At the end of each month, we sort the data sample into five portfolios based on the stocks’ value in that month. We then calculate the forward-looking one month return of each portfolio. We take the equal- and value-weighted returns of each portfolio and then minus this return from the Hang Seng Index (HSI) return. The difference in return is the outperformance of each portfolio against the HSI, namely excess return in table 1.. . Page 3.
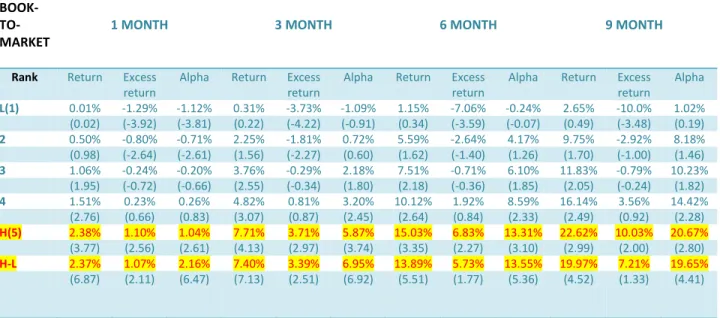
(3) Based on this methodology, the portfolios are rebalanced monthly according to the stocks’ value in the 22 years.. The value investing strategy outperforms Based on our screening method and measurement metrics, we find that the portfolio with the highest value outperformed the HSI by more than 1.10% a month over the last 22 years, and the value-weighted portfolio with the highest value also outperformed the HSI in this period. Besides, in the same period these equal-weighted portfolios generated 1.04% monthly abnormal excess return (alpha) under the CAPM model. The high value portfolio (H) also significantly outperformed the portfolio (L) of the lowest value by our measurements. The zero-cost portfolio (H-L) that longs the high value portfolio and shorts the low value portfolio generated over 2.37% a month in the past 22 years.. Table 1: VALUE INVESTING STRATEGY – Portfolio formation period January 1990 to December 2011 BOOK‐ TO‐ MARKET . 1 MONTH . 3 MONTH . 6 MONTH . 9 MONTH . Rank L(1) 2 3 4 H(5) H‐L . Return 0.01% (0.02) 0.50% (0.98) 1.06% (1.95) 1.51% (2.76) 2.38% (3.77) 2.37% (6.87) . Excess return ‐1.29% (‐3.92) ‐0.80% (‐2.64) ‐0.24% (‐0.72) 0.23% (0.66) 1.10% (2.56) 1.07% (2.11) . Alpha . Return . ‐1.12% (‐3.81) ‐0.71% (‐2.61) ‐0.20% (‐0.66) 0.26% (0.83) 1.04% (2.61) 2.16% (6.47) . 0.31% (0.22) 2.25% (1.56) 3.76% (2.55) 4.82% (3.07) 7.71% (4.13) 7.40% (7.13) . Excess return ‐3.73% (‐4.22) ‐1.81% (‐2.27) ‐0.29% (‐0.34) 0.81% (0.87) 3.71% (2.97) 3.39% (2.51) . Alpha . Return . ‐1.09% (‐0.91) 0.72% (0.60) 2.18% (1.80) 3.20% (2.45) 5.87% (3.74) 6.95% (6.92) . 1.15% (0.34) 5.59% (1.62) 7.51% (2.18) 10.12% (2.64) 15.03% (3.35) 13.89% (5.51) . Excess return ‐7.06% (‐3.59) ‐2.64% (‐1.40) ‐0.71% (‐0.36) 1.92% (0.84) 6.83% (2.27) 5.73% (1.77) . Alpha . Return . ‐0.24% (‐0.07) 4.17% (1.26) 6.10% (1.85) 8.59% (2.33) 13.31% (3.10) 13.55% (5.36) . 2.65% (0.49) 9.75% (1.70) 11.83% (2.05) 16.14% (2.49) 22.62% (2.99) 19.97% (4.52) . Excess return ‐10.0% (‐3.48) ‐2.92% (‐1.00) ‐0.79% (‐0.24) 3.56% (0.92) 10.03% (2.00) 7.21% (1.33) . Alpha 1.02% (0.19) 8.18% (1.46) 10.23% (1.82) 14.42% (2.28) 20.67% (2.80) 19.65% (4.41) . Adjusted t-statistic is in the parenthesis. . Page 4.
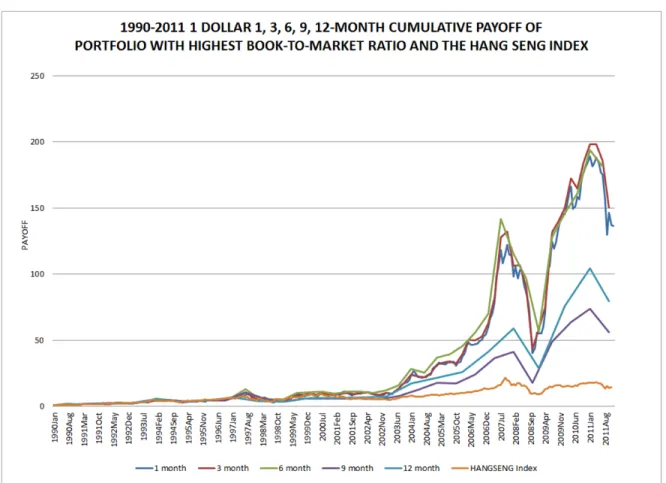
(4) The same results apply to alternative sample periods, i.e. from January 2000 to December 2011 and from January 2005 to December 2011. Actually, the portfolios with the highest value outperformed the market more in the more recent periods, namely the past 12 and 7 years. The results are similar when we perform the study with a data sample that screens out the bottom 50% of stocks based on the stocks’ market capitalization at the end of each month. It is worth to note that monthly portfolio rebalancing involves transaction costs, but the maximum costs for churning all stocks in a portfolio are only 0.75% per month in Hong Kong. Even if we completely turn over each portfolio on monthly basis the value investing strategy could still outperform. In reality, the turnover of a portfolio will be much lower than 100% because the book value of these value stocks does not change frequently and their prices in general do not crash in a single month. We can also rebalance the portfolio with longer periods such as 3, 6 and 9 months, in which case, transaction costs can be significantly reduced. As shown in table 1, we also find that the equal-weighted portfolio with the highest BM could generate significant outperformance against the HSI and significant alpha in the CAPM model for the period from January 1990 to December 2011. As the total return index for the HSI started in January 1990, we compare the performance of the value investing strategy and the HSI from February 1990. If we use the total market return index in Datastream, we can start the portfolio formation from January 1975 and still find strong outperformance and alpha against the total market return.. Active management does matter In figure 1, we look at the cumulative payoff in dollar terms when we invest $1 in the portfolios with the highest value of stock value with 1-, 3-, 6-, 9- and 12-month portfolio rebalancing, and we compare this with one dollar’s investment in the HSI. We find that $1 invested in the highest BM portfolio could generate $136.6 in a 22-year period with monthly rebalancing portfolio strategy and $150.24 and $144.7 with 3-month and 6-month rebalancing strategy while the HSI could only generate $14.5. This means that the value investing strategy rewarded investors with returns 9 times more than the HSI. It is interesting to note that the 9-month and 12-month portfolio rebalancing strategies could only generate $56.4 and $79.5 for $1 invested and rewarded investors with returns only a little more than 4 times compared with the HSI. This means that portfolio holding periods longer than 6 months may not be optimal for investors to maximize the benefit of value investing. During the global financial crisis, such value investing strategy recorded a drop of about 68% and underperformed the HSI which dropped 52% from October 2007 to October 2008. However, the value investing strategy rebounded and rewarded investors with 11.6% return from the market peak on October 2007 to December 31, 2011 while the HSI lost 33% in the same period.. . Page 5.
(5) Figure 1. $1 Cumulative Payoff invested in the Hang Seng Index and Portfolios with Highest Value of Stocks with 1, 3, 6, 9, 12-month Portfolio Rebalancing in Hong Kong Market.. Conclusion We believe investors focusing on Hong Kong-listed stocks do benefit from the value investing strategy, which is proven in our study that it consistently outperformed the Hang Seng Index in the past 6, 11, and 22 years by at least 1.10% a month from January 1990 to December 2011. The equal-weighted portfolios invested in the top 20th percentile of stocks based on their book-to-market value rewarded investors with returns 9 times more than the Hang Seng Index in the past 22 years. It is also shown that active management of a portfolio is value-adding and generates higher return. In our case, the 1- and 6-month rebalancing strategies offer much better return than the 9- and 12-month rebalancing strategies.. . Page 6.
(6) About Value Partners Center for Investing (http://vpcenter.ust.hk/) The Value Partners Center for Investing, of The Hong Kong University of Science and Technology Business School, is the academic and intellectual center for supporting research and training on investing with emphasis on China and Hong Kong financial markets, and to promote Hong Kong's role as the regional asset management center. This center is sponsored by Value Partners Group Limited. About Value Partners Group Limited (www.valuepartnersgroup.com.hk) Value Partners is one of Asia’s largest asset management firms. Since the establishment in 1993, Value Partners has been a dedicated value investor with a focus on the Greater China region. The Group manages absolute return long-biased funds, long-short hedge funds, exchange-traded funds, quantitative funds, and private equity funds for institutional and individual clients in Asia Pacific, Europe and the United States.. . Page 7.
(7) Contact of author Dr. Samuel Xin Liang Associate Director Value Partners Center for Investing Tel: +852 2358 8204 Mobile: +852 6880 3831 Fax: 2358 1749 Email: [email protected]. Supporting Research Team : Ms. Cheuk, Man Yin Mr. Lee, Clarence Ms. Zhao, Mei.
(8)
數據
相關文件
To enable the research team to gain a more in- depth understanding of the operation of the Scheme, 40 interviews were conducted, including 32 in eight case study
(1) principle of legality - everything must be done according to law (2) separation of powers - disputes as to legality of law (made by legislature) and government acts (by
More than 90% of the leaders reported that the Panel Chair was also expected to ensure that all teachers followed curriculum guidelines, and to review evidence of teaching
An electronic textbook is a comprehensive and self-contained curriculum package with digital print-on demand contents and electronic features (e-features include multimedia
To ensure that Hong Kong students can have experiences in specific essential contents for learning (such as an understanding of Chinese history and culture, the development of Hong
The individual will increase the level of education consumption because the subsidy will raise his private value by the size of external benefit, and because of
The new academic structure for senior secondary education and higher education - Action plan for investing in the future of Hong Kong.. Hong Kong: Education and
Education blueprint for the 21st century: Learning for life, learning through life: Reform proposals for the education system in Hong Kong. Hong
