Temperature-dependent optical constants and birefringence of nematic liquid crystal
5CB in the terahertz frequency range
Ru-Pin Pan, Cho-Fan Hsieh, Ci-Ling Pan, and Chao-Yuan Chen
Citation: Journal of Applied Physics 103, 093523 (2008); doi: 10.1063/1.2913347 View online: http://dx.doi.org/10.1063/1.2913347
View Table of Contents: http://scitation.aip.org/content/aip/journal/jap/103/9?ver=pdfcov Published by the AIP Publishing
Articles you may be interested in
Terahertz optical constants of ytterbium-doped yttrium aluminum garnet crystals J. Appl. Phys. 99, 093110 (2006); 10.1063/1.2195891
Calculation of the birefringences of nematic liquid crystals at optical and infrared wavelengths J. Chem. Phys. 123, 134904 (2005); 10.1063/1.2035083
High-efficiency optical transfer of torque to a nematic liquid crystal droplet Appl. Phys. Lett. 82, 4657 (2003); 10.1063/1.1588366
Wide nematic range alkenyl diphenyldiacetylene liquid crystals Appl. Phys. Lett. 77, 957 (2000); 10.1063/1.1288600
High birefringence and wide nematic range bis-tolane liquid crystals Appl. Phys. Lett. 74, 344 (1999); 10.1063/1.123066
Temperature-dependent optical constants and birefringence of nematic
liquid crystal 5CB in the terahertz frequency range
Ru-Pin Pan,1,a兲 Cho-Fan Hsieh,1Ci-Ling Pan,2and Chao-Yuan Chen2 1
Department of Electrophysics, National Chiao Tung University, 1001 Ta Hsueh Road, Hsinchu, Taiwan 30010
2
Institute of Electro-optical Engineering and Department of Photonics, National Chiao Tung University, 1001 Ta Hsueh Road, Hsinchu, Taiwan 30010
共Received 11 October 2007; accepted 2 March 2008; published online 8 May 2008兲
We have measured the frequency dependence and temperature dependence of the optical constants of a liquid crystal 4
⬘
-n-pentyl-4-cyanobiphenyl共5CB兲 in both nematic and isotropic phases by using terahertz time-domain spectroscopy. The extinction coefficient of 5CB is less than 0.02 and without sharp absorption features in the frequency range of 0.2–1.0 THz. The extraordinary and ordinary indices of refraction at 25 ° C are around 1.77 and 1.58, respectively, giving rise to a birefringence of 0.20⫾0.02 in this frequency range. The temperature-dependent order parameter extracted from birefringence agrees with the results from the visible region quite well. © 2008 American Instituteof Physics.关DOI:10.1063/1.2913347兴
I. INTRODUCTION
Knowledge of the frequency dependence, temperature dependence, and the magnitude of the extraordinary and or-dinary refractive indices, neand no, as well as the
birefrin-gence 共⌬n=ne− no兲 of liquid crystals 共LCs兲, is crucial for
both fundamental understanding and practical applications of LCs. Many groups have investigated the birefringence of LCs in the visible.1–5 In the infrared, the refractive indices and other optical properties of some LCs have also been reported.6–9 In the millimeter wave range, Lim et al.10 showed that many LCs have comparatively large birefrin-gence with approximate values in the range of 0.1–0.18 at 30 GHz. Further, the birefringence of these LCs varied only slightly in the 15–94 GHz range. Based on this, LC-based waveguidelike or microstriplike phase shifters in millimeter wave regions have been demonstrated.10–12
In the far-infrared共submillimeter wave兲 or terahertz fre-quency range, the absorption spectra 共6–200 cm−1兲 of typical LC compounds N-
共p-methoxybenzylidene兲-p-n-butylaniline 共MBBA兲 and 4,4
⬘
-azoxydianisole 共PAA兲 were studied over two decades ago.13,14More recently, the refrac-tive indices and transmission losses for some nematic LCs, including 4⬘
-n-pentyl-4-cyanobiphenyl 共5CB兲, were mea-sured by Nose et al.15 at three discrete wavelengths 共118, 215, and 435 m兲. The refractive indices of 5CB for ordi-nary 共no兲 and extraordinary rays 共ne兲 in the submillimeterwave region were found to be slightly larger than those in the visible range. By employing terahertz time-domain spectros-copy 共TDS兲,16 we have shown that the terahertz 共0.2–1.0 THz兲 birefringence of 5CB is in the range of 0.15–0.21, while that of trans-4
⬘
-Pentylcyclohexyl-benzonitrile共PCH5兲 is from 0.01 to 0.08 at room temperature.17–19 About the same values of birefringence were reported in the LC mix-ture, E7 共by Merck兲20 and a LC polymer.21 High-frequency dielectric relaxation of LCs was revealed through a terahertztime-domain spectroscopic studies of LC colloids.22 Strong terahertz dichroism of MBBA on rubbed substrate was observed.23The isotropic liquid, LC and crystal phases of the bent-core LC P-8-PIMB were found to be clearly distin-guished by their terahertz spectra.24
Here, we report our improved and more accurate mea-surements of the complex optical constants of 5CB at 25 ° C. Our previous data show a slow and monotonic increasing trend with frequency for both neand noin the 0.3–0.8 THz
range. Specifically, neincreases from 1.7 to 1.96, while no
varies from 1.55 to 1.75. This is unexpected and its origin is identified in this work. We confirm that the complex optical constants of 5CB do not exhibit appreciable frequency de-pendence from 0.2 to 1.0 THz. The temperature dede-pendence of the complex optical constant of 5CB and the order param-eter of 5CB in the far infrared are also reported.
II. EXPERIMENTAL METHODS
Two types of cells, a reference cell and a homogeneously aligned LC cell, were prepared in this work. These are sche-matically shown in Fig.1. The reference cell was constructed by two fused silica windows with nominal thickness of 3.0 mm each and in contact with each other. For the LC cell, a nematic LC layer 共5CB, Merck兲 was sandwiched between two fused silica windows as substrates. The thickness of the LC layer was controlled with the Mylar spacers and
mea-a兲Electronic mail: rpchao@mail.nctu.edu.tw. FIG. 1. Sketches ofare fused silica and the alignment of LC cell is homogeneous.共a兲 the reference cell and 共b兲 the LC cell. The substrates
0021-8979/2008/103共9兲/093523/7/$23.00 103, 093523-1 © 2008 American Institute of Physics [This article is copyrighted as indicated in the article. Reuse of AIP content is subject to the terms at: http://scitation.aip.org/termsconditions. Downloaded to ] IP:
sured by subtracting the substrates thicknesses from the total cell thickness. The LC layer thickness in this work is 260⫾3 m unless otherwise noted. Homogeneous align-ment was achieved by coating polyimide on inner surfaces of the substrates followed by mechanical rubbing.25 The mea-sured pretilt angle was about 2°.26The temperature of the LC cell can be varied and controlled to 0.05 ° C. The substrates were chosen such that the total thicknesses of the two sub-strates for these two cells are equal with an accuracy of 2 m.
An antenna-based terahertz-TDS system with a colli-mated beam at the sample position27 had been used. A sche-matic of the terahertz-TDS system is shown in Fig.2. Tera-hertz pulses, generated by femtosecond-laser-excited dipolelike antenna fabricated on low-temperature-grown GaAs, were collimated by an off-axis paraboloidal mirror and propagated through the sample at normally incidence. A pair of parallel wire-grid polarizers, before and after the sample, was employed in order to ensure the polarization state of the terahertz wave. The terahertz fields of e ray and
o ray are parallel and perpendicular to the aligned direction
of LC cell, respectively. The transmitted terahertz pulses were focused on another dipolelike antenna gated by time-delayed probe pulses and oriented to detect terahertz waves polarized parallel to the incident terahertz wave polarization. The beam size of the terahertz wave through the sample is about 0.8 cm in diameter.
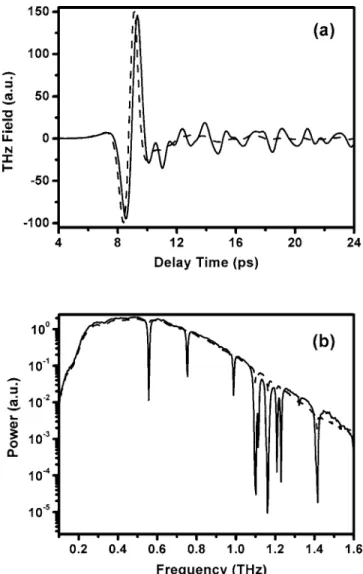
There are several absorption lines of water vapor in the frequency range of 0.2–1.5 THz.28 Our terahertz time-domain spectrometer can be purged with nitrogen and main-tained at a relative humidity of 共3.0⫾0.5兲%. The terahertz time-domain signals and the frequency spectra before and after purging are shown in Figs.3共a兲and3共b兲, respectively.
III. DETERMINATION OF OPTICAL CONSTANTS We assume that the terahertz signal is a plane wave pass-ing through the cell at normal incidence. The electric field of the terahertz wave transmitted through the reference cell at an angular frequencycan then be written as
Eref共兲 = E0共兲共兲Pair共,d兲, 共1兲 where E0共兲 is the electric field of the incident terahertz wave. The parameter 共兲 takes into account the Fabry– Pérot effect due to the Fresnel reflection of the terahertz wave at the quartz-air interfaces and its propagation in fused silica. The propagation coefficient in air over a distance d is denoted by Pair共, d兲=exp关共−in˜aird兲/c兴, where n˜air is the complex refractive index of air and the value of 1 is assumed in this work. The length d is chosen to be the same as that of the LC layer 共see Fig.1兲. Similarly, the electric field of the terahertz wave transmitted through the LC cell can be written as
ELC共兲 = E0共兲共兲Tq−LC共兲PLC共,d兲
⫻TLC−q共兲FPLC共,d兲, 共2兲
where Tq−LC共兲=共2n˜q兲/共n˜q+ n˜LC兲 and TLC−q共兲 =共2n˜LC兲/共n˜LC+ n˜q兲 are the transmission coefficients of the
quartz-LC and LC-quartz interfaces, respectively;PLC共, d兲 = exp关共−in˜LCd兲/c兴 and FPLC共, d兲 are the propagation and Fabry–Pérot coefficients in the LC layer with a thickness of FIG. 2. Schematic of the terahertz-TDS. PBS: polarization beam splitter. P
and A: terahertz polarizer and analyzer, respectively.
FIG. 3.共a兲 Temporal profiles of the terahertz signals before 共solid line兲 and after 共dash line兲 purging. 共b兲 The power spectra of the terahertz signals before共solid line兲 and after 共dash line兲 purging. Several absorption lines of water vapor appear before purging. The relative humidities before and after purging are 53% and 3%, respectively.
093523-2 Pan et al. J. Appl. Phys. 103, 093523共2008兲
d, respectively. The coefficient 共兲 for the LC cell is the
same as that for the reference cell because of the thicknesses of the fused silica windows used are the same 共tolerance ⬍2 m兲. The complex transmittance T共兲 of the LC layer can then be obtained by dividing ELC共兲 by Eref共兲
T共兲 = 4n˜LC˜nq
共n˜LC+ n˜q兲2
exp
冋
− i共n˜LC− n˜air兲 dc
册
FPLC共,d兲,共3兲 where n˜q is the complex refractive index of fused silica and n
˜LC is either the ordinary index 共n˜o= no− io兲 or
extraordi-nary index共n˜e= ne− ie兲 of the LC layer.
For optically thick samples, the echoes of terahertz waves from the multiple reflections of the sample are tem-porally well separated from the main signal. These can be easily removed without affecting the accuracies of the mea-surements. Thus, we can set FPLC共, d兲=1 in Eq. 共3兲.29 On the other hand, if the sample is optically thin, the Fabry– Pérot effect need be considered. Instead of solving T共兲 − Tmeas共兲=0, in which T共兲 and Tmeas共兲 are the calculated and measured complex transmission coefficients, respec-tively, the Newton–Raphson method was used for extracting the optical constants.30We define an error function
␦共n,兲 =␦2+␦2, where
␦= ln关兩T共兲兩兴 − ln关兩Tmeas共兲兩兴, 共4a兲 ␦= arg关T共兲兴 − arg关Tmeas共兲兴, 共4b兲 where T共兲 and Tmeas共兲 are the calculated, i.e., 关Eq. 共3兲兴 and experimentally measured complex transmission coeffi-cients, respectively. As defined above, the error function
␦共n,兲 can be easily calculated with a given trial set of 共n,兲. Approximate values of n andwere obtained by set-ting FP共兲=1. In Eq. 共3兲 and then this set was used as the initial trial values. After minimizing this error function with respect to共n,兲, the optical constants n andare determined for any angular frequency.
IV. RESULTS AND DISCUSSIONS A. Complex optical constants
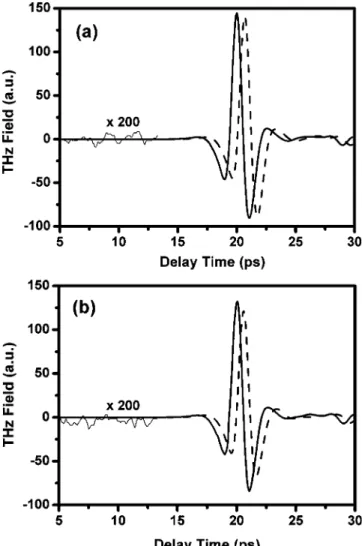
Figure4shows an example of the measured time domain signals of terahertz waves that pass through the reference cell and LC cell at 25 ° C for e ray and o ray. The time delay of signal passing through the LC cell with respect to that of the reference signal is evident. A relatively small signal, which is the reflection of terahertz wave from the quartz-LC interface, following the main terahertz pulse and about 10 ps behind is also observable. The main 共first兲 terahertz signal becomes zero before this reflective signal arrives. In the following analysis, we have thus cut off the time-domain signal right before this reflective signal. The amplitude and the phase spectra of the terahertz wave passing through the LC cell and reference cell are obtained by applying a fast Fourier
trans-form共FFT兲 to the time-domain waveforms. The optical con-stants of the LC are then determined using the procedure described in the previous section.
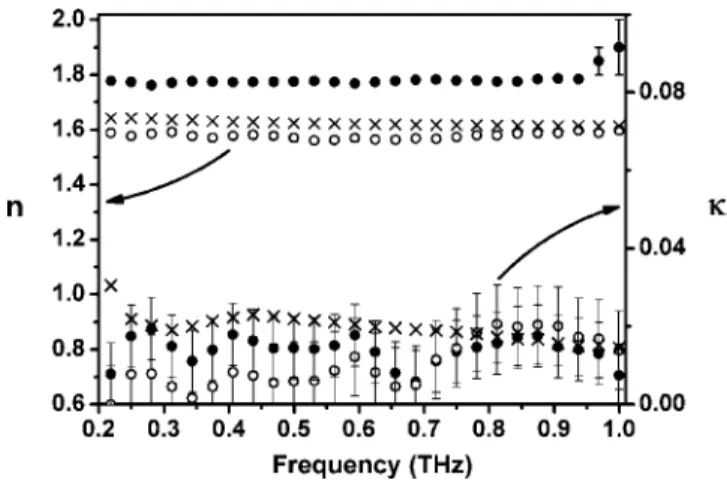
The real part and imaginary part of the optical constants of 5CB at 25 ° C are shown as a function of frequency in Fig. 5. The filled circles and the open circles are the extraordinary and ordinary indices, ne, no, respectively. The real parts of
the indices show clear anisotropy, with ne= 1.77 and no
= 1.58, giving rise to a birefringence of 0.20⫾0.02. We note that ne= 1.706 and no= 1.529 in the visible.31The imaginary
part of the refractive index of 5CB is smaller than 0.02 in the frequency range from 0.2 to 1.0 THz. It does not exhibit appreciable anisotropy.
It could be argued that the LC layer, 260 m in thick-ness, is relatively thin compared to the wavelength of tera-hertz waves, consequently affecting the accuracies of the ex-tracted optical constants. To check, we also measured the optical constants of a thicker LC layer with a thickness of 2.0 mm. This experiment was carried out at 38 ° C where 5CB is in its isotropic phase. The data points are also shown in Fig. 5as crosses. As expected, the real indices of 5CB in isotropic phase fall between neand noand are given approximately by
⬃共2no+ ne兲/3.32 The imaginary indices of 5CB in isotropic
FIG. 4. Transmitted terahertz signals through the reference共solid line兲 and LC cells共dashed line兲 for 共a兲 e ray and 共b兲 o ray at 25 °C. The noise, magnified by two hundred times, is also shown as the thin solid lines.
phase, on the other hand, is⬃0.02. No absorption features are observed in this frequency range. The above experiments confirm the reliability of our data.
B. Temperature dependence
The temperature dependence of the real indices of 5CB at frequencies of 0.344, 0.500, 0.656, and 0.750 THz are shown in Fig.6. The filled and open circles are experimental data for neand no, respectively. Following Brugioni et al.,33
we fit the temperature dependence of the real part of the refractive indices with
n = A⫻ 共B − TR兲C, 共5兲
where n is the refractive index and TR is the reduced
tem-perature defined as the difference between measured sample temperature and measured clearing point 共T-Tc兲. The fitting
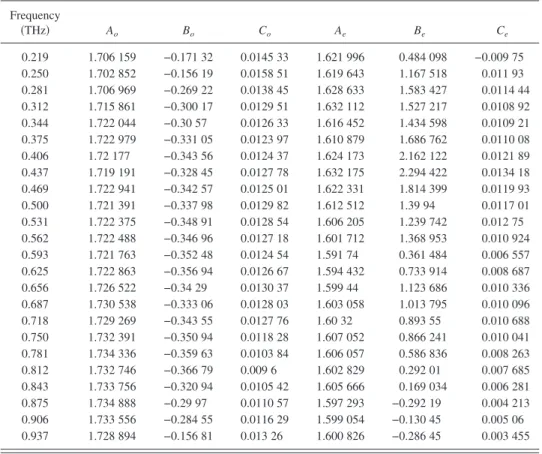
parameters A, B, and C thus obtained are shown in Table I. The fitting curves are also shown in Fig.6as the dotted line with the measured data. Above the transition temperature, i.e., in isotropic phase, the experimental points are shown in Fig.6with stars. Below the transition temperature, the solid lines show the average indices 共2no+ ne兲/3 from the fitting
results.
C. Birefringence and order parameter
The temperature-dependent birefringence of 5CB at the frequencies of 0.344, 0.500, 0.656, and 0.750 THz are plot-ted in Fig.7, in which the solid curves are the fitting results by using
⌬n共T兲 = D
冉
1 −ETTC
冊
F,
where D, E, and F are the fitting parameters. The order pa-rameter of 5CB can be extracted from the fitting papa-rameters as
S =
冉
1 −ETTC
冊
F.
We find that E = 0.985⫾0.01 and F=0.21⫾0.02. This agrees well with the order parameter of 5CB measured in the vis-ible, where E = 0.98 and F = 0.22.34Since the order parameter is not expected to change, we conclude that the birefringence we measured in the terahertz range is reasonable and reliable. FIG. 5. The optical constants of 5CB, n and, are plotted as functions of
frequency. The solid circles and the open circles are the extraordinary and ordinary indices at 25 ° C, respectively. The crosses are the values of optical constants of 5CB in the isotropic phase at 38 ° C. Error bars are indicated, unless they are smaller than the sizes of the symbols.
FIG. 6. Extraordinary and ordinary re-fractive indices of 5CB are plotted as functions of reduced temperature at frequencies of 0.344, 0.500, 0.656, and 0.750 THz. The solid and the open circles represent ne and no, respec-tively. The stars are data for the refrac-tive index of 5CB in the isotropic phase. The solid lines are the average index,共2no+ ne兲/3 at temperatures be-low Tc.
093523-4 Pan et al. J. Appl. Phys. 103, 093523共2008兲
D. Comparison to previous results
The refractive indices of 5CB in the terahertz frequency range were previously reported by the authors.17–19 We showed a slow and monotonic increasing trend with
fre-quency for both neand noin the 0.3–0.8 THz range.
Specifi-cally, ne was found to increase from 1.7 to 1.96, while no
varied from 1.55 to 1.75. Here, we present more accurate results, i.e., ne= 1.77 and no= 1.58 at 25 ° C giving rise to a
TABLE I. The fitting parameters of Eq.共5兲for frequencies from 0.219 to 0.937 THz.共Ao, Bo, Co兲 and 共Ae, Be,
Ce兲 are for noand ne, respectively. Frequency 共THz兲 Ao Bo Co Ae Be Ce 0.219 1.706 159 −0.171 32 0.0145 33 1.621 996 0.484 098 −0.009 75 0.250 1.702 852 −0.156 19 0.0158 51 1.619 643 1.167 518 0.011 93 0.281 1.706 969 −0.269 22 0.0138 45 1.628 633 1.583 427 0.0114 44 0.312 1.715 861 −0.300 17 0.0129 51 1.632 112 1.527 217 0.0108 92 0.344 1.722 044 −0.30 57 0.0126 33 1.616 452 1.434 598 0.0109 21 0.375 1.722 979 −0.331 05 0.0123 97 1.610 879 1.686 762 0.0110 08 0.406 1.72 177 −0.343 56 0.0124 37 1.624 173 2.162 122 0.0121 89 0.437 1.719 191 −0.328 45 0.0127 78 1.632 175 2.294 422 0.0134 18 0.469 1.722 941 −0.342 57 0.0125 01 1.622 331 1.814 399 0.0119 93 0.500 1.721 391 −0.337 98 0.0129 82 1.612 512 1.39 94 0.0117 01 0.531 1.722 375 −0.348 91 0.0128 54 1.606 205 1.239 742 0.012 75 0.562 1.722 488 −0.346 96 0.0127 18 1.601 712 1.368 953 0.010 924 0.593 1.721 763 −0.352 48 0.0124 54 1.591 74 0.361 484 0.006 557 0.625 1.722 863 −0.356 94 0.0126 67 1.594 432 0.733 914 0.008 687 0.656 1.726 522 −0.34 29 0.0130 37 1.599 44 1.123 686 0.010 336 0.687 1.730 538 −0.333 06 0.0128 03 1.603 058 1.013 795 0.010 096 0.718 1.729 269 −0.343 55 0.0127 76 1.60 32 0.893 55 0.010 688 0.750 1.732 391 −0.350 94 0.0118 28 1.607 052 0.866 241 0.010 041 0.781 1.734 336 −0.359 63 0.0103 84 1.606 057 0.586 836 0.008 263 0.812 1.732 746 −0.366 79 0.009 6 1.602 829 0.292 01 0.007 685 0.843 1.733 756 −0.320 94 0.0105 42 1.605 666 0.169 034 0.006 281 0.875 1.734 888 −0.29 97 0.0110 57 1.597 293 −0.292 19 0.004 213 0.906 1.733 556 −0.284 55 0.0116 29 1.599 054 −0.130 45 0.005 06 0.937 1.728 894 −0.156 81 0.013 26 1.600 826 −0.286 45 0.003 455
FIG. 7. Birefringence of 5CB mea-sured at 0.344, 0.500, 0.656, and 0.750 THz are plotted as a function of re-duced temperature. The curves are the fitting results.
birefringence of 0.20⫾0.02 in the same frequency range. The plausible sources of discrepancies are discussed here.
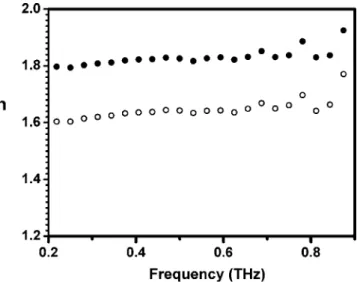
To illustrate, the two sets of data on real part of the refractive indices for 5CB at 25 ° C are reproduced in Fig.8. The discrepancy can be explained by artifacts introduced by experimental geometry and procedures. First of all, the tera-hertz beam is collimated in the present setup, as opposed to placement of the LC cell at the beam focus in our earlier work. The beam curvature must be taken into account for the focused beam in the Fabry–Pérot factor of Eq. 共3兲. Previ-ously, Duvillaret et al.35pointed out that an approximate cal-culation could lead to an erroneous trend in rising indices of refraction with frequency, if the Fabry–Pérot factor did not properly take into account. Second, we now purge the tera-hertz spectrometer with dry nitrogen. Note that we have set the complex refractive index of air n˜air to be one in our analysis. This is an approximation that requires correction in the presence of moist air. The effect of water vapor absorption28 in the beam path also manifests itself in the temporal terahertz waveform as oscillations after the main signal关see Fig.3共a兲兴. This is compounded by reflective sig-nals from the quartz-LC interfaces. These reflective sigsig-nals appear about 10 ps after the main signal, while their fluctu-ating tails due to water vapor absorption last for another 25 ps afterward. In treating the LC sample as optically thick, one needs to remove the above reflective signals. Arbitrarily removing the undesirable peaks too close to the main peak could cut off part of the signal and render the deduced tera-hertz optical constants less accurate. These difficulties can be circumvented by employing substrates as thick as possible and purging the terahertz-TDS. To check, we have also con-ducted another set of measurements with the collimated beam geometry and room air 共without purging兲. The results are shown in Fig.9. A rising trend can still be discerned. E. Error analysis
The accuracy of the measured indices has been checked by examining all the possible error sources. In our case, these
include system fluctuation, calculation model, the accuracy of the thickness of the LC layer, aligned quality of the LC and the accuracy of the index of the substrates, and so on. We will discuss these one by one.
In order to check the system fluctuation and stability, we did several tests, e.g., the repeatability of the temporal sig-nals, which include the phase and power spectra after apply-ing FFT to it. We also measured the optical constants of well known material such as fused silica in this frequency range. For the repeatability test, we measured the temporal signals several times at a time interval of 5 min. The time-domain signals were repeatable to within ⬍0.01 ps of each other. We also compared the phase and power spectra of the signals to each other. The ratios of the power spectra of the 2 THz signals recorded at different time need to be nearly one 共⬎0.98兲. The phase fluctuation, attributed mainly to the laser noise or the instability of the optic components, was less than 5°. This is only about 1% of the predicted phase shift due to the 260-m-thick LC cell. The measured frequency-dependent index of the 3-mm-thick fused silica substrates at room temperature is 1.951 without dispersion and absorption in the range of 0.2–1.5 THz, in good agreement with the data from literature.36
It is expected that the thickness of the LC layer, the alignment quality of LC cell and the purity of LC will all affect the accuracy of the extracted optical constants. In prin-ciple, the thicker the layer is, the more accurate the results are. However, the LC layer thickness is limited by the re-quirement of stable LC alignment. The alignment quality of the 260-m-thick cell was checked by looking at the order parameter determined from the measured temperature-dependent birefringence at terahertz frequencies. This shows that the alignment of our cell is as good as that in a thin sample 共less than 10 m thickness兲. We did not chemically analyze the purity of the 5CB共Merck兲 we used. The clearing point of LCs, however, correlates directly to its purity. It was found to be 34 ° C in our work, consistent with what people reported for pure 5CB共34.5–35.5 °C兲.37The imaginary part FIG. 8. Extraordinary共solid triangles兲 and ordinary 共open triangles兲
refrac-tive indices for 5CB at 25 ° C reported in Ref.19are plotted together with the corresponding data 共solid and open circles兲 measured as functions of frequency.
FIG. 9. Extraordinary共solid circles兲 and ordinary 共open circles兲 refractive indices of 5CB measured by the terahertz time-domain spectrometer, not purged with dry nitrogen. The terahertz beam passed through the cell is collimated and at normal incidence.
093523-6 Pan et al. J. Appl. Phys. 103, 093523共2008兲
of the refractive index of 5CB we measured is about⬍0.02, which is relatively small. The thickness of the LC layer in the experiment is 260 m, which might not be the optimum thickness for accurate measurements. However, we can con-clude that there is no resonant absorption in this frequency range as the measured real indices are spectrally flat and smooth. In order to determine accurate imaginary indices 共extinction coefficient兲, we also measured a 2.0-mm-thick 5CB sample in isotropic phase共see Fig.5兲. Results from this thick sample also suggest that there is no sharp resonance in this frequency range and the extinction coefficient of 5CB in the isotropic phase is less than 0.02 in the frequency range of 0.2–1.0 THz.
V. CONCLUSIONS
We report the frequency dependence and the temperature dependence of the optical constants of 5CB in both nematic and isotropic phases by using terahertz-TDS. We found that the extinction coefficient of 5CB is relatively small 共⬍0.02兲 and without sharp absorption features in the fre-quency range of 0.2–1.0 THz. At 25 ° C, the extraordinary and ordinary indices of refraction of 5CB are ne= 1.77 and no= 1.58, giving rise to a birefringence of 0.20⫾0.02 in the
same frequency range. The order parameter extracted from temperature-dependent birefringence of 5CB agrees well with similar results in visible region.
ACKNOWLEDGMENTS
This work was supported in part by the PPAEU-II and Grant No. NSC 95-2221-E-009-249 from the National Sci-ence Council as well as the ATU program of the Ministry of Education of the Republic of China.
1R. Chang,Mater. Res. Bull. 7, 267共1972兲; R. Chang, Mol. Cryst. Liq.
Cryst. 30, 155共1975兲.
2R. A. Soref and M. J. Rafuse,J. Appl. Phys.43, 2029共1972兲. 3W. Haase and D. Potzsch, Mol. Cryst. Liq. Cryst. 38, 77共1977兲. 4E. G. Hanson and Y. R. Shen, Mol. Cryst. Liq. Cryst. 36, 193共1976兲. 5E. Miraldi, C. Oldano, L. Trossi, and P. T. Valabrega, Appl. Opt. 21, 4163
共1982兲.
6S. T. Wu, U. Efron, and L. V. Hess,Appl. Phys. Lett.44, 1033共1984兲. 7I. C. Khoo, R. R. Michael, and G. M. Finn,Appl. Phys. Lett.52, 2108
共1988兲.
8P. Joffre, G. Illiaquer, and J. P. Huignard, Proc. SPIE 1126, 13共1989兲. 9S. T. Wu, J. D. Margerum, H. B. Meng, C. S. Hsu, and L. R. Dalton,Appl.
Phys. Lett.64, 1204共1994兲.
10K. C. Lim, J. D. Margerum, A. M. Lackner, L. J. Miller, E. Sherman, and
W. H. Smith,Liq. Cryst.14, 327共1993兲.
11K. C. Lim, J. D. Margerum, and A. M. Lackner,Appl. Phys. Lett.62, 1065
共1993兲.
12F. Guérin, J. M. Chappe, P. Joffre, and D. Dolfi,Jpn. J. Appl. Phys., Part 1
36, 4409共1997兲.
13M. Evans, M. Davies, and I. Larkin, J. Chem. Soc., Faraday Trans. 1 69,
1011共1973兲.
14B. J. Bulkin and W. B. Lok,J. Phys. Chem.77, 326共1973兲.
15T. Nose, S. Sato, K. Mizuno, J. Bae, and T. Nozokido, Appl. Opt. 36, 6383
共1997兲.
16D. Mittleman, Sensing with Terahertz Radiation, 1st ed.共Springer, New
York, 2002兲.
17T.-R. Tsai, C.-Y. Chen, C.-L. Pan, R.-P. Pan, and X.-C. Zhang,Appl. Opt.
42, 2372共2003兲.
18R.-P. Pan, T.-R. Tsai, C.-Y. Chen, and C.-L. Pan,J. Biol. Phys.29, 335
共2003兲.
19R.-P. Pan, T.-R. Tsai, C.-Y. Chen, C.-H. Wang, and C.-L. Pan,Mol. Cryst.
Liq. Cryst.409, 137共2004兲.
20C.-Y. Chen, C.-F. Hsieh, Y.-F. Lin, R.-P. Pan, and C.-L. Pan,Opt. Express
12, 2625共2004兲.
21F. Rutz, T. Hasek, M. Koch, H. Richter, and U. Ewert,Appl. Phys. Lett.
89, 221911共2006兲.
22M. Oh-e, H. Yokoyama, M. Koeberg, E. Hendry, and M. Bonn, Opt.
Express14, 11433共2006兲.
23J. Nishizawa, T. Yamada, T. Sasaki, T. Tanabe, T. Wadayama, T. Tanno,
and K. Suto, Appl. Surf. Sci. 252, 4226共2006兲.
24Y. Takanishi, K. Ishikawa, J. Watanabe, H. Takezoe, M. Yamashita, and K.
Kawase,Phys. Rev. E71, 061701共2005兲.
25M. Nakamura,J. Appl. Phys.52, 4561共1981兲.
26T. J. Scheffer and J. Nehring,J. Appl. Phys.48, 1783共1977兲.
27C.-L. Pan, C.-F. Hsieh, R.-P. Pan, M. Tanaka, F. Miyamaru, M. Tani, and
M. Hangyo, Opt. Express 13, 30共2005兲.
28M. van Exter, Ch. Fattinger, and D. Grischkowsky, Opt. Lett. 14, 1128
共1989兲.
29E. Hecht, Optics, 3rd ed.共Addison Wesley Longman, New York, 1998兲,
Chap. 4.
30Handbook of Mathematical Functions with Formulas, Graphs, and
Math-ematical Tables, 9th ed., edited by M. Abramowitz and I. A. Stegun
共Do-ver, New York, 1972兲.
31R. G. Horn,J. Phys.共France兲39, 105共1978兲.
32S. Chandrasekhar, Liquid Crystal, 2nd ed.共Cambridge University Press,
New York, 1992兲.
33S. Brugioni, S. Faetti, and R. Meucci,Liq. Cryst.30, 927共2003兲. 34B. Bahadur, Liquid Crystals: Applications and Uses 共World Scientific,
Singapore, 1995兲, Vol. 1.
35L. Duvillaret, F. Garet, and J. Coutaz,IEEE J. Sel. Top. Quantum Electron.
2, 739共1996兲.
36D. Grischkowsky, S. R. Keiding, M. van Exter, and C. Fattinger, J. Opt.
Soc. Am. B 7, 2006共1990兲.
37I.-C. Khoo, Liquid Crystals-Physical Properties and Nonlinear Optical
Phenomena共Wiley-Interscience, New York, 1995兲.