行政院國家科學委員會專題研究計畫 成果報告
企業風險管理對於公司治理及企業社會責任之影響
研究成果報告(精簡版)
計 畫 類 別 : 個別型 計 畫 編 號 : NSC 99-2410-H-004-081- 執 行 期 間 : 99 年 08 月 01 日至 100 年 07 月 31 日 執 行 單 位 : 國立政治大學風險管理與保險學系 計 畫 主 持 人 : 陳彩稚 處 理 方 式 : 本計畫可公開查詢中 華 民 國 100 年 10 月 10 日
The Impact of Enterprise Risk Management on Corporate Governance and Firm Value
Tsai-Jyh Chen
Dept of Risk Management and Insurance National Chengchi University
Abstract
This study conducts empirical analyses of the role of ERM in a firm. This paper intends to investigate the application of risk management in public companies in Taiwan. Through the data analysis for year 2009, this paper finds that more than 50% of public firms use the term “risk management” in their annual report, which shows the popularity of the term. There are many aspects where risk management can have influence in a firm. This paper first focus on the board structure, which is one of the most important constructs of corporate governance. The empirical results in general support the hypotheses that board composition is related to the ERM strategy. The firms that emphasize risk management in their annual report show lower board independence, less leadership duality and smaller board size. Additionally, this paper analyzes the effect ERM concept on firm value. The empirical results in general show that ERM does not have a significant impact on the firm value. The findings suggest that firm value is mostly affected by the firm characteristics such as size and performance, no matter a firm concerns ERM or not.
To sum up, the empirical results based on the data of public firms in Taiwan show that the concept of ERM is still in beginning stage. Although the firms have already known and used this term “risk management” to describe their business operations, their business strategies in fact do not integrate the concept of risk management into the competitive decisions yet.
中文摘要 本研究目的在於探討「企業風險管理」(ERM)觀念在公司經營中所扮演之角色。 藉由檢視我國上市上櫃公司對於風險管理之應用,可略知目前這項觀念之實際應 用情況。根據2009 年年報資料分析顯示,目前有超過 50%上市上櫃公已經知道 並且使用「風險管理」一詞,可見此名詞已被廣泛接受。風險管理可應用於企業 經營支各個層面,本文主要是探討在公司治理上之影響。根據實證結果發現,重 視風險管理之公司(即在年報中使用「風險管理」一詞描述其經營之公司),其 董事會之獨立性較低,董事長同時兼任總經理者較少,董事會成員亦較少。大致 而言,實證分析認為董事會結構與該公司是否重視風險管理有關。此外,本研究
亦探討公司是否重視風險管理對於該公司價值之影響。實證結果發現公司價值主 要與該公司本身之特質有關(例如公司規模、經營績效等), 與該公司是否重視
風險管理觀念並無顯著關聯性。這項結果可能是因為ERM 尚是一個新觀念,雖
The Impact of Enterprise Risk Management and Corporate Governance
I. Introduction
The Sarbanes-Oxley Act (SOX) Section 404 regulations have significantly influenced the adoption of enterprise risk management (ERM). According to the SOX regulations, corporate governance and ERM are connected to each other and critical to firm performance, including firm value and risk-taking behavior. ERM emphasizes the integration of risks and the adoption of a holistic risk-based approach. As today’s business environments become more complicated and fast-changing, the micro- and macro-economic risks are frequently mingled together. The traditional silo approach cannot properly solve the issues related to risks. Firms need the ERM holistic approach to handle the mingled risks in the new business environment.
In practice the rating agencies such as Standard & Poor’s, Moody, etc, have announced considering ERM as an important factor for credit rating (Olson and Wu, 2008). The accounting organization, Committee of Sponsoring Organizations of the Treadway Commission, provided a framework of ERM (COSO, 2004) and supplemented it for internal control and auditing since 2004. Therefore, most companies have been eager to establish their ERM strategies. However, the techniques and experiences of ERM are still new and limited.
Although “risk management” has been an important topic in corporate finance, the studies usually focus on financial risk management, especially the risk of derevatives. Other aspects of corporate risks, especially the integrated risks related to business strategies have not been studied extensively yet (Paladino, Cuy, and Frigo, 2009). Frigo and Anderson (2011) regard strategic risk management processes and capabilities are important foundation for improving risk management and governance. Shank and San Miguel (2009) suggest that merging financial and managerial
accounting is important for strategic cost management and enterprise risk assessment under the SOX regulation. As the primary goal of risk management is to maximize shareholder value, Meulbroek (2002) and COSO (2004) both suggests that ERM needs a holistic strategy to manage those risks in order to establish an effective risk management strategy.
Despite increasing adoption of ERM in financial and nonfinancial firms, the actual benefits of ERM are unknown yet. From the perspective of a frictionless capital market, Modigliani-Miller irrelevance proposition (1958), risk management has no contribution to firm value since its benefits will trade off with its costs and the investors can eliminate risks through diversification. In reality capital market usually is not frictionless and risk management can have a contribution to the firm value. As indicated by Culp (2001), risk management theoretically can increase firm value either through increasing expected cash flows or reducing the cost of capital. In business practice many factors can influence firm’s risk-taking behavior and value, including managerial incentives, natural disasters, macroeconomics such as 2008 financial turmoil, and so forth. Therefore, the impact of risk management on firm value is not conclusive. It is not surprising that Beasley, Pagach, and Warr (2008) find that there is no significant relationship between stock price reaction and firms’ announcements of ERM adoption.
The purpose of this paper is to study the relationship between ERM and corporate governance quality and the consequent effect on firm value because ERM is a process that requires top-management of a firm to identify and assess the enterprise-wide risks that affect firm value. As more and more unexpected events of financial distress happened, the corporate decision-makers now must pay great attentions to ERM. Most of large firms set up an ERM committee under the board of directors or appoint a CRO (chief risk officer). Therefore, to investigate the
relationship between ERM and corporate governance is important to business practice, academic research and public policy.
There are many types of risk in the business operation. Many classifications and definitions of business risks have been found in the literature, for example, Knight (1921), Sadgrove (1996), Lam (2003), Harrington and Niehaus (2003), and COSO (2004). By integrating the previous literature related to enterprise risk management, this paper categorizes the organization-wide business risks into four groups: strategic risk, operational risk, financial risk, and hazard risk1, as mentioned by Slywotzky and Drzik (2005). For nonfinancial industries, the strategic risk and operational risk are core risks because they are related to the firm’s core business. On the other hand, financial risk and hazard risk are noncore risk because they result from the environmental factors instead of business decisions. The categorization of enterprise risks is shown in figure 2. For financial institutions such as banks and insurance companies, the management of financial risk or hazard risk is the firm’s core business; therefore, they may be categorized as core risks, together with strategic risk and operational risk.
Figure 2. Types of Business Risk
1 It is also called pure risk.
Enterprise risk
Core risk Noncore risk
Strategic risk Operational risk Financial risk Hazard/Pure risk
Market risk Credit risk Fire risk Liability risk Production Employee Competition Merger
Strategic risk arises from a firm’s inability to adapt to changes in the environment such as changes in consumer preferences, market competition and social developments. This risk is associated with the compatibility of a firm’s goals, the business strategies to achieve those goals, and the quality of implementation. Strategic risk may result from changes in market, technology, brand, competitor, and customer. For example, brand perception is subject to customers from service and product quality, and the risk of brand erosion could seriously hurt firm’s value (Alt, 2000). It is difficult to measure strategic risk due to its qualitative characteristics. However, some indicators may be applicable. For example, the management turnover rate may serve as a useful indicator to evaluate the quality of management team. The higher turnover rate implies more likely insufficient experience in management, and probably higher strategic risk. (Glassman, 2001).
Operational risk usually is related to losses from operational errors that affect the earnings of a firm. It can happen in many aspects of business operations, including systems, processes and people. Operational risk arises from issues such as succession planning, human resources, information technology, control systems and compliance with regulations. For example, the typing errors in deposit transactions are made by employees in the bank. Internal control has been increasingly emphasized and formally regulated after the Sarbanes-Oxley Act issued in 2002 since more financial failures occurred due to insufficient internal control system. There are several methodologies to quantify operational risk in dollar terms for financial institutions (Ioannis et al, 2006). However, the measurements for operational risk are not available especially for nonfinancial organizations. Recently efforts have focused on combining qualitative risk assessment results and key risk indicators (e.g., liability lawsuits) with traditional quantitative approaches to determine a probabilistic measure of operational risk.
Financial risk refers to all kinds of uncertainties in corporate finance of a firm, such as volatility in interest rates, exchange rates, asset-liability mismatch. Financial
risks generally are categorized into market risk, credit risk, and liquidity risk. Market risk is the fluctuation of asset values due to changes in interest rate, exchange rate, and commodity and equity prices. Credit risk arises from uncertainty in counterparty’s ability to pay its financial obligations. In practice counterparty's ability to perform on that obligation usually measured based on its credit quality combined with default probability and anticipated recovery rate. Many credit rating systems, such as Standard & Poor's, can provide some information related a firm’s credit risk. Liquidity risk results from unbalanced cash inflows and outflows such that a firm cannot afford the immediate payments.
Hazard risk refers to losses related to natural hazards, accidents, fire, etc, which traditionally managed through insurance. Today businesses are required to assess and disclose environmental liabilities and risks that are material, but not the general environment issues and policies. If a firm fails to comply with regulations and does not take step to protect the environment in which they operate, it may face the risks of resistance and decreased reputation from society and local government. Furthermore, if a firm lacks of proper insurance to prevent hazard damages, especially for those expose in dangerous environment, the hazard risks are relatively high.
This paper is organized as follows. Section II reviews previous literature and develops the testing hypotheses. Section III presents sample data and research methodology. The empirical results are discussed in section IV, and then the conclusions and suggestions are provided in the section V.
II. Literature Review and Hypotheses Development
According to the definition provided by COSO (2004), ERM is “a process, effected by an entity’s board of directors, management and other personnel, applied in strategy setting and across the enterprise, designed to identify potential events that may affect the entity, and manage risk to be within its risk appetite, to provide
reasonable assurance regarding the achievement of entity objectives.” The board of directors plays a salient role in ERM because ERM emphasizes an integrated and holistic approach to manage risk which requires the strategic decisions from the board. Therefore board composition and corporate governance are expected to influence the strategy of risk management, and the effect of ERM on firm value may have an impact on the corporate governance. These three items are inherently related to one another.
Previous literature has not provided consistent evidence on the relationship between corporate governance and firm value. Gompers, Ishii, and Metrick (2003), Cremers and Nair (2005), and Black, Jang, and Kim (2006) suggest that better governance implies better performance or firm value although the connections vary with different firm characteristics among these studies. Contradictorily, Chhaochharia and Grinstein (2007) provide evidence that firms being less compliant with the regulations earn better returns. Some studies directly investigate the effect of SOX but do not have consistent conclusions either. Li, Pincus, and Rego (2008) find a positive effect of SOX on firm value, but Zhang (2007) finds a negative effect. Therefore it is not clear whether these regulations really lead to higher firm value and have better protection for investors.
In theory it seems reasonable to expect that better board composition will result in better governance and then higher firm value. However, in practice the characteristics of firms vary greatly and they have different needs of monitoring and advising from the board of directors. According to Adams and Ferreira (2007) and Raheja (2005), the major functions of the board are monitoring and advising and the optimal board structure depends on the benefits and cost of monitoring and advising for specific firm characteristics. It is questionable whether there is a unique optimal board structure for all firms. Do a majority of independent directors on the board imply better governance and better performance? The answer is unknown yet. Bhagat and Black (2002) and Klein (1998) both suggest no correlation between firm performance and board independence.
This paper considers the ERM strategy may be an intervening factor in the relationship between corporate governance and firm performance. In a rapidly
changing and highly uncertain market, corporate must be willing to take risk, otherwise the prospects of business growth wane. Therefore risk management strategies make a good example to explore the relationship between corporate governance and their business strategies for several reasons. First, corporate risk-taking behavior is a strategic decision whereby directors and officers are involved. Their decisions can affect firm’s ability to compete and ultimately its survival. Second, the outcomes of risk-taking decision turn out to influence firm value. Third, the firm’s risk-management strategy affects financial and economic fragility, especially after recent financial turmoil, which intensifies interest in understanding the risk-taking/management strategies and corporate social responsibility (Godfrey, Merrill, and Hansen, 2009).
As indicated by Fiegenbaum and Thomas (2004), the operation of a firm is an interaction among industry structure, firm’s business strategies and conducts, and the firm’s performance. The outcome of current performance will influence the firm’s risk attitude and tolerance level for next period. For example, the profitability of this year may affect the risk tolerance of new projects next year. Based on this viewpoint, this paper considers ERM as a process to integrate the internal risk attitude and the external social and economic factors. This ERM process will then affect its business strategies and performance, as shown in figure 2. Since corporate governance (board composition) is a critical factor for firm’s internal risk attitude, the following hypotheses are developed.
H1: Firms’ ERM strategies will have an impact on its corporate governance. H1a: Firms with ERM strategies will have higher board independence. H1b: Firms with ERM strategies will have lower leadership duality. H1c: Firms with ERM strategies will have smaller board size.
Recent researches have increased attention to ERM for its potential gains to a business. Nocco and Stulz (2006) suggest that an integrated approach to risk management can create shareholder value because managing risks holistically provides firms a competitive advantage through the optimal balance between risk and return. Stulz (2003) indicates that the coordination of risks across the entire enterprise helps preventing the adverse effect from a single project’s risk on the firm. Sharfman and Fernando (2008) find that firms with better environmental risk management have lower cost of capital. Therefore, this paper develops the following hypothesis.
H2: Firms with ERM strategies exhibits higher firm value.
In addition to ERM strategies, the firm characteristics may have certain effect on the corporate governance and firm value of a firm. The firm characteristics include firm size, debt ratio, industry, shareholding percentages of the directors and the top management, and firm performance because they will affect the selection of board directors and firm value. Firm size and debt ratio represents firm complexity. Because
External factors: Social and econ. environments Enterprise risk management Internal factors: Firm’s risk attitude and tolerance level Industry structure Strategies and operations Performance Figure 2. Enterprise Risk Management Process
the monitoring cost usually increases with firm complexity, more capable independent directors are needed to advise the operations as suggested by Boone et al. (2007). Leadership duality probably is helpful for efficiency in operating a large firm as found by Linck, Netter and Yang (2008). The firm with high debt ratio may have higher probability of financial distress and thus need more monitoring and advising from the independent directors.
The shareholding percentage of the outside directors and the top management represents the ownership incentives. Raheja (2005) indicates that the board size will be smaller when the incentives of inside directors are aligned with those of shareholders. Finally the firm performance is a proxy for the CEO bargaining power because a CEO with good performance is likely to have better bargaining power and thus will affect board composition.
Stock return volatility is another proxy for monitoring cost. Maug (1997) considers it costly for the firm with high information asymmetry to transfer information to the outside directors. Adams and Ferreira (2007) suggest that the number of outside directors decreases with the monitoring cost. Industry is another variable related to information issue. It is expected that firms in the high technology industry have higher information asymmetry between the officers and the investors.
Additionally, the variables for firm characteristics include firm size, debt ratio, stock volatility, and industry type may have an impact on the firm value. Firm size is frequently used in the literature to represent the scale effect. Debt ratio is usually used to measure the firm’s potential financial distress risk, which is expected to have negative impact on the firm value. Stock return volatility is a proxy for monitoring cost due to information asymmetry and is expected to have negative impact on the firm value due to lack of monitoring from outsiders. Industry is a variable to represent the specific industry characteristic. For example, high technology firms
face very different market competition from that of traditional industries. Besides, good performance usually implies higher firm value.
III. Sample and Research Methodology A. Sample and Data
A firm’s ERM strategies usually cannot be measured directly. We can only make indirect observation through its knowledge and concerns on risk management. Therefore this paper applies the methodology of content analysis as the study by Linsley and Shrives (2006), and searches the key word “risk management” in the annual report of a firm. The rationale is that a firm will emphasize the idea of risk management and frequently use this terminology in describing its business policies and strategies if it regards risk management as an important strategy in its operations.
This paper retrieved the annual reports of all the 1304 publicly listed and OTC firms in Taiwan from the public information data bases, including the Taiwan Economic Journal (TEJ), Taiwan Stock Exchange Corp. (TSEC), and Market Observation Post System (MOPS) for the year 2009. By the computer’s searching technique for a PDF document, the key word “risk management” is searched on the annual report of each firm. Because the formats of some annual reports are not searchable by the PDF technique, there are 954 firms available for this study. However, to avoid the biased effect of financial institutions where risk management is required by the regulations, they are excluded in the sample. Finally the total number of firms included in the sample is 931. The ERM strategies are identified through the following procedures.
(1) If a firm sets up “risk management” department in its organization structure, a dummy variable (RMD) equal to 1 is recorded, otherwise 0.
(2) If a firm sets up “risk management” committee in its organization structure, a dummy variable (RMC) equal to 1 is recorded, otherwise 0.
(3) If a firm sets up an auditing office in its organization structure, a dummy variable (AUDIT) equal to 1 is recorded, otherwise 0, because auditing office performs the function of internal control which is related to risk management.
(4) According to the contents of each paragraph on the annual report, if the term “risk management” appears in a paragraph related to market competition or other business strategies, it is identified as the firm caring for “strategic risk
management” (SRM). A dummy variable equal to 1 is assigned if it appears at least once, otherwise 0.
(5) By the same token, the contents of each paragraph on the annual report are analyzed. If the term “risk management” appears in a paragraph of the annual report related to corporate finance such as debt, liquidity and derivatives, it is regarded as caring for “financial risk management” (FRM). A dummy variable equal to 1 is assigned for the variable FRM if it appears at least once, otherwise 0. (6) If the term “risk management” appears in a paragraph related to internal business operations, it is regarded as caring for “operational risk management” (ORM). A dummy variable equal to 1 is assigned for the variable ORM if it appears at least once, otherwise 0.
(7) If the term “risk management” appears in a paragraph of the annual report related to unexpected natural or man-made disasters such as earthquake, typhoon, and terrorism, it is regarded as caring for “hazard risk management” (HRM). A dummy variable equal to 1 is assigned for the variable HRM if it appears at least once, otherwise 0.
(8) Finally the total number of appearance of the term “risk management” in an annual report is counted for each firm (RMsum). And if the term “risk management” appears at least once, the dummy variable (RMyes) is equal to 1, otherwise RM=0.
In addition to the variables for RM strategies, the variables for corporate governance, firm value, and firm characteristics are all retrieved from the public data bases TEJ, TSEC, and MOPS as indicated in the above. Corporate governance of a firm is represented by its board composition because the board is the decision-making center of a firm. According to Link, Netter, and Yang (2008), the board composition primarily emphasizes on three elements: board independence, leadership duality, and board size. Board independence is defined as the proportion of the board composed of outsiders. Leadership duality is whether the CEO is also the chairman of the board (COB), a dummy variable equal to 1 is assigned if CEO=COB. Board size is the number of directors on the board. Firm value is measured Tobin’s Q. Tobin’s Q is equal to the market value of assets over the book value of assets, where the market value of assests is the book value of assets plus market value of equity minus book value of equity (Chhaochharia and Grinstein, 2007).
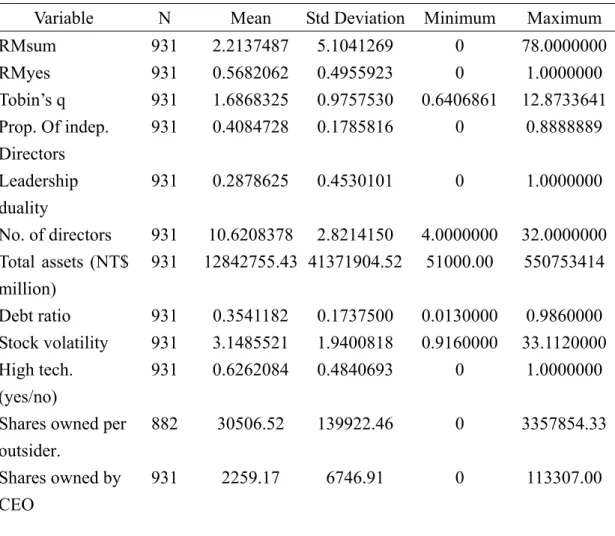
Firm size is measured by the natural logarithm of book value of total assets. The debt ratio is equal to the book value of debt to book value of debt plus market value of equity. The measurement for insiders’ ownership is shares owned by the CEO (top management). The measurement for outsiders’ ownership is the average shares owned per outsiders. The measurement for stock volatility is the standard deviation of daily stock returns over the year. The measurement for industry is a dummy variable which equals one for high technology and zero for others. Performance variables are represented by industry-adjusted ROA (adj-ROA) and market-to-book value of equity (MTB). Adj-ROA is traditionally an accounting measurement for firm performance, and MTB is the proxy for growth opportunity (Gaver and Gaver, 1993). The descriptive statistics of the sample are summarized in table 1.
Table 1 Summary Statistics of the Sample
Variable N Mean Std Deviation Minimum Maximum
RMsum 931 2.2137487 5.1041269 0 78.0000000 RMyes 931 0.5682062 0.4955923 0 1.0000000 Tobin’s q 931 1.6868325 0.9757530 0.6406861 12.8733641 Prop. Of indep. Directors 931 0.4084728 0.1785816 0 0.8888889 Leadership duality 931 0.2878625 0.4530101 0 1.0000000 No. of directors 931 10.6208378 2.8214150 4.0000000 32.0000000 Total assets (NT$ million) 931 12842755.43 41371904.52 51000.00 550753414 Debt ratio 931 0.3541182 0.1737500 0.0130000 0.9860000 Stock volatility 931 3.1485521 1.9400818 0.9160000 33.1120000 High tech. (yes/no) 931 0.6262084 0.4840693 0 1.0000000
Shares owned per outsider.
882 30506.52 139922.46 0 3357854.33
Shares owned by CEO
Industry adjusted ROA 931 -0.9641353 10.2088440 -74.1000000 47.3000000 Market-to-book (MTB) of equity 931 2.1980162 4.3373625 0.4092745 119.4184839 B. Research Methodology
The analysis of ERM strategies on corporate governance and firm value is conducted through several approaches because the board structure is relatively persistent, as suggested by Hermalin and Weisbach (1998). Linck, Netter and Yang (2008) indicate that the three elements of the board composition are likely to be endogenously determined and thus need more attention in the analytical methodology. To analyze the impact of ERM on corporate governance and firm value, this paper first compares the board composition and firm values between the firms with concerns on ERM and those without. A firm is regarded with concerns on ERM if the sum of the 7 RM-variables is greater than 0, otherwise is grouped as firms without concerns on ERM. This method is similar to the matched-sample method used by Chhaochharia and Grinstein (2007). This paper applies the t-test and nonparametric Wilcoxon test to compare the means and medians of firm value and board composition between the two groups of firms, with and without concerns on ERM. These analyses provide initial knowledge on the relationship between ERM and business operations.
Next, regression analyses are applied to study the impact of ERM on corporate governance board and firm value, with consideration of firm characteristics. Each regression analysis is applied to two measurements of corporate governance. The first one is using three elements of board composition directly for the measurement of corporate governance. The second approach is using principle component analysis on
the three elements of board composition to find a composite index for corporate governance. OLS regression is applied first for the relationship between corporate governance and ERM and the relationship between firm value and ERM as model (1). To analyze the interaction effect of corporate governance and ERM strategies on the firm value, this paper also applies the interaction of ERM and corporate governance to the regression model. The control variables for firm characteristics are also included because Himmelberg, Hubbard, and Palia (1999) indicate various factors likely to affect the corporate performance.
CorpGovernt = α + β1 ERMt + β2 FirmSizet + β3 DebtRatiot
+ β4StockVolatilityt + β5 Industryt + β6 OutsiderSharest
+ β7CEOSharest + β8ROAt + β9MTBt + εt (1a)
FirmValuet = α + β1 ERMt + β2CorpGovernt + β3 FirmSizet + β4 DebtRatiot
+ β5StockVolatilityt + β6 Industryt + β7ROAt
+ β8MTBt + εt (1b)
FirmValuet = α + β1 ERMt + β2 CorpGovernt + β3CorpGovernt*ERMt
+ β4 FirmSizet + β5 DebtRatiot + β6StockVolatilityt + β7Industryt
+ β8ROAt + β9MTBt +εt (1b’)
The second approach is simultaneous-equations model as shown in model (2) because corporate governance, firm value, and ERM strategies of year t are possibly endogenously decided. The board composition is affected by firm performance and
ERM strategies of year t. Then corporate governance of year t will affect firm value of year t which is usually shown at the end of year t. The model is a system of equations as shown in the model (2), including three equations for board composition and one equation for firm value.
BoardIndept = α + β1 ERMt + β2 FirmSizet + β3 DebtRatiot
+ β4StockVolatilityt + β5 Industryt + β6 OutsiderSharest
+ β7CEOSharest + β8ROAt + β9MTBt + εt
LeaderDualt = α + β1 ERMt + β2 FirmSizet + β3 DebtRatiot
+ β4StockVolatilityt + β5 Industryt + β6 OutsiderSharest
+ β7CEOSharest + β8ROAt + β9MTBt + εt
BoardSizet = α + β1 ERMt + β2 FirmSizet + β3 DebtRatiot
+ β4StockVolatilityt + β5 Industryt + β6 OutsiderSharest
+ β7CEOSharest + β8ROAt + β9MTBt + εt
FirmValuet = α + β1 ERMt + β2BoardInd*ERMt +β3LeaderDual*ERMt
+β4BoardSize*ERMt +β5 FirmSizet + β6 DebtRatiot
+ β7StockVolatilityt + β8 Industryt + β9ROAt
+ β10MTBt + εt (2)
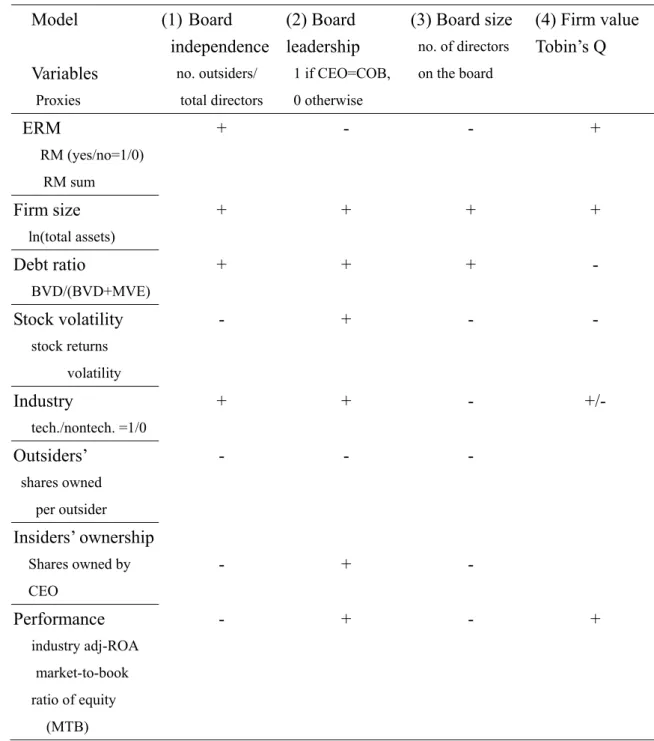
The definition of variables and expected signs for hypotheses testing are listed in table 2.
Table 2 Definitions of Variables and Expected Signs for Testing Model Variables Proxies (1) Board independence no. outsiders/ total directors (2) Board leadership 1 if CEO=COB, 0 otherwise (3) Board size no. of directors on the board (4) Firm value Tobin’s Q ERM RM (yes/no=1/0) RM sum + - - + Firm size ln(total assets) + + + + Debt ratio BVD/(BVD+MVE) + + + - Stock volatility stock returns volatility - + - - Industry tech./nontech. =1/0 + + - +/- Outsiders’ shares owned per outsider - - - Insiders’ ownership Shares owned by CEO - + - Performance industry adj-ROA market-to-book ratio of equity (MTB) - + - + IV. Results
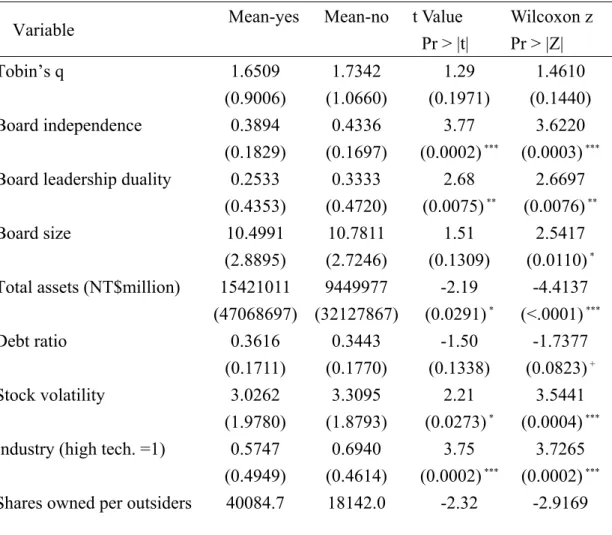
The board structure and firm characteristics between the firms with and without risk management concerns are compared and shown in Table 3. The finding shows that more than 50% of public firms already has concerns on ERM since they use the term “risk management” at least once in their annual reports. The t-tests indicate that
board independence is higher in the firms without ERM, which is confirmed by the nonparametric Wilcoxon test. The tests on leadership duality also show significant difference and indicate firms with ERM have less duality, according to t-test and the Wilcoxon test. The difference in the means of board size is not significant according to t-test, but the median is significantly different. The firms with ERM also present more total assets. The difference in the means of debt ratio is not significant according to t-test, but the median is significantly different. Additionally, the tests show that firms without ERM have significantly higher stock volatility. The proportion of high technology firms is higher in the group of without ERM. The number of shares owned per outside director is higher in the firms with ERM. The shares owned by CEO is not significantly different. The performance indicators adj-ROA and MTB do not show significant difference between two groups of firms.
Table 3 Comparisons between the Firms with and without RM Strategies
Variable Mean-yes Mean-no t Value Pr > |t| Wilcoxon z Pr > |Z| Tobin’s q 1.6509 (0.9006) 1.7342 (1.0660) 1.29 (0.1971) 1.4610 (0.1440) Board independence 0.3894 (0.1829) 0.4336 (0.1697) 3.77 (0.0002) *** 3.6220 (0.0003) ***
Board leadership duality 0.2533 (0.4353) 0.3333 (0.4720) 2.68 (0.0075) ** 2.6697 (0.0076) ** Board size 10.4991 (2.8895) 10.7811 (2.7246) 1.51 (0.1309) 2.5417 (0.0110) *
Total assets (NT$million) 15421011 (47068697) 9449977 (32127867) -2.19 (0.0291) * -4.4137 (<.0001) *** Debt ratio 0.3616 (0.1711) 0.3443 (0.1770) -1.50 (0.1338) -1.7377 (0.0823) + Stock volatility 3.0262 (1.9780) 3.3095 (1.8793) 2.21 (0.0273) * 3.5441 (0.0004) ***
Industry (high tech. =1) 0.5747 (0.4949) 0.6940 (0.4614) 3.75 (0.0002) *** 3.7265 (0.0002) ***
(181326) (46659.8) (0.0208) * (0.0035)**
Shares owned by CEO 2219.2 (6126.9) 2311.7 (7492.6) 0.21 (0.8359) 0.0023 (0.9981) Industry-adj ROA -0.7053 (9.0384) -1.3048 (11.5732) -0.89 (0.3750) -0.7392 (0.4598) Market-to-book ratio of equity 2.0698 (2.3688) 2.3667 (6.0160) 1.03 (0.3012) 1.2262 (0.2201) Sample size 529 402
Note: Mean-yes is the mean for the firms with RM strategies, and Mean-no is the mean for those without RM strategies. t-test and Wilcoxon test are for differences in means and medians. Significance levels: + p<0.10; * p<0.05; ** p<0.01; *** p<0.001.
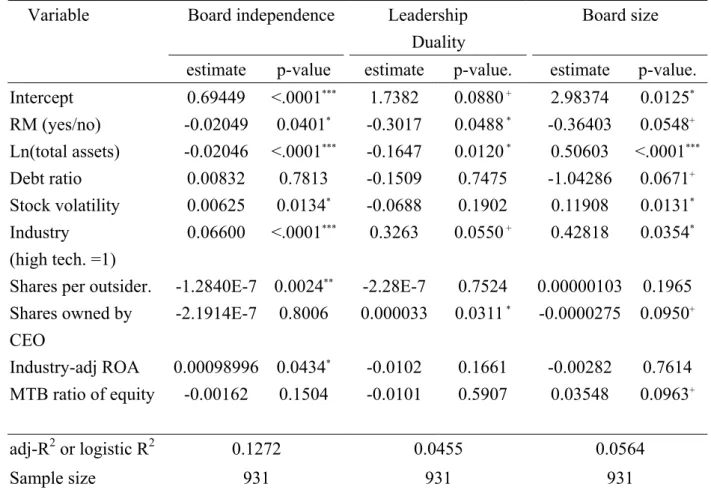
The regression results for the board structure are shown in table 4a. The results show that board independence is negatively related to RMyes and thus does not support hypothesis 1a. The firm characteristics have a significant impact on the board independence. The effect of firm size is negative and inconsistent with the prediction. The debt ratio is not a significant factor and stock volatility positively affects board independence. The technology industry shows positive relationship with board independence as the prediction. The impact of outsiders’ incentives is also significant and consistent with the prediction. Board independence is negatively related to the average shares percentage per outsider, but the effect of CEO incentive on the board independence is insignificant. The performance variable adj-ROA has a positive relationship with board independence, but the MTB does not. These results somewhat contradict the prediction of bargaining power theory.
The effect of ERM on the leadership duality is negative and significant as predicted, according to the results in tables 4a. Besides, some of the firm characteristics also exhibit significant impact. Firm size shows a negative effect which implies that small firms are more likely to have a CEO also serving as a COB.
Although this result contradicts the theoretical prediction, it reflects the reality of business culture in Taiwan. Industry type and shares owned by CEO both show a positive relationship as predicted. The leaders of high technology firms need expertise and thus have positive effect on the leadership duality as predicted.
The board size has a negative and significant relation with ERM as predicted. Additionally it is significantly affected by the several firm characteristics. Firm size and stock volatility both have a positive impact on board size, and high technology industry also shows positively related to board size. It is negatively related to debt ratio and the shares percentage of CEO. The performance variable MTB has a positive relationship with the board size but adj-ROA does not show significant effect on the board size.
Table 4a OLS Regression for Board Structure Board independence Leadership
Duality
Board size Variable
estimate p-value estimate p-value. estimate p-value. Intercept 0.69449 <.0001*** 1.7382 0.0880 + 2.98374 0.0125* RM (yes/no) -0.02049 0.0401* -0.3017 0.0488 * -0.36403 0.0548+ Ln(total assets) -0.02046 <.0001*** -0.1647 0.0120 * 0.50603 <.0001*** Debt ratio 0.00832 0.7813 -0.1509 0.7475 -1.04286 0.0671+ Stock volatility 0.00625 0.0134* -0.0688 0.1902 0.11908 0.0131* Industry (high tech. =1) 0.06600 <.0001*** 0.3263 0.0550 + 0.42818 0.0354*
Shares per outsider. -1.2840E-7 0.0024** -2.28E-7 0.7524 0.00000103 0.1965
Shares owned by CEO -2.1914E-7 0.8006 0.000033 0.0311 * -0.0000275 0.0950+ Industry-adj ROA 0.00098996 0.0434* -0.0102 0.1661 -0.00282 0.7614 MTB ratio of equity -0.00162 0.1504 -0.0101 0.5907 0.03548 0.0963+ adj-R2 or logistic R2 0.1272 0.0455 0.0564 Sample size 931 931 931
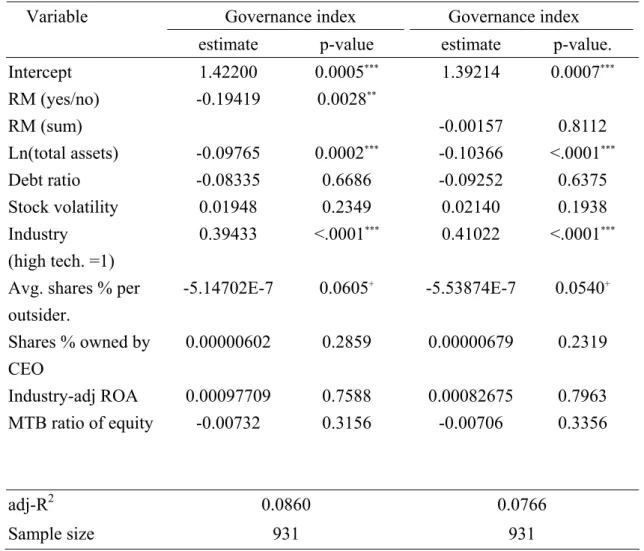
The OLS regression analyses based on RMsum as the proxy for RM strategies show that board size are positively related to ERM, but the other two elements of board composition do not have significant relationship with ERM. The impact of firm characteristics is similar to that in table 4a.2 To have a further analysis, the three elements of board composition are integrated into a governance index by the technique of principal component. Then the regression results based on the governance index are presented in table 4b. The findings are quite close to table 4 that corporate governance is negatively related RMyes but not RMsum.
Table 4b OLS Regression for Governance Index
Governance index Governance index Variable
estimate p-value estimate p-value.
Intercept 1.42200 0.0005*** 1.39214 0.0007*** RM (yes/no) -0.19419 0.0028** RM (sum) -0.00157 0.8112 Ln(total assets) -0.09765 0.0002*** -0.10366 <.0001*** Debt ratio -0.08335 0.6686 -0.09252 0.6375 Stock volatility 0.01948 0.2349 0.02140 0.1938 Industry (high tech. =1) 0.39433 <.0001*** 0.41022 <.0001***
Avg. shares % per outsider. -5.14702E-7 0.0605+ -5.53874E-7 0.0540+ Shares % owned by CEO 0.00000602 0.2859 0.00000679 0.2319 Industry-adj ROA 0.00097709 0.7588 0.00082675 0.7963 MTB ratio of equity -0.00732 0.3156 -0.00706 0.3356 adj-R2 0.0860 0.0766 Sample size 931 931
The eigenvector for the three elements of the board composition [independence, leadership, size] is [0.762, 0.622, 0.182] *** sig. at 0.1%; ** sig. at 1%; * sig. at 5%; + sig. at 10%.
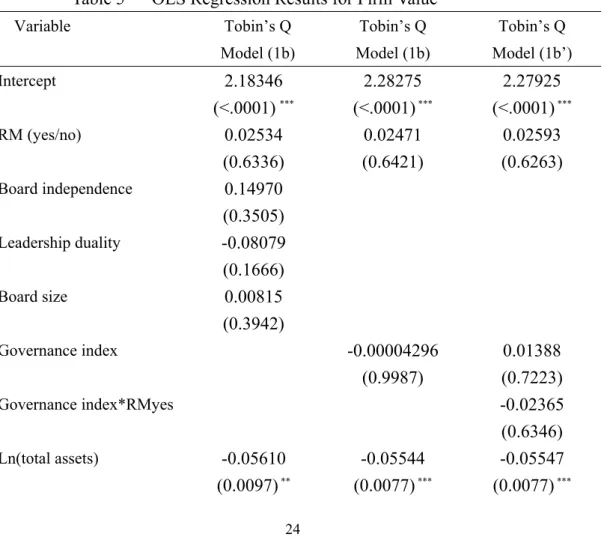
The relationship between firm value and risk management strategies are presented in table 5. The results show that Tobin’s Q is not significantly related to ERM. Besides, firm value measured in Tobin’s Q is not related to board structure, which does not support the argument of Hung, Chen and Lin (2007). The firm value is neither related to the interaction of governance structure and ERM. The results show that firm characteristics have a strong impact on firm value.
Most of the characteristic variables are significantly related to firm value. The effect of firm size is negative which contradicts with the prediction, but the effect of debt ratio is negative as predicted. The stock volatility has a positive impact on firm value which contradicts the prediction. The effect of industry type is significant and positive which implies high technology industry has higher firm value. The performance variables adj-ROA and MTB both show significant and positive relation with the firm value as predicted.
Table 5 OLS Regression Results for Firm Value
Variable Tobin’s Q Model (1b) Tobin’s Q Model (1b) Tobin’s Q Model (1b’) Intercept 2.18346 (<.0001)*** 2.28275 (<.0001) *** 2.27925 (<.0001) *** RM (yes/no) 0.02534 (0.6336) 0.02471 (0.6421) 0.02593 (0.6263) Board independence 0.14970 (0.3505) Leadership duality -0.08079 (0.1666) Board size 0.00815 (0.3942) Governance index -0.00004296 (0.9987) 0.01388 (0.7223) Governance index*RMyes -0.02365 (0.6346) Ln(total assets) -0.05610 (0.0097) ** -0.05544 (0.0077) *** -0.05547 (0.0077) ***
Debt ratio -1.04806 (<.0001) *** -1.04963 (<.0001) *** -1.04648 (<.0001) *** Stock volatility 0.07364 (<.0001) *** 0.07620 (<.0001) *** 0.07610 (<.0001) ***
Industry (high tech =1) 0.35149 (<.0001) *** 0.36401 (<.0001) *** 0.36497 (<.0001) *** Industry-adj ROA 0.03068 (<.0001) *** 0.03105 (<.0001) *** 0.03108 (<.0001) *** MTB ratio of equity 0.07346 (<.0001) *** 0.07368 (<.0001) *** 0.07375 (<.0001) *** Adj-R2 0.3512 0.3500 0.3494 Sample size 931 931 931 *** significance at 0.1%; ** significance at 1%; * significance at 5%; + significance at 10%.
The p-values are reported in parentheses.
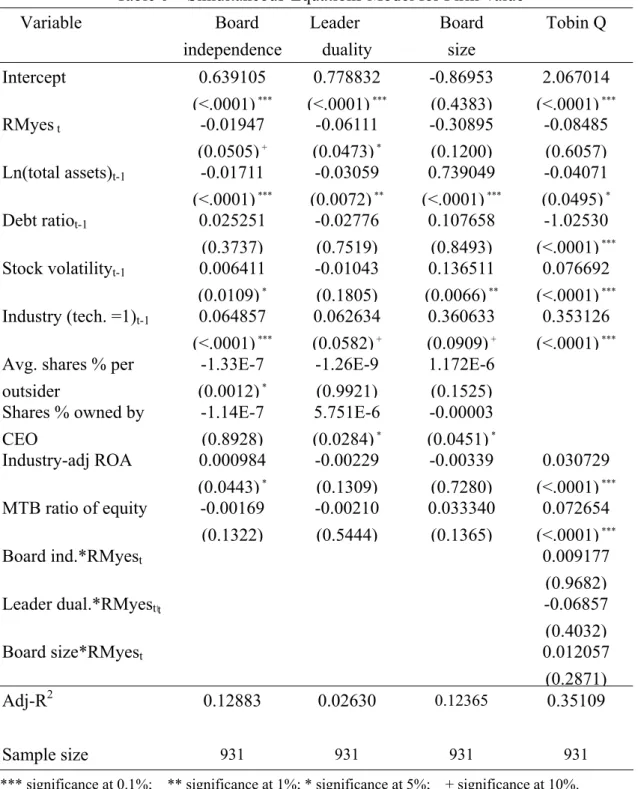
The empirical results based on simultaneous equations model are presented in table 6. The simultaneous equations model includes equations for the three elements of board composition and an additional equation for firm value because it may have endogenous relation with the board composition. The findings are very close to those of OLS regressions in the basic analyses. According to results, it is seen that the endogeneity problem among the three elements of board structure is not serious in our sample. The board composition is related to ERM and firm characteristics, but the firm value is affected by the firm characteristics only. In general the firm value seems not strongly related to ERM strategy and the interaction between board composition and ERM.
Table 6 Simultaneous-Equations Model for Firm Value Variable Board independence Leader duality Board size Tobin Q Intercept 0.639105 (<.0001) *** 0.778832 (<.0001) *** -0.86953 (0.4383) 2.067014 (<.0001) *** RMyes t -0.01947 (0.0505) + -0.06111 (0.0473) * -0.30895 (0.1200) -0.08485 (0.6057) Ln(total assets)t-1 -0.01711 (<.0001) *** -0.03059 (0.0072) ** 0.739049 (<.0001) *** -0.04071 (0.0495) * Debt ratiot-1 0.025251 (0.3737) -0.02776 (0.7519) 0.107658 (0.8493) -1.02530 (<.0001) *** Stock volatilityt-1 0.006411 (0.0109) * -0.01043 (0.1805) 0.136511 (0.0066) ** 0.076692 (<.0001) *** Industry (tech. =1)t-1 0.064857 (<.0001) *** 0.062634 (0.0582) + 0.360633 (0.0909) + 0.353126 (<.0001) ***
Avg. shares % per outsider -1.33E-7 (0.0012) * -1.26E-9 (0.9921) 1.172E-6 (0.1525) Shares % owned by CEO -1.14E-7 (0.8928) 5.751E-6 (0.0284) * -0.00003 (0.0451) * Industry-adj ROA 0.000984 (0.0443) * -0.00229 (0.1309) -0.00339 (0.7280) 0.030729 (<.0001) *** MTB ratio of equity -0.00169 (0.1322) -0.00210 (0.5444) 0.033340 (0.1365) 0.072654 (<.0001) *** Board ind.*RMyest 0.009177 (0.9682) Leader dual.*RMyestttt -0.06857 (0.4032) Board size*RMyest 0.012057 (0.2871) Adj-R2 0.12883 0.02630 0.12365 0.35109 Sample size 931 931 931 931
*** significance at 0.1%; ** significance at 1%; * significance at 5%; + significance at 10%. The p-values are reported in parentheses.
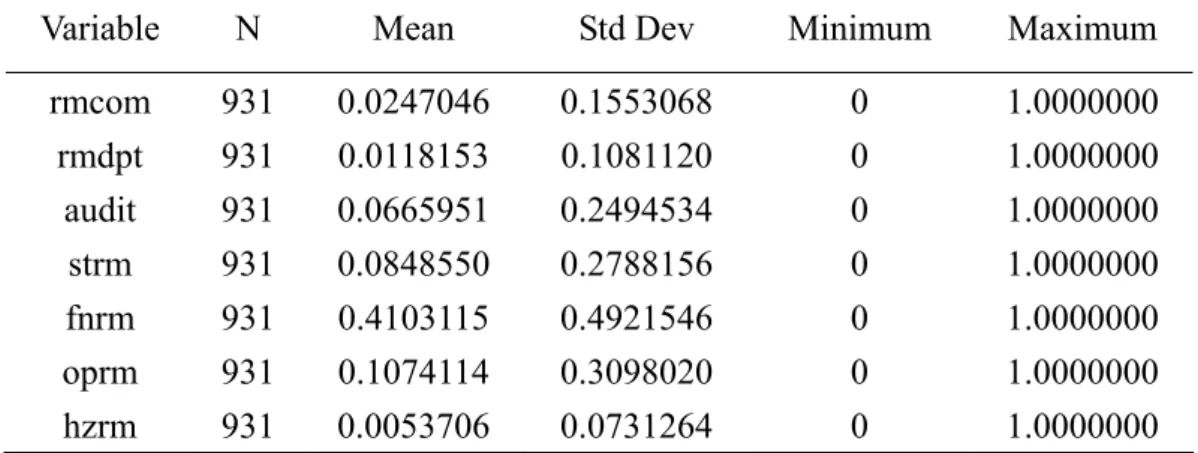
To have detailed examination for the effect of ERM strategies, this paper investigate the ERM policy in an organization and the individual RM strategies on the four categories of business risks: strategic risk, financial risk, operational risk, and hazard risk. The mean values indicate that firms pay more attention on financial risk
than other aspects. About 40% of firms have concerns on financial risk management and 10% of firms have concerns on operational risk management. The correlations among the seven ERM related variables are shown in table 8. According to the results, the correlation among these variables is very low. This finding implies that most firms do not have a holistic and integrated view on risk management yet. At this moment they still focus on functional risk management, especially the financial risk.
Table 7 Summary Statistics of the Individual ERM Variables
Variable N Mean Std Dev Minimum Maximum
rmcom rmdpt audit strm fnrm oprm hzrm 931 931 931 931 931 931 931 0.0247046 0.0118153 0.0665951 0.0848550 0.4103115 0.1074114 0.0053706 0.1553068 0.1081120 0.2494534 0.2788156 0.4921546 0.3098020 0.0731264 0 0 0 0 0 0 0 1.0000000 1.0000000 1.0000000 1.0000000 1.0000000 1.0000000 1.0000000
Table 8 Correlation Matrix of RM Strategy Variables N=931 RM Commit. RM depart. Auditing office Strategic RM Financial RM Operation RM Hazard RM RM comm. 1.0000 RM depart. 0.1747 1.0000 Audit office 0.0130 0.0505 1.0000 Strategic RM 0.2744 0.1451 0.0423 1.0000 Financial RM 0.1064 0.0705 0.0750 0.2240 1.0000 Operation RM 0.2577 0.1547 0.0187 0.5168 0.2396 1.0000 Hazard RM 0.0830 0.1280 -.0196 0.0304 -.0015 0.1169 1.0000
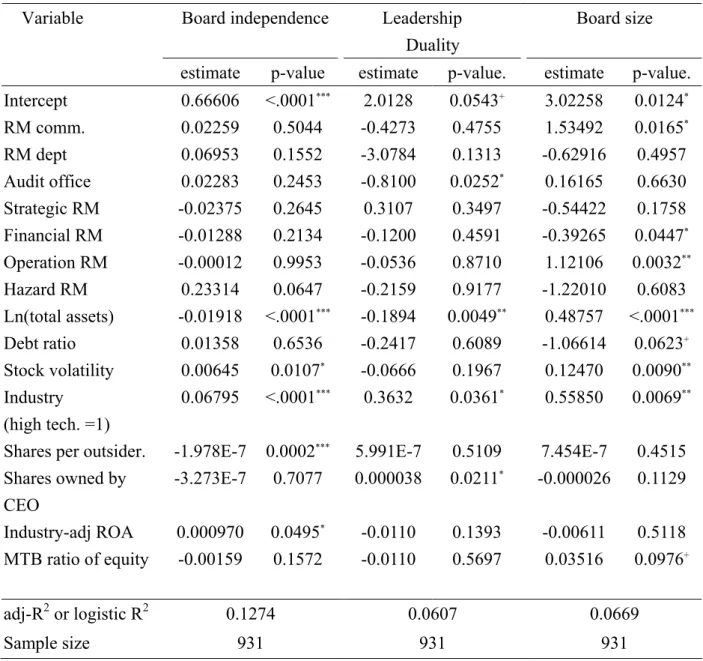
The regression analyses for the relationship between board composition and the individual risk management strategies are shown in table 9. In general, most of the
ERM variables do not have a significant impact on the board composition. The exception is the auditing office has a negative effect on leadership duality. Besides, risk management committee as well as operational risk management has a positive effect on board size, and financial risk management has a negative relation with board size. The firm value also does not have significant relation with the individual RM variables, except for some minor negative impact from strategic RM and financial RM.
Table 9 OLS Regression for Board Structure and RM Strategies Board independence Leadership
Duality
Board size Variable
estimate p-value estimate p-value. estimate p-value. Intercept 0.66606 <.0001*** 2.0128 0.0543+ 3.02258 0.0124* RM comm. 0.02259 0.5044 -0.4273 0.4755 1.53492 0.0165* RM dept 0.06953 0.1552 -3.0784 0.1313 -0.62916 0.4957 Audit office 0.02283 0.2453 -0.8100 0.0252* 0.16165 0.6630 Strategic RM -0.02375 0.2645 0.3107 0.3497 -0.54422 0.1758 Financial RM -0.01288 0.2134 -0.1200 0.4591 -0.39265 0.0447* Operation RM -0.00012 0.9953 -0.0536 0.8710 1.12106 0.0032** Hazard RM 0.23314 0.0647 -0.2159 0.9177 -1.22010 0.6083 Ln(total assets) -0.01918 <.0001*** -0.1894 0.0049** 0.48757 <.0001*** Debt ratio 0.01358 0.6536 -0.2417 0.6089 -1.06614 0.0623+ Stock volatility 0.00645 0.0107* -0.0666 0.1967 0.12470 0.0090** Industry (high tech. =1) 0.06795 <.0001*** 0.3632 0.0361* 0.55850 0.0069**
Shares per outsider. -1.978E-7 0.0002*** 5.991E-7 0.5109 7.454E-7 0.4515
Shares owned by CEO -3.273E-7 0.7077 0.000038 0.0211* -0.000026 0.1129 Industry-adj ROA 0.000970 0.0495* -0.0110 0.1393 -0.00611 0.5118 MTB ratio of equity -0.00159 0.1572 -0.0110 0.5697 0.03516 0.0976+ adj-R2 or logistic R2 0.1274 0.0607 0.0669 Sample size 931 931 931
V. Conclusions
This study conducts empirical analyses of the role of ERM in a firm. Although risk management is a term frequently seen in the medias, the implementation and the effect of risk management in a firm is unknown. This paper intends to investigate the application of risk management in businesses in Taiwan. Through the data analysis, this paper finds that more than 50% of public firms use the term “risk management” in their annual report, which shows the popularity of the term. However, the impact of risk management on the business strategies seems not significant. There are many aspects where risk management can have influence in a firm. This paper first focus on the board structure, which is one of the most important constructs of corporate governance. The empirical results in general support the hypotheses that board composition is related to the ERM strategy. The firms that emphasize risk management in their annual report show lower board independence, less leadership duality and smaller board size. In summary, the ERM presents a positive function for corporate governance of public firms according to these empirical results.
Additionally, this paper analyzes the effect ERM concept on firm value. Since literature shows that many factors can have contribution on firm value, risk management can be one of them. This study analyzes the effect ERM on firm value based on the data of public companies in Taiwan. The empirical results in general show that ERM does not have a significant impact on the firm value. The findings suggest that firm value is mostly affected by the firm characteristics itself, whether a firm concerns ERM or not. To sum up, the empirical results based on the data of public firms in Taiwan show that the concept of ERM primarily is still in beginning stage. Although the firms have already known and used this term “risk management” to describe their business operations, their business strategies in fact do not integrate the concept of risk management into the important decisions yet.
The contribution of risk management to the business operations is still unknown. In theory ERM is important to competitive advantages, and in practice it is highly
promoted in recent years by the regulations. Although this paper does not find significant impact of ERM on firm value, the effect of ERM on business operations is still an important issue to study in the future. The insignificant empirical results of this paper probably arise from the data of short period. Since the concept of risk management is still new for most firms in Taiwan, they do not really apply it in their business strategies yet. However, in the future it is expected ERM will penetrate into many aspects of business operations and cannot be ignored in the competitive strategies of a firm.
References
Adams, R. and D. Ferreira, 2007, “A Theory of Friendly Boards,” Journal of Finance 62: 217-250.
Alt, K. 2000, “Managing Reputation Risk,” The RMA Journal (September): 40-44. Beasley, M., D. Pagach, and R. Warr, 2008, “The Information Conveyed in Hiring
Announcements of Senior Executives Overseeing Enterprise-Wide Risk Management Processes,” Journal of Accounting, Auditing and Finance 23(3): 311-332.
Bhagat, S. and B. Black, 2002, “The Non-correlation between Board Independence and Long-term Firm Performance,” Journal of Corporation Law 27: 231-273. Black, B., H. Jang, and W. Kim, 2006, “Does Corporate Governance Predict Firms’
Market Values? Evidence from Korea,” Journal of Law, Economics, and Organization 22: 366-413.
Boone, Audra, Laura C. Field, Jonathan M. Karpoff, and Charu G. Raheij (2007), “The Determinant of Corporate Board Size and Composition: An Empirical Analysis,” Journal of Financial Economics 85 (July): 66-101.
Chhaochharia, Vidhi, and Yaniv Grinstein, 2007, “Corporate Governance and Firm Value: The Impact of the 2002 Governance Rules,” Journal of Finance 62: 1789-1825.
Coles, J. L., N. D. Daniel, and L. Naveen, 2006, “Managerial Incentives and Risk-taking,” Journal of Financial Economics 79: 431-468.
COSO, 2004, Enterprise Risk Management – Integrated Framework, Committee of Sponsoring Organizations of the Treadway Commission, AICPA, Jersey City, NJ. Cremers, Martijn, and Vinay B. Nair, 2005, “Governance Mechanisms and Equity
Prices,” Journal of Finance 60: 2859-2894.
Culp, C., 2001, The Risk Management Process: Business Strategy and Tactics, John Wiley & Sons Inc., New York, NY.
Fiegenbaum, A. and H. Thomas, 2004, “Strategic Risk and Competitive
Advantage: an Integrative Perspective,” European Management Review 1(1): 84-95.
Frigo, M. and R. Anderson, 2011, “Strategic Risk Management: A Foundation for Improving Enterprise Risk Management and Governance,” Journal of Corporate Accounting & Finance 22(3): 81-.88.
Gao, L., and P. Sudarsanam, 2005, “Executive Compensation, Hubris, Corporate Governance: Impact on Managerial Risk Taking and Value Creation in UK High-tech and Low-tech Acquisitions,” working paper, Cranfield University. Gaver, J. and K. Gaver (1993), “Additional Evidence on the Association between the
Investment Opportunity Set and Corporate Financing, Dividend, and Compensation Policies,” Journal of Financial Economics 16 (1), 125-160.
Glassman, C. 2001, “Strategic Risk Quadruple Jeopardy,” The RMA Journal (September): 52-53.
Godfrey, P., C. Merrill, and J. Hansen, 2009, “The Relationship between Corporate Social Responsibility and Shareholder Value: An Empirical Test of the Risk Management Hypothesis,” Strategic Management Journal 30: 425-445
Gompers, P., J. Ishi, and A. Metrick, 2003, “Corporate Governance and Equity Prices,” Quarterly Journal of Economics 118: 107-155.
Harrington, S. and G. Niehaus, 2003, Risk Management and Insurance, 2nd ed., McGraw-Hill Inc, New York, NY.
Hermalin, B. and M. Weisbach, 1998, “Endogenously Chosen Boards of Directors and Their Monitoring of the CEO,” American Economic Review 88 (March): 96-118.
Himmelberg, C., R. G. Hubbard, and D. Palia, 1999, “Understanding the Determinants of Managerial Ownership and the Link between Ownership and Performance,”
Journal of Financial Economics 53 (September): 353-84.
Hung, J., H. Chen, and H. Lin (2007), “The Impact of Corporate Governance Mechanisms on Innovation and Diversification Strategies as Well as on Performance: R&D-Intensive Industry,” Sun Yat-Sen Management Review 15 (March): 37-60.
Ioannis, A., L. Kalyvas, Z. Ioanna, and V. Bouchereau, 2006, Integrating Market, Credit and Operational Risk: A Complete Guide for Bankers and Risk Professionals, Risk Books Inc., London.
Klein, A., 1998, “Firm Performance and Board Committee Structure,” Journal of Law and Economics 41: 275-99.
Knight, F. 1921, Risk, Uncertainty, and Profit. Houghton Mifflin Co., NY. Lam, J. 2003. Enterprise Risk Management. John Wiley and Sons Inc., NY.
Li, H., M. Pincus, and S. Rego, 2008, “Market Reaction to Events Surrounding the Sarbanes-Oxley Act of 2002 and Earnings Management,” Journal of law and Economics 51: 111-134.
Linck, J., J. Netter, and T. Yang (2008), “The Determinants of Board Structure,” Journal of Financial Economics 87 (February): 308-328.
Linsley, P. and P. Shrives, 2006, “Risk Reporting: A Study of Risk Disclosures in the Annual reports of UK Companies, The British Accounting Review 38: 387-404. Low, A., 2009, “Managerial Risk-taking Behavior and Equity-based Compensation,”
Journal of Financial Economics 92: 470-490.
Maug, Ernst (1997), “Boards of Directors and Capital Structure: Alternative Forms of Corporate Restructuring,” Journal of Corporate Finance 3 (Spring): 113-139. Meulbroek, L., 2002, “A Senior Manager’s Guide to Integrated Risk Management,”
Journal of Applied Corporate Finance 14(4): 56-70.
Modigliani, F., and Miller, M. H. 1958. “The Cost of Capital, Corporation Finance, and the Theory of Investment.” American Economic Review 47.
Nocco, B., and R. Stulz, 2006, “Enterprise Risk Management: Theory and Practice,” Journal of Applied Corporate Finance 18: 8-20. _
Olson, D. and D. Wu, 2008, Enterprise Risk Management, World Scientific Publishing Co., Hackensack, NJ.
Paladino, B., L. Cuy, and M. Frigo, 2009, “Missed Opportunities in Performance and Enterprise Risk Management,” Journal of Corporate Accounting & Finance 20(3): 43-51.
Raheja, C., 2005, “Determinants of Board Size and Composition: A Theory of Corporate Boards,” Journal of Financial and Quantitative Analysis 40: 283-306. Sadgrove, K., 1996, The Complete Guide to Business Risk Management, Gower
Publishing Company, Hampshire, England.
Shank, J. and J. San Miguel, 2009 “Merging Financial and Managerial Accounting: Strategic Cost Management and Enterprise Risk Assessment- under SOX,” Journal of Corporate Accounting & Finance 20 (2): 83-99.
Sharfman, M. and C. Fernando, 2008, “Environmental Risk Management and the Cost of Capital,” Strategic Management Journal 29: 569-592.
Slywotzky, A. and J. Drzik, 2005, “Countering the Biggest risk of All,” Harvard Business Review 83(4): 78-88.
Stulz, R., 2003, Risk Management and Derivatives, South-Western Publishing Company, Mason, Ohio.
Wright, P., M. Kroll, J. Krug, and M. Pettus, 2007, “Influences of Top Management Team Incentives on Firm Risk Taking,” Strategic Management Journal 28: 81-89.
Zhang, I., 2007, “Economic Consequences of the Sarbanes-Oxley Act of 2002,” Journal of Accounting and Economics 44: 74-115.
國科會補助計畫衍生研發成果推廣資料表
日期:2011/10/10國科會補助計畫
計畫名稱: 企業風險管理對於公司治理及企業社會責任之影響 計畫主持人: 陳彩稚 計畫編號: 99-2410-H-004-081- 學門領域: 會計無研發成果推廣資料
99 年度專題研究計畫研究成果彙整表
計畫主持人:陳彩稚 計畫編號:99-2410-H-004-081- 計畫名稱:企業風險管理對於公司治理及企業社會責任之影響 量化 成果項目 實際已達成 數(被接受 或已發表) 預期總達成 數(含實際已 達成數) 本計畫實 際貢獻百 分比 單位 備 註 ( 質 化 說 明:如 數 個 計 畫 共 同 成 果、成 果 列 為 該 期 刊 之 封 面 故 事 ... 等) 期刊論文 0 0 100% 研究報告/技術報告 0 0 100% 研討會論文 0 0 100% 篇 論文著作 專書 0 0 100% 申請中件數 0 0 100% 專利 已獲得件數 0 0 100% 件 件數 0 0 100% 件 技術移轉 權利金 0 0 100% 千元 碩士生 2 2 100% 博士生 0 0 100% 博士後研究員 0 0 100% 國內 參與計畫人力 (本國籍) 專任助理 0 0 100% 人次 期刊論文 0 0 100% 研究報告/技術報告 0 0 100% 研討會論文 0 0 100% 篇 論文著作 專書 0 0 100% 章/本 申請中件數 0 0 100% 專利 已獲得件數 0 0 100% 件 件數 0 0 100% 件 技術移轉 權利金 0 0 100% 千元 碩士生 0 0 100% 博士生 0 0 100% 博士後研究員 0 0 100% 國外 參與計畫人力 (外國籍) 專任助理 0 0 100% 人次其他成果