總統選舉對法國和台灣股票市場的影響 - 政大學術集成
96
0
0
全文
(2) . 總統選舉對法國和台灣股票市場的影響 Impacts of Presidential Elections on the Stock Markets of France and Taiwan. Student: Quentin Lestra. 研究生:雷坤霆 指導教授:蔡政憲. 立. Advisor: Jason Tsai 治 政 大. ‧ 國. 學 國立政治大學. ‧. 商學院國際經營管理英語碩士學位學程. y. A Thesis. n. a. er. io. sit. Nat. 碩士論文. v. i l to Submitted C International MBAnProgram. i U. h. e n g c hUniversity National Chengchi. in partial fulfillment of the Requirements for the degree of Master in Business Administration. 中華民國一〇三年六月 June 2014.
(3) . Acknowledgements The completion of this thesis has a special meaning, as it emphasizes the end of my student life. My first thanks go to National Chengchi University and Pr. Jason Tsai, my thesis advisor. The teaching quality and the great facilities of the university definitely played an important role in my well-being and the success of this research. As part of the first students who enrolled a double degree between NCCU and my school back in France, I would like to thank Iéseg School of Management, which gave me this incredible opportunity and the necessary. 政 治 大. background to complete the IMBA program in Taiwan.. 立. My thoughts at this moment go to my parents, who always supported my studies and allowed. ‧ 國. 學. me to experience adventures I would never have thought about a few years ago. My whole family has so much importance for me and I am really happy to count on them, in any. ‧. situation.. Nat. sit. y. I would like to thank my lovely girlfriend Fiona. It has been an incredible year again by her. al. er. io. side, experiencing the world as we both want. I could not be more thankful for what she is. n. constantly doing for me. Her presence aside me had a great role in my success this year.. Ch. engchi. i n U. v. I cannot forget to mention Michael and Elodie. We wrote our different research together this semester and it was simply amazing to have their company. They really helped to make this semester very smooth and enjoyable. Not only they are great workers but also great persons. Finally, I would like to thank Taylor, Cyril, Nima, Nina, Jessica, Hannah and Edouard. Those persons I did not know (for the majority) one year ago became my best friends and participated to every moment of my Taiwanese life. Their support and affection have been so enjoyable and helpful for both my personal and student life. I could not be more thankful and happy.. i.
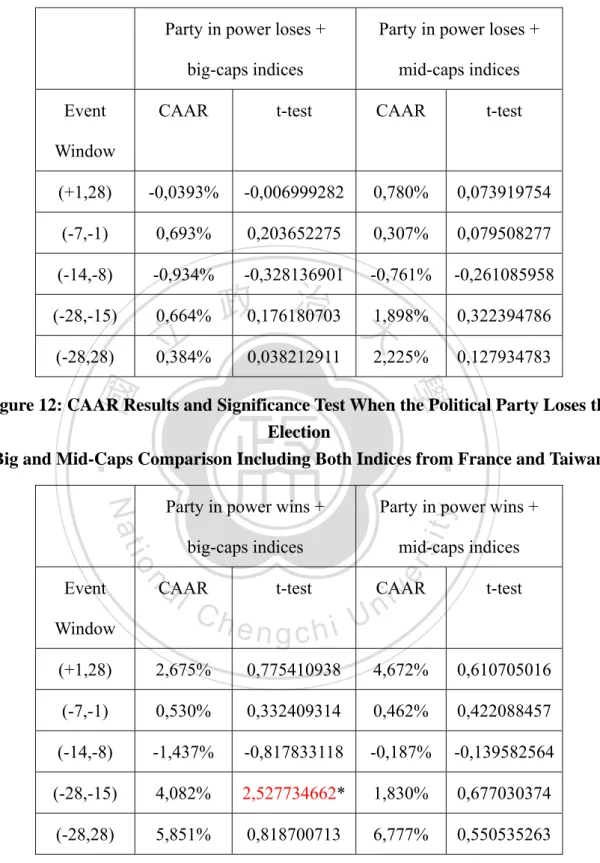
(4) . Abstract Impacts of Presidential Elections on the Stock Markets of France and Taiwan By Quentin Lestra The relationship between politics, especially presidential elections, and stock markets has been a topic widely covered in the United States. We propose in this research to focus on France and Taiwan, two free countries regarding the civil rights and politic liberties, with a. 治 政 direct presidential election system. We will put them in大 perspective and analyse if similarities 立 and differences can be identified, regarding the presidential market cycles and the presence of ‧ 國. 學. abnormal returns around presidential elections, in comparison of the US. Regarding the. ‧. presidential market cycle analysis, a very close, but not significant pattern has been found for both French indices compared to the US. The TAIEX in Taiwan shows a very different. y. Nat. io. sit. pattern as Yearly Average Return are alternatively positive and negative, suggesting two. n. al. er. cycles in a presidential term. This observation is not applicable for big and mid-caps indices. Ch. i n U. v. in Taiwan. In addition, not any significant differences have been found between the YAR of. engchi. big and mid-caps indices for the two countries respectively. Analysing the abnormal returns, significant positive CAARs are found for Taiwan big and mid-caps. For the big-caps index, this result is found for the (-28, 28) period while for the mid-caps, the associated period is (-28,-15) days before the election. The loss of the incumbent shows significant strong negative CAAR for the 1-month period prior and after the elections. The win of this one shows significant positive CAAR for the period associated to the 15 first days of the presidential campaign. The win of the party in power shows the same results, only when we consider big-caps indices.. ii.
(5) . TABLE OF CONTENTS 1.. Introduction ...................................................................................................................... 1. 2.. France-Taiwan: Backgrounds. Specific Focus on Political Rights, General History,. Political System and the Stock Exchange in the Two Countries .......................................... 3. Presidential Elections and Market Cycles ................................................................ 18. 3.3.. The Efficient Market Hypothesis: EMH .................................................................. 28. 3.4.. Previous Findings on Abnormal Returns around Presidential Election in the US ... 31. 3.5.. France-Taiwan: A Few Findings ............................................................................... 33. 學. 3.2.. ‧. y. sit. n. al. er. io. 5.. 3.1.. 治 政 大 Business and Market Cycles ..................................................................................... 14 立. Nat. 4.. Literature Review ........................................................................................................... 14. ‧ 國. 3.. Ch. engchi. i n U. v. Market Cycles Study ...................................................................................................... 35 4.1.. Data........................................................................................................................... 35. 4.2.. Methodology............................................................................................................. 37. 4.3.. Presentation of Results ............................................................................................. 40. Cumulative Average Abnormal Returns Study ........................................................... 48 5.1.. Data........................................................................................................................... 48 iii.
(6) . 6.. 5.2.. Event Study Methodology and Abnormal Returns ................................................... 51. 5.3.. Presentation of Our Results ...................................................................................... 69. Limitations of Our Model .............................................................................................. 84. Reference ................................................................................................................................. 87. 立. 政 治 大. ‧. ‧ 國. 學. n. er. io. sit. y. Nat. al. Ch. engchi. iv. i n U. v.
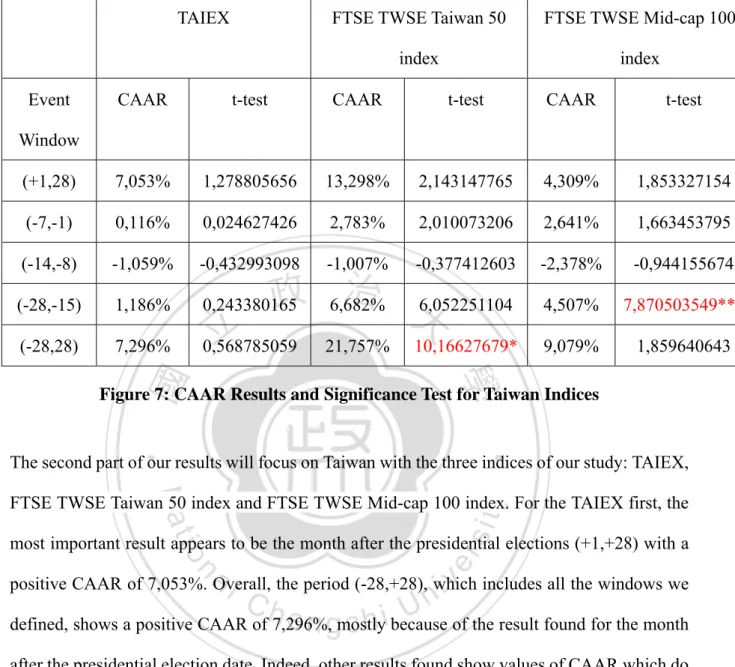
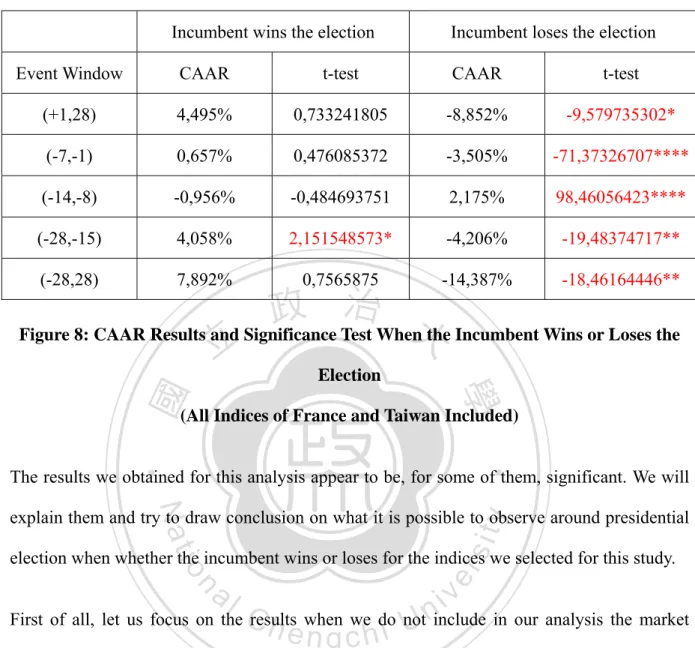
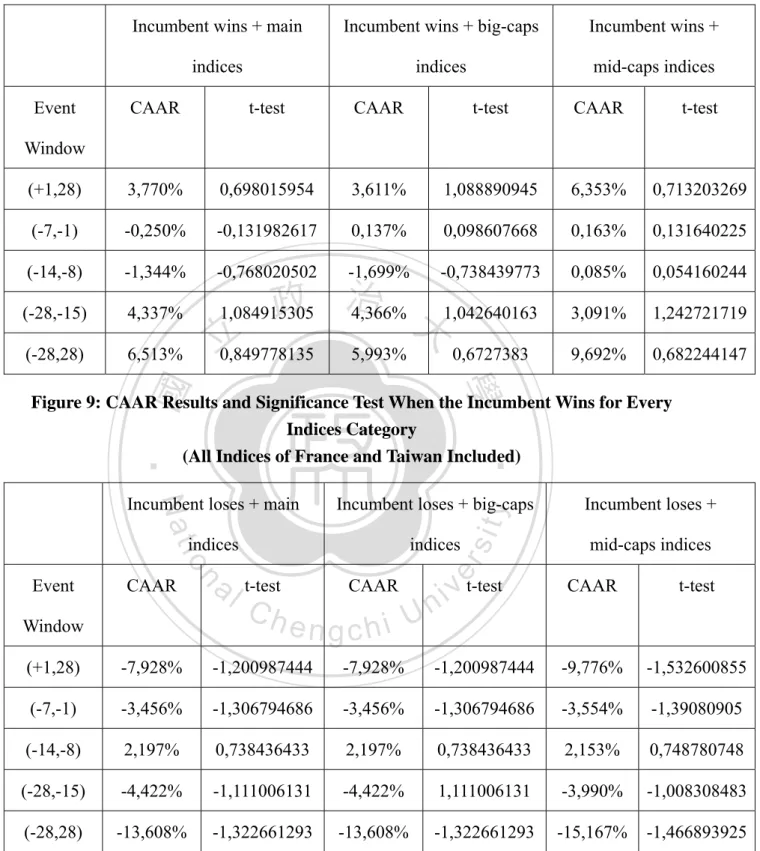
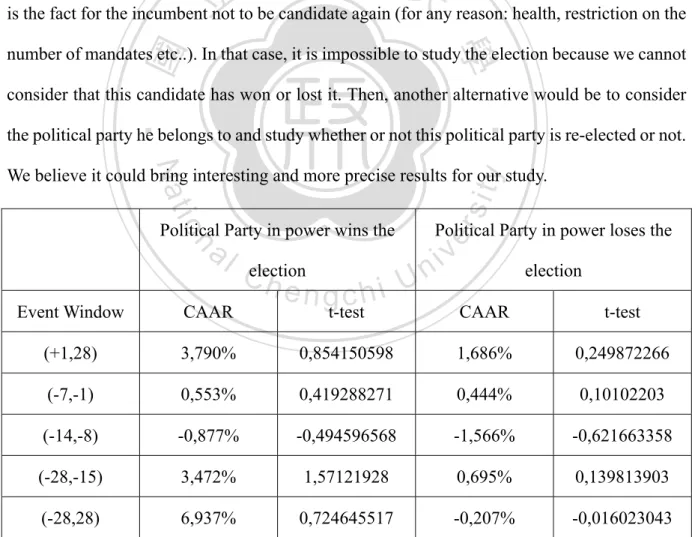
(7) . List of Figures and Tables Graph 1: TAIEX Weekly Performance from 1994 to 2013 ...................................................... 11 Graph 2: CAC 40 Index Weekly Performance from 1988 to 2013 .......................................... 13 Graph 3: Business Cycle and Relative Stock Performance ...................................................... 17 Figure 1: YAR on the CAC 40 Stock Index: 5 Years Presidential Term .................................. 41 Figure 2: YAR on the CAC-Mid 60 Stock Index: 5 Years Presidential Term .......................... 42. 政 治 大. Figure 3: YAR on the TAIEX Stock Index: 4 Years Presidential Term .................................... 44. 立. Figure 4: YAR on the FTSE TWSE Taiwan 50 Stock Index: 4 Years Presidential Term ......... 45. ‧ 國. 學. Figure 5: YAR on the FTSE TWSE Mid-Cap 100 Stock Index: 4 Years Presidential Term .... 45 Figure 6: CAAR Results and Significance Test For France Indices ........................................ 70. ‧. Figure 7: CAAR Results and Significance Test for Taiwan Indices......................................... 72. sit. y. Nat. Figure 8: CAAR Results and Significance Test When the Incumbent Wins or Loses the. n. al. er. io. Election ............................................................................................................................. 75. v. Figure 9: CAAR Results and Significance Test When the Incumbent Wins for Every Indices. Ch. engchi. i n U. Category ........................................................................................................................... 78 Figure 10: CAAR Results and Significance Test When the Incumbent Loses for Every Indices Category ........................................................................................................................... 78 Figure 11: CAAR Results and Significance Test When the Political Party Wins or Loses the Election ............................................................................................................................. 80 Figure 12: CAAR Results and Significance Test When the Political Party Loses the Election .......................................................................................................................................... 82 Figure 13: CAAR Results and Significance Test When the Political Party Wins the Election 82. v.
(8) . 1. Introduction The relationship between politics and stock market and especially, how the presidential elections impact financial markets has been a research topic widely covered in the United States during the past decades. Researchers focused on examining either the short-term or long-term effects of the presidential elections on stock market. The short-term analysis generally focuses on the study of abnormal returns for the periods prior and after the election day, close to this one.. 政 治 大. In this case, the abnormal returns are most likely studied on a daily or monthly basis. The. 立. long-term analysis, on the other way intend to focus on the identification of a “presidential. ‧ 國. 學. election cycle”, working on a four-year period which is the length of a presidential term in the United States. In this case, researchers try to identify stock market patterns around the. ‧. presidential elections to see if a relationship can be established between them. If, throughout. sit. y. Nat. times, the researches about politics and stock markets have widely focused on the impact of the. n. al. er. io. presidential elections, it is because this event is considered as the most important in the political. v. life of a country. Therefore, among the different elections conducted in a country the. Ch. engchi. i n U. presidential elections will be the ones having the greatest impact on the stock market. Our thesis topic, “France-Taiwan: Impact of Presidential election on stock market indices: an empirical study”, will use the previous findings made in the United States as a base for a literature review and extend the analysis to two different countries for which only few researches have been conducted before. The purpose to this thesis is to bring a new knowledge regarding the relationship between the presidential elections and their impact on stock markets. Not only, we will focus on France and Taiwan, two countries that previous researches were not focusing on, but we will also introduce new factors of study, not used. 1.
(9) . before in the United States, that we believe to be interesting to understand better this relationship and bring a new view on it. The first part will be dedicated to a long-term study of the impact of these elections on stock market indices for both France and Taiwan while the second will focus on the short-term impact of the presidential elections on the different indices we selected for this study. Focusing on market cycles and abnormal returns will be the way for us to understand this. 政 治 大. relationship and answer our questions:. 立. 1) Is it possible to identify a US-like market cycle pattern for France and Taiwan?. ‧ 國. 學. 2) Are there significant differences in Yearly Average Returns between big and mid-caps indices during the presidential term?. ‧. 3) Is it possible to identify significant abnormal returns for periods prior and after the. Nat. sit. y. presidential elections for both countries and the indices we defined?. n. al. er. io. 4) Does the presidential election impact big and mid-caps indices differently?. i n U. v. 5) Does the outcome of the election (Incumbent wins or loses; Political party in power. Ch. engchi. wins or loses) impact the presence of abnormal returns for our period of study?. 2.
(10) . 2. France-Taiwan: Backgrounds. Specific Focus on Political Rights, General History, Political System and the Stock Exchange in the Two Countries The main goal of this study is to determine with two different analysis how the presidential elections affect (or not) the stock market and its indices for both France and Taiwan, the. 政 治 大 analysis to answer our specific question, we need to understand the political background and 立 countries selected to conduct this research. Before entering into the empirical studies and the. ‧ 國. 學. the current political situation in these two countries. We will also focus on the development of stock exchanges and the main indices for France and Taiwan to determine which ones will be. ‧. used as references in our research. This will allow us to have a complete understanding of the. sit. y. Nat. global situation and will help us to determine the data we will use to conduct our research.. er. io. France-Taiwan: Politics and rights. al. n. v i n C h and individual U Information regarding politics, freedom e n g c h i rights for each of the two countries will. be extracted from independent and neutral sources. It will guarantee the accuracy and objective point-of-view on the situation in France and Taiwan. The organization Freedom House is one of them, as it can be described as “an independent watchdog organization dedicated to the expansion of freedom around the world. Freedom House acts as a catalyst for freedom through a combination of analysis, advocacy and action. Our (Freedom House organization) research and analysis frames the policy debate […] abroad on the progress and decline of freedom.” Hence, it is possible to use the different analysis from this organization to explain, with as much objectivity as possible, the political situation in these two countries. 3.
(11) . First of all, we will focus on the 2014 Freedom in the world map realized by the organization. The rating proposed in the analysis has been established on a 1 to 7 scale, 1 being the highest possible grade and 7 the worst. To determine the freedom rate for every country in the world, the organization takes into account different factors that can be divided in two main sections: -. Political rights. It includes the electoral process, political pluralism and how the government works (if this one can be reliable and trustful based on its transparency).. -. 政 治 大 associational and organizational rights are analyzed to determine the grade of this 立 Civil liberties. Freedom of expression, individual rights, the rule of law and the. ‧ 國. 學. section.. The general methodology of the research conducted by the organization is derived from the. ‧. Universal declaration of human rights. The freedom of press, which is also an important. Nat. sit. y. element to take into account, is not part of the general rating but the base of an independent. n. al. er. io. study. Both countries are given the status of having “Free press”. This result is particularly. i n U. v. outstanding as only 14.5% of the world’s citizens live in countries that “enjoy a free press”,. Ch. engchi. according to the organization. The freedom of press is a factor that helps reflecting the degree of democracy of a country as a government taking control of media is often an indicator of democratic institutions future assault. The good rating of France and Taiwan regarding this factor translates well that they are both ruled under democratic regimes. Regarding the general rating, France is rated as a free country and this, with the highest grade of 1.0. In fact, both the political rights and the civil liberties ratings reached the highest mark on their grading scale. On the other side, Taiwan also has the status of “free country”. The freedom rating grade given by the organization is 1.5. This is 0.5 points lower than the French grade. The 4.
(12) . explanation can be found in the civil liberties rating which did not reach the highest grade with 2 points. Nevertheless Taiwan is, according to Freedom House, with Japan the freest country in Asia and the political rights in Taiwan are given the highest grade of 1.0 by the organization. These results are important in the conduct of our research as the two countries of our study have the status of free country. The freedom factor, as a consequence, won’t affect our analysis and bring bias in our study. Otherwise, we would have had to incorporate this element in our. 政 治 大. comparison and make a clear distinction between a “free” country and a “less-free” country.. 立. How Taiwan has become what it is nowadays?. ‧ 國. 學. This is in 1949 that the island of Taiwan has become the place of retreat for the Kuomintang. ‧. (KMT) “Republic of China” after the defeat in the civil war against the Communism of Mao. sit. y. Nat. Zedong. Chang Kai-Chek was, at the time, the leader of the political party and remained the. io. er. president of the Republic of China (R.O.C) until his death in 1975. He claimed the existence of a unique China (the R.O.C) and withdrew from the United Nation Security Council after the. al. n. v i n C h of China) in 1971. admission of the PRC (People Republic e n g c h i U Under its politic, Taiwan was ruled. under a unique party and a martial law system, finally abolished in 1987 by his son. Chang Kai-Chek highly contributed to the economic development of the island, increasing substantially exportations. After the death of Chiang Ching-Kuo in 1988, son of Chiang Kai-Shek who allowed more Taiwanese to take up political decision, Lee Teng-Hui became the first Taiwanese born ROC president. This president will bring some major change in the Taiwanese political system. In fact, he will be at the origin of the first open elections in Taiwan, in 1996 and also the first legislative elections in 2001. The relationship with China has remained really complicated during the presidency of Lee. First, working in for the “one China 5.
(13) . policy”, he developed throughout times a more pro-independence politic. It led China (PRC) to launch a series of missiles close to the coast of Taiwan in 1995. Being re-elected in 1996, he didn’t accept the proposition made by China offering to lift the ban on direct flights and shipping between the two territories. The year 2000 had brought a major change in the political landscape of Taiwan. In fact, for the first time since the retreat from China, the KMT was no longer the political party in power. The newly elected president, Chen Shui-Bian, is from the DPP (Democratic Progressive Party) political party, main political opposition of KMT in. 政 治 大. Taiwan. This is after his re-election in 2004 that the cross-strait relationship between R.O.C and. 立. PRC worsen and reached a peak in tension, with the announcement of an “anti-secession law”,. ‧ 國. 學. in 2005. This law granted mainland China the right to use force and attack Taiwan, should the island declare its own independence. With the election of the current Taiwanese president, Ma. ‧. Ying-Jeou, in power since 2008, the tensions between the two governments has decreased and. Nat. sit. y. the relationship considerably improved. President Ma defined a new policy called the “three. n. al. er. io. noes”: No unification, no independence and no use of force. The concrete facts regarding this. i n U. v. relationship improvement were the signature of an economic cooperative agreement in 2010. Ch. engchi. and an historical meeting between two representatives in 2014, in the Chinese city of Nankin, the first official one since 1949. The political system in Taiwan can be defined as a semi-presidential system. Taiwan is “multiparty democratic regime” that combines elements of both parliamentary and presidential democracy. The president of Taiwan is elected for a maximum of two four-year terms. He is the head of the state but also the one who holds executive power. He is responsible to nominate the prime minister (the premier) who is the head of the government and president of the executive Yuan (“house” in Mandarin). The legislative power (law-making) is hold by both the. 6.
(14) . government and the parliament. In Taiwan the judiciary is independent from the executive and legislative power. The three main parties in Taiwan are the following: the Kuomintang, the Democratic Progressive Party (Minjindang) and the People first party (Qinmindang). We will consider 5 presidential elections in our study as 5 elections have been hold in Taiwan since 1996 (1996, 2000, 2004, 2008 and 2012). How France has become what it is nowadays?. 政 治 大. Since the French revolution of 1789 and the declaration of the rights of man and of the citizen,. 立. France has known 15 different constitutions with their own specificities and three kind of. ‧ 國. 學. regime: empire, constitutional monarchy and parliamentary republic. This is in 1848 that France experienced its first direct election. The country will have to wait more than 200 years to. ‧. have this experience again. After two different empires during the nineteenth century, ended in. Nat. sit. y. 1870, the republic has become the only regime in France with the laws designed by Jules Ferry.. n. al. er. io. The country has been involved in the World War I from 1914 to 1918 and the World War II from. i n U. v. 1939 to 1945 and has considerably suffered, as all the countries involved, from these two events.. Ch. engchi. The recovery, during the next thirty years, named by the French economist Jean Fourastié “les trentes glorieuses” (The glorious thirty in English), marked a period of fast growing economy (high GDP and employment rate) and demography in France. This is in 1958 that France has become, under the impulsion of General de Gaulle, a parliamentary constitutional republic with a presidential regime, also called semi-presidential system. The direct election process was finally re-established in 1965 and continues operating at the time this thesis is written. From an historical point-of view, France has been run mostly by right-wing parties. The first time a “socialist” (left-wing side) president was elected was in 1981 with François Mitterrand. He stayed a total of 14 years at the head of the French government as he was re-elected in 1988. 7.
(15) . This is then Jacques Chirac by two times and Nicolas Sarkozy who occupied this function. The last election of 2012 promoted François Holland, the second socialist president of the French history. So as Taiwan, the French political system is a semi-presidential system. The government of the French Republic is determined by the French constitution of the fifth republic (Every time the French government changes the constitution, a new republic is created). The president is the. 政 治 大 the National Assembly (lower house of the parliament). The other part of the parliament is 立 head of the state. He shares the executive power with its prime minister who can be revoked by. ‧ 國. 學. called the Senate (“Sénat” in French). Together, the National Assembly and the Senate form the Legislative branch of the French government. The judiciary part is also independent.. ‧. For our analysis, we want to consider the elections that happened in France since 1965. The. Nat. sit. y. reason for this choice is that the specific election that occurred that year was the first direct one. n. al. er. io. and this, since the second republic in 1848. Nevertheless, as we will see in the next part. i n U. v. dedicated to the study of stock exchange and stock market indices for France and Taiwan, the. Ch. engchi. CAC 40, main index in France, was only implemented in 1987. This date will be then the starting point of our study and will take into account the following presidential elections in France for our study: 1988, 1995, 2002, 2007 and 2012. The presidential term used to be 7 years until it was decreased to 5 years, in 2000. This will be an important factor to take into account in the economic cycle analysis for France (Nevertheless, it won’t affect our abnormal return study).. 8.
(16) . The stock exchange in Taiwan The information directly linked to the history of stock exchanges and main indices for both France and Taiwan will mainly be extracted and analyzed from the respective stock exchange website of these countries that are believed to be the most transparent and accurate source of information regarding this specific topic. The Taiwan Stock Exchange TSEC has been founded in 1961 and officially began to operate on. 政 治 大. 9th February 1962. After its first year of existence, the stock exchange only had 18 listed. 立. companies. Since that time, the number of listed companies has grown substantially to reach the. ‧ 國. 學. number of 809, the 31st December 2013 with a total market capitalization of NTD 24,291,518 million or, in other words, USD 813 billion (calculations realized with the USD/NTD exchange. ‧. rate on the 31st of December 2013).. sit. y. Nat. io. er. Foreign investors have historically faced several limitations to invest set by the Taiwan Stock Exchange. These restrictions are common on emerging stock market and are implemented with. al. n. v i n the main purpose to increase the C probability investors’ success, reducing volatility and h e n gofclocal hi U speculation. Nevertheless, in 1991, the TSEC allowed Qualified Foreign Institutional Investor (QFII) to realize investments in the Taiwanese stock market. The logical following step was to give this right to individuals (natural person). It happened in 1996 with the creation of investment quotas. Nowadays, there are no limitations on offshore investments and quotas only apply for onshore investments. Inwards and outwards payments are limited to $50 million per year for Foreign Institutional Investor and $5 million for Overseas Chinese and Foreign. Individual Investors. Nevertheless, except for some specific companies, limitations on the ratio of shareholding have been cancelled. According to the statistics conducted by the Taiwan Stock 9.
(17) . Exchange, 33,5% of the shares were hold by foreign investors, by the end of September 2012. It seems that the domestic investors are mostly individual (rather than institutional) at the proportion of 80.2% whereas 99.5% of the foreign investments come from institutions (end of 2012). Finally, it is possible to say that the Taiwan Stock Exchange receives most of its investments form individuals (62.5%). This characteristic shows for example the difference between this stock exchange and the more mature US stock market, led by institutional investors.. 立. 政 治 大. The Taiwan Stock Exchange Capitalization Weighted Stock Index is the main stock index in. ‧ 國. 學. Taiwan. It has been released in 1967 by the Taiwan Stock Exchange using 1966 as the year of reference, with a base of one hundred. This index is the most important in Taiwan as it is. ‧. weighted by all the listed stocks at the TSEC. This is the reason why we can say that the TAIEX. Nat. er. io. sit. y. is a good indicator of the general economic condition of the island.. With the purpose of further development, the Taiwan Stock Exchange Corporation found an. al. n. v i n agreement with the global indexCprovider through a joint-venture. It allowed them to h e n FTSE gchi U. create the FTSE TWSE Taiwan Index Series, a second index series composed by 7 different indices to bring more differentiation in the local stock exchange. The main new feature is the division of companies’ market capitalization in two different indices: -. The FTSE TWSE Taiwan 50 index, listing the 50 first biggest market capitalization stocks on the Taiwan Stock Exchange. The stocks represent in total 70% of the Taiwanese market. It was launched in 2002 with an index base value of 5,000.. 10.
(18) . -. The FTSE TWSE Mid-Cap 100 index, as its name suggests, includes the 100 next market capitalizations which can be described as “Mid-Cap”. The stocks represent 20% of the Taiwanese market. This index was launched in 2004 with an index base value of 5,000.. 立. 政 治 大. ‧. ‧ 國. 學. Graph 1: TAIEX Weekly Performance from 1994 to 2013. sit. y. Nat. io. n. al. er. The stock exchange in France. i n U. v. The first Stock Exchange appeared in France in 1540 in the city of Lyon. At that time,. Ch. engchi. companies’ stocks were not listed nor traded. The Stock Exchange was considered as a place for merchants to negotiate goods and bills of exchange, which were the contracts used by people for business. This is finally in 1724 that the Paris Stock Exchange was created under the name ‘Bourse de Paris’. It moved in Palais Brogniart in 1826, built under the emperor Napoleon Bonaparte, where it stayed during more than 150 years. In the early 19th century, only 7 stocks were traded. At the end of the century, it was around 800 stocks that were listed and could be traded on the Stock Exchange. The place was first forbidden to women, who finally gained the right to enter the Stock Exchange and realize trades in 1967. The stock exchange will continue. 11.
(19) . its modernization and development, especially with a strong computerization during the 1990’s and the creation of the CAC (Continuous Assisted Quotation) system in 1986. The year 2000 has been critical in change for the Paris Stock Exchange. In fact, the Stock Exchange of Paris, Amsterdam and Brussels merged to a unique entity named Euronext. The Stock Exchange of Lisbon and Porto (Portugal) integrated the group after having been bought in 2002. The same year, the London International Financial Future and Options Exchange (LIFFE) followed the same way. These consecutives mergers reached a new peak in 2007 with the creation of NYSE. 政 治 大. Euronext, which is the result of the merger between the New-York Stock Exchange and. 立. Euronext. The newly formed group is, since its creation, the worldwide 1st group of Stock. ‧ 國. 學. Exchanges (the capitalization of the entity reached US$ 14,085.9 billion in 2012).. ‧. The main French stock market index is named CAC 40. This index tracks the forty largest. sit. y. Nat. French stocks, based on their market capitalization. Like the TAIEX in Taiwan, the CAC 40 is a. io. er. capitalization-weighted index. This index is a benchmark for the French stock market and can be compared with the Dow Jones in the United States in the sense that it shows well the trend,. al. n. v i n overall level and direction of the C market. The CAC 40 was set the 31 U hen i h gc. st. December 1987 and had. the base value of 1000. It ended the year 2013 with a value of 4295.5 points.. 12.
(20) . 治 政 Graph 2: CAC 40 Index Weekly Performance 大 from 1988 to 2013 立 ‧ 國. 學. Different other indices exist to track stocks with lower market capitalization. The CAC mid 60 is an index that includes 60 stocks with middle capitalization (mid-caps). From 2005 to 2011. ‧. this index was called the “CAC mid-100” and included at the time 100 stocks of this type.. sit. y. Nat. NYSE Euronext Paris decided to re-organize its indices in 2011 in order to add more dynamism. n. al. er. io. in the stock exchange, trying to increase the investment in companies with smaller market. v. capitalization (small and mid-caps). Another index, the CAC Small, former CAC Small 90,. Ch. engchi. i n U. regroups the small capitalization of the stock exchange. It used to track 90 stocks but the index is, since the 2011 reform, allowed to track an unlimited number of small capitalization stocks.. 13.
(21) . 3. Literature Review 3.1.. Business and Market Cycles. Business cycles: Definition The answer to our research question will be determined through two different studies that will lead us to a general conclusion. The first study will be conducted with the purpose to identify market cycles around presidential elections for the selected indices of France and Taiwan.. 治 政 Before going through the past studies and findings in the大 next part of this literature review, we 立 need to understand the general concept of market cycles. To see how cycles occur on financial ‧ 國. 學. markets, we need first to remind a really well-known economic theory that has been discussed. ‧. for many years: Business cycles. This first step is mandatory as business and market cycles are really closely linked. The purpose of this first part of literature review is then to understand. y. Nat. io. sit. what business cycles are, how to identify them and what the main explanatory theories are.. n. al. er. Once this will be done, it will be possible to find out the nature of the relationship between. Ch. i n U. v. economic and market cycles to enter the second part of our literature review.. engchi. First of all, the economic activity fluctuates over time. These fluctuations, divided in period of expansion (upswing of economy), recession, depression (downswing of economy) and recovery, define business cycles. This is in 1946 that the two economists Burns and Mitchell gave the definition of business cycles, still applicable nowadays, in their book called Measuring Business Cycles: “Business cycles are a type of fluctuation found in the aggregate economic activity of nations that organize their work mainly in business enterprises: a cycle consists of expansions. 14.
(22) . occurring at about the same time in many economic activities, followed by similarly general recessions, contractions, and revivals which merge into the expansion phase of the next cycle; in duration, business cycles vary from more than one year to ten or twelve years; they are not divisible into shorter cycles of similar characteristics with amplitudes approximating their own.” The methodology to determine business cycles is, in general, very similar between the. 政 治 大 for example, the National Bureau of Economic Research (NBER) is the institution which 立 institutions responsible of this work but may vary in some specific points. In the United States. ‧ 國. 學. determines the Business cycles dates in the country. Their methodology to define a recession. period differs from the financial press in the sense that the Bureau does not base it on a “two. ‧. consecutive quarters of decline in real GDP”. Rather, for the organization, a recession “is a. sit. y. Nat. significant decline in economic activity spread across the economy, lasting more than a few. io. er. months, normally visible in real GDP, real income, employment, industrial production, and wholesale-retail sales”. Period of expansions are determined, on the other way around, by a. al. n. v i n significant increase in economic C activity. definitions, from the NBER, help us to have a U h e nThese i h gc clear understanding on the process and methodology used to identify business cycles. During. the history, many different theories have come out to explain the presence of business cycles in our economy. On one side, John Maynard Keynes and his supporters, the Keynesians, have interpreted the presence of business cycles as a sign of market failure. They encouraged the intervention of the state and the use of economic policies in order to minimize the impact of economic activity fluctuations until the optimum level of employment would be reached. The main alternative point-of-view has been given by the Neoclassical Macroeconomics supporters through the name of Real business cycle theory. Kydland and Prescott were the main. 15.
(23) . contributors to this theory which explains the business cycles by the presence of technological shocks. These shocks can be seen as a change in the level of productivity. If we think from a “demand-supply model” point-of-view, it would be interpreted as shifts of the supply curve at different point of time. As a result, each time the supply curve shifts from a side or another, a new equilibrium (intersection point between demand and supply) would be found. The economy would then fluctuate and create cycles according to the equilibrium change between demand and supply. The supporters of this theory do not call for a state intervention in the. 政 治 大. economy. For them, it could even worsen the situation. In this sense, this theory differs and. 立. comes in contradiction to the Keynesianism.. ‧ 國. 學. Business and Market cycles: What relationship exists?. ‧. As we mentioned, the first step of our analysis will be to determine whether or not we can. Nat. sit. y. identify financial market cycles in France and Taiwan. The notion of ‘business cycle’, that we. n. al. er. io. tried to briefly explain above, is the most-known but differs from the market cycle in the sense. i n U. v. that it takes into account the GDP to determine the fluctuations of the economic activity of a. Ch. engchi. country while market cycles are the representation of fluctuations on financial markets (index fluctuations for example). Can we find any relationship between business and market cycles? A general relationship exists between them as the stock market tends to be a leading indicator of the business cycle. This is Sam Stovall who proposed in 1995 his model of ‘sector rotation’ which involved the relationship between business and market cycles. In his analysis, investors and stock market try to anticipate the business cycle in order to maximize their benefits (The earliest you can anticipate an upcoming trend in the economy, whether it is a growth or a downturn, the most important the benefit from an investment). The following graph is extracted 16.
(24) . from the book written by Stovall in 1995 called, The S&P guide to Sector Investing and shows well how the stock market cycle (blue color) imitates the business cycle (yellow color) but especially how the first one anticipates the second. Nevertheless, the relationship has been made, only established a relationship between economy and indices (which include a large number of stocks belonging to different industries). This is the reason why the second part of the analysis of Stovall is to identify which sectors are outperforming at different period of time of a business cycle. In, fact, industries behave really differently at certain period of time and. 政 治 大. the analyst is trying to link the performance of the main sectors with economic cycle phases to. 立. give investment recommendations according to this factor. We can see it, also on this graph, by. ‧ 國. 學. the numbers displayed at different points of the cycle. It shows the investors at what time the stocks of each sector should be bought, considering they are outperforming.. ‧. n. er. io. sit. y. Nat. al. Ch. engchi. i n U. v. Graph 3: Business Cycle and Relative Stock Performance. 17.
(25) . 3.2.. Presidential Elections and Market Cycles. Presidential elections and market cycles have been a topic of study for a long time, especially in the United States where different analysis have been conducted to identify cycles in the US markets (mostly indices), understand the reason of this occurrence and see whether or not the party in power has an impact on these cycles. Throughout times, different cycles have been demonstrated: the 28-day trading cycle that many markets appear to follow, the 10.5-month. 政 治 大 January effect stating that the market will follow the trend (rising or declining) seen in January 立. Futures cycle which is a good reflection of the “overall behavior” of commodity prices, the. ‧ 國. 學. for the rest of the year (with an accuracy rate of 86% between 1950 and 1993), the Juglar 9.2-year cycle existing in many areas of economic activity and finally the Kondratieff “wave”. ‧. which is a long-term cycle that only had the time to repeat itself three times in the stock market. sit. y. Nat. so far. Finally, the last one, that some authors like Wing-Keug Wong and Michael McAleer. io. er. liked to call “the most popular cycle” is the four-year cycle also called presidential election or Kitchin wave. Different studies have been conducted to understand and interpret these 4-year. al. n. v i n C h the differenceUof the returns between the first and cycles. Many analysts found significant engchi. second half of the presidential term. In their study for example, Foerster and Schmitz found results that are consistent with most of the analyses that have been done on this topic: The stocks returns are lower the second year of the presidential term. Different explanations have been submitted for the cause of this presidential cycle, especially the assumptions made by Nordhaus (1975), Sachs (1988) and Willet (1989) stating that political parties manipulate business cycles to win elections as they have the incentive, after they have been elected, to pursue deflationary policies and on the other way around, pursue policies that would stimulate the economy to be elected again. Hibbs (1977) and Rogoff (1990) have also come out with. 18.
(26) . alternative explanatory theories that we will develop later in this part. The first article I would like to introduce among all the studies that have been conducted to establish a relationship between presidential elections and the cycles occurring on the market was written by Marshall Nickles in 2004 under the name of Presidential elections and market cycles and is, I believe, very relevant for this literature review. The writer aims to analyze in this paper the relationship between the stock market cycles of the S&P 500 index in the United. 政 治 大 method to identify the cycles of the S&P 500 which regroups the 500 top U.S companies and 立. States and politics, more specifically the presidential elections. He used a “Peak-Trough”. ‧ 國. 學. generally used as a benchmark for tracking the overall stock market. His analysis has been conducted between 1942 and 2002. It is relevant to say that the price data for the index (S&P. ‧. 500) was compiled and averaged on a weekly but not on a daily basis. His first findings were. sit. y. Nat. that full cycles happen every 4.02 years in average for the index divided in “Bull” periods of. io. which is, in average, the period the market will decline.. n. al. Ch. engchi. er. 3.08 years, which is, in average, the period the market will rise and “Bear” periods of 0.94 year,. i n U. v. In his analysis, the author then tried to find a link, a relationship between the cycles of the index that approximates four years and the U.S presidential elections. He did his analysis focusing on the market troughs, identifying the year during the presidential term when the market bottomed. The results of his study are very clear: Troughs occur at an average of 1.87 years into the presidential term (around 2 years). The writer does not tend to explain the reason why the troughs repeatedly occur at that specific time of the presidential term but wants to come out with a precise recurring pattern on financial market. The final purpose of the article is to give potential investment strategies that are based on the political cycles he identified in his study. In fact, he proposed two alternatives investment strategies based on the time the trough occurs in 19.
(27) . the presidential term. To better explain, he took two different periods of the cycle: 1) After the trough (27 months) - From October the 1st of second year of presidential term through December 31 of election year. This is the investment strategy number 1. 2) Before the trough (21 months) – From January the 1st of inaugural year through September 30 of second year of Presidential term. This is the investment strategy number 2.. 政 治 大. The author realized a simulation for both strategies with an initial capital of 1,000$ with a. 立. recurring investment in the S&P 500 during the specific time period he allocated to the different. ‧ 國. 學. strategies, and this, for each presidential election. His final results are eloquent: The first investment strategy brought 7,170% of return on the initial investment while the second one. ‧. incurred a loss of 36 % over the 5 decades of study. It seems pretty clear that the link between. Nat. sit. y. market cycles and presidential terms can bring opportunities for investment strategies.. n. al. er. io. Nevertheless, the writer warns us from the possibility of other patterns and cycles, and. i n U. v. explicitly tells that this paper does not intent to forecast the stock market.. Ch. engchi. This first paper has given us the main insights of what we should know about the presidential cycle. In this paragraph, we will focus on the revised version of the research paper Mapping the Presidential Election Cycle in US Stock markets, written by Wing-Keug Wong & Michael McAleer. This one will be relevant in our literature review as the main purpose of the writers was to show the close relationship between presidential election and the US stock prices, trying to identify cycles and point out the existence of a peak at a certain time of the presidential term period. Their study is also going further than the previous article analyzed in this literature review. In fact, they aim to explain the existence of those cycles and find an answer in what they 20.
(28) . called “policy manipulation” by the politics. They also try to suggest which party, between the republican and democrats, may have greater cause to engage in this kind of “manipulation”. We will come back on these points later in our analysis. To conduct their research, they will use a spectral analysis to estimate the period of the cycles and adopt the EGARCH model to examine them, as they want to take into account the time dependence and the conditional heteroskedasticity in stock returns, what t-test and simple. 政 治 大. regression analysis ,which are normally used for this type of analysis, don’t.. 立. The data used for their analysis is the S&P index, on a weekly basis from 1 January 1965 to 31. ‧ 國. 學. December 2003. The Data has been extracted from DataStream. Before realizing a “spectral analysis”, authors want to avoid bias on their results by checking the stationary property of the. ‧. S&P index, its returns but also its logarithm. It is proved as only the stock returns are stationary.. Nat. sit. y. Hence, the cycles will be analyzed with the returns series. The existence presidential election. n. al. er. io. cycles is confirmed with the spectral analysis. It is shown that the stock index trough will occur. i n U. v. during the second year (It concords with the first analysis of Nickles who found out a through. Ch. engchi. was happening at an average of 1.87 year). Nevertheless, we also learn something new in this study. The peak is reached during the third of fourth year of the presidential term. It would suggest that the peak is reached right before the election event. Those latest analyses come to confirm the one that have previously been done on this topic. In fact, in an early study of the relationship between stock market returns and the presidential election cycle, Allvine and O’neill built their analysis extracting data from the S&P 400 between 1948 and 1978 with the main purpose to analyze the returns of the index: According to their findings, the first two years of the presidential term, the returns of the index 21.
(29) . averaged respectively 0.6% and 0.7%, which is much lower than the returns observed in average for the second half of the presidential term (year 3 and 4). In fact, the results show average returns of 22,1% for the third year of the presidential term and 9.2% for the fourth year. This discovery suggest the pattern of a presidential election cycle divided in two parts with an increase of returns (stock index price) during the second half of the term and a decrease of returns (stock index price) during the first half of the term. The average increase is the highest during the third year, according to their study. Five years after, the data used by Mr. Roger. 政 治 大. Huang showed that stock returns were systematically higher during the second half of a. 立. political term and this, from 1832 to 1979. In 1995, Gartner and Wellershoff identified this. ‧ 國. 學. four-year cycle for the US stock price with an increase noted during the second half of the presidential term and a decreased noted during the first half. Their findings also show that this. ‧. rule is applicable for different indices but also under both the rule of Republicans and. Nat. sit. y. Democrats. The presence of this presidential cycle is then confirmed, according to their study,. er. io. no matter the political party ruling the country (applicable for the United States).. al. n. v i n Democrats and Republicans areCthe parties in the United States and different U h etwon gmain i h c. comparisons have been done between them to see if the party in power had an impact on this four-year cycle around presidential elections. In the paper Presidential Politics, Stocks, Bonds, Bills, and Inflation Johnson, Chittenden and Jensen examine the returns of the S&P 500 index, from January 1929 to December 1996 and include the Democrats/Republicans factor in their analysis. The particularity of this study is that they use a wider range of data in order to compare them. They use both a small and large-stock index in order to incorporate the size effect in their analysis. Plus, they include bonds (intermediate and long term ones) to their study (former ones were basically using stocks): from corporations and the US government (T-bills).. 22.
(30) . The findings of this study show that the S&P 500 return is higher during Democrats’ terms than Republicans’ ones. Nevertheless, t-test and Wilcoxon test (parametric and non-parametric tests), used to analyze the relevance for the differences in returns, are found not statistically significant. It seems then for the writers that there is no clear relationship between stock returns and the political party the president belongs to. Nevertheless, this statement, accurate for the S&P 500, is not true for the small-stock index. In fact, in their study, the analysts found that returns for small-cap stocks are significantly substantially higher during Democratic administration. 政 治 大. (around four times higher than during Republican administrations).. 立. ‧ 國. 學. It seems, according to their results, that the equity and debt indices react differently to the political party in power. Indeed, the returns for debt index are over twice as high during. ‧. Republicans than Democrats administration. The writers don’t give any approach to explain. sit. y. Nat. those findings but conclude their analysis comforting the previous analysis made regarding the. io. er. four-year cycle: the returns are significantly higher during the second half of the presidential term. They add that the returns are higher, no matter the party elected but “are higher under. al. n. v i n Democrats elections”. AccordingCtohthem, this difference e n g c h i U of returns, dividing the presidential term in two cycles of 2 years each, apply to the equity indices but is not significant when we consider the debt indices (bond returns). In their study, Wing-Keug Wong & Michael McAleer also suggest that the second and third year intervention (from the government to stimulate the market) is significant only when the Republicans lead the country as it does not seem to be the case for the Democrats, according to their study. On the other way, the writers suggest in their study that the stock market seem to perform better under Democrats administrations.. 23.
(31) . We have now seen that a four-year cycle has been identified and Mr. Hirsch focuses, in a research paper published in 2013 on the AAII Journal, on three main seasonal and cyclical patterns he uses to manage his portfolios. He reminds at the beginning that he is a “strong proponent of historical and seasonal market patterns” but he also warns us also saying that the history is not the same from year to year and these methods cannot be used to forecast the market with a complete accuracy. The main reason of the importance of this article in our literature review is the dedication of a part to the four-year presidential election/stock market cycle.. 立. 政 治 大. ‧ 國. 學. The writer starts to remind what has been found by most of the persons studying this cycle, as we explained in our literature review. In his own words, “presidential elections every four years. ‧. have a profound impact on the economy and the stock market. Wars, recessions and bear. sit. y. Nat. markets tend to start or occur in the first half of the term, with prosperous times and bull. io. er. markets in the latter half. This pattern is most compelling”. In his analysis, he uses this time a different index, the Dow Jones. Nevertheless the results are totally similar as the ones. al. n. v i n Cdiscussed: previously found by the authors we 1939, the third year of the presidential term U h e n gsince i h c. has the best performance. We can even say there have been no Dow Jones average losses in the year preceding the presidential election. What makes this article more special is the second part of the article where the author wants to explain the reason of this four-year cycle. For him, the government “manipulates” the economy “to stay in power” and it has, obviously, a direct impact on the stock market. It seems that governments tend to implement the difficult initiatives, laws and policies at the beginning of their term. The reason for this is that they will still have the other half of the term to “catch-up” in the eyes of the electors. According to Mr. Hirsch, the technique consists in jiggling fiscal 24.
(32) . policies to get more disposable income, social security benefits and federal spending while having lower interest rates and inflation. The main purpose is to make the economy looks good to people so that they can vote again for incumbent candidate. It seems then that the movements of the four-year cycle would be explained by the intervention of the US government after the midterm congressional election (especially on fiscal policies) in order to make the economy better, or I would say, looking better than it actually is, to get as many voters as possible.. 政 治 大 Granados) wants to explain the reason of this four-year cycle as he did not do it in his first paper 立. On the same way, in an updated analysis published in 2012, Nickles (in collaboration with. ‧ 國. 學. of 2004 which was, as we have seen in this literature review, an analysis conducted to identify market cycles and recommend some investment strategies. In this new paper, the authors. ‧. remind that the fiscal policies can be defined as “an increase or decrease of taxes or government. sit. y. Nat. spending”. And it seems again pretty clear for the writers that when the presidential election. io. er. approaches (second half of the term), the government proposes tax reductions and an increase in spending for some specific government programs and this, in order to gather the maximum. al. n. v i n Celection. electors and votes before the new also U suggest that governments can also ask h e n gThey i h c some help from the Fed, reducing interest rates and increasing money supplies.. As we can see in some of the research paper selected to develop our literature review, some authors tried to understand the reason of occurrence of this four-year cycle. It was then important to focus more precisely on the three main theories that have been proposed since the first proposal made by Nordhaus in 1975:. 25.
(33) . The opportunistic political business cycle model This model aims to show that the government in power (also called incumbent) tries to manipulate the economy. The reason of this manipulation can be found in the quest of re-election for the current government. Expansionary monetary policy would be used before the presidential election in order to increase the economic activity and get people votes. This is first Nordhaus (1975) who developed this model, later supported by Sachs (1988) and Willet (1989).. 政 治 大 period and pursues deflationary policy after. A strong assumption to the theory proposed by 立. According to them, the government stimulates the economy before the presidential election. ‧ 國. 學. Nordhaus is that people (voters) are “myopic” and their behavior is “backward-looking”. It means the voters’ behavior depends on the recent past economic performance so as their. ‧. expectations regarding inflation. Considering those elements, the current incumbent could. sit. y. Nat. impact the inflation-unemployment cycle (cf. Phillips and the inverse relationship between. io. er. employment and inflation) to make it reach a peak prior to the presidential election (lower unemployment and higher inflation) and as a result, get the votes from the majority.. al. n. v i n C h several critics. TheUfirst one is that the incumbent has the Nevertheless, this model has received engchi. control of monetary policy. The principle of independence of the central bank is then not respected. The second critic relies on the fact that the model supports the irrationality of the voters. Finally, reducing unemployment with inflation surprises is also questioned. The political budget cycle This model, developed by Rogoff in 1990 differs from the previous one as it focuses on a fiscal side but not on a monetary one. Indeed, Rogoff makes a clear distinction between the role of the incumbent and the central bank regarding monetary policy: they are independent. The author 26.
(34) . explains in his political budget cycle model that the incumbent use fiscal policy (not monetary at the difference of the previous one) to have a positive impact on the economy and at the same time, on voters’ choices for the upcoming election. There are different ways to impact economy through fiscal policies. The following examples are the most common ones: increasing government investment and reducing tax. The partisan theory. 政 治 大. The first approach of this theory has been realized by Hibbs in 1977. Alesina continued its. 立. development in the late 1980s. This model differs from the political business cycle in the way. ‧ 國. 學. that it assumes a political system with two parties. Both of them have different characteristics and promote different policies as they have different positions on economic issues. The. ‧. difference can be found between the “right-wing” and “left-wing” party in the way that the. Nat. sit. y. left-wing party is considered having greater target for inflation than the right-wing party. In. n. al. er. io. other words, the left-wing party has a higher target of economic activity. It means that a winning. i n U. v. of the left-wing party should lead to a decrease of unemployment and a higher inflation rate. Ch. engchi. while the winning of the right-wing party should have the inverse consequence. In fact, business-oriented party tends to prefer price stability (to remain competitive on the market) while labor-oriented party attaches more importance on full employment (as they tend to focus on social issues). The question of irrationality of voters is, like for Nordhaus model, the main criticism addressed to the partisan model. Alesina developed this first model proposed by Hibbs taking this time into consideration the fact that voters are rational. A new theory came up in the late nineties based on the principle of behavioral finance proposed by Stattman. For him, not only stock prices reflect utilitarian characteristics but also 27.
(35) . psychological ones. The notion of investors’ sentiment is raised. In our situation, with presidential elections for example, it seems that investors tend to be more optimistic during the second part of the presidential term as the new election could be a base to change and improvement of the economy and financial markets. It would then explain the presence of higher stock returns during the two last years of the term. On the contrary, this is during the second year of the term that investors would usually be disappointed at the government in power as their expectations are not fulfilled and the sentiment of anticipation is less present as. 政 治 大. the upcoming elections is in a longer time.. 立. ‧ 國. The Efficient Market Hypothesis: EMH. 學. 3.3.. General introduction to the EMH. ‧. sit. y. Nat. The efficient market hypothesis is a theory that has been developed by Eugene Fama in the. io. er. early 1960s at the University of Chicago Booth School Business. His empirical studies led him to conclude that an efficient market is characterized as a market in which prices of assets are an. al. n. v i n accurate reflection of all availableCinformation. the efficient market hypothesis states h e n g cTherefore, hi U that it is impossible to “beat the market”, in other words, impossible for investors to buy stocks. over or undervalued as they are always traded at a fair-value on stock exchanges unless investors are willing to ‘bear’ more risk. Thus, according to this theory, it is not accurate to use both fundamental and technical analysis to predict the future trend in the stock markets: The fundamental analysis is a method to determine the intrinsic value of an asset. Different factors are analyzed to reach a value as accurate as possible. Internal factors of the company are taken into account so as external ones. The range of factors is by consequence large and includes information from financial ratios to macroeconomic data. 28.
(36) . The technical analysis does not intend to estimate the intrinsic value of a company’s stock as the fundamental analysis does; but instead analyze, through different ways and means of calculations, historical data generated by market activity in order to predict the future pattern (trend) of the market and invest in consequence. Both fundamental and technical analyses are used with the same purpose to predict the upcoming pattern of the market activity, in order to realize the most profitable investments. The. 政 治 大 base their investments on them. As many investors use both fundamental and technical analyses, 立 defenders of these analyses are the main opponents to the efficient market hypothesis as they. ‧ 國. 學. this theory has been really controversial since its creation. Regarding our own study, the. findings of abnormal returns around the presidential election date would go against the efficient. ‧. market hypothesis if we wanted to use them with the purpose of investment.. Nat. sit. y. This first approach of the efficient market hypothesis can be extended to three different forms.. n. al. er. io. This is still Fama who divided his first hypothesis into these three different categories, in 1970. They are now classified as followed:. Ch. engchi. i n U. v. The strong form or strong-form efficiency. This type of market efficiency does not only take into consideration the public information but also the private one. It extends the assumption of the semi-strong efficiency stating that the market reacts actually immediately to all kind of information, public or private. It also includes the theory applicable for the weak-form of efficient market hypothesis. According to the different assumptions of the strong-form efficiency, no investors would possibly make any profit compared to an “average” investor, even if new information was given to him (public or private). 29.
(37) . The semi-strong form or semi-form efficiency: This form of efficiency is related to how the market reacts to public information. It suggests that the market price reacts in an almost immediate, better to say very quick, way to the information available to the public. If the security price completely reflects the public information, it is not possible to use any analysis (fundamental or technical) to try to beat the market exploiting public information as markets do not underreact or overreact when the information is released.. 政 治 大. The weak form or weak-form efficiency:. 立. ‧ 國. 學. This type of market efficiency states that it is not possible to use historical data to forecast the future pattern of the market activity. Stock prices are independent from a day to another and. ‧. they are not impacted by their history. In this way, investors cannot make any forecast of stock. sit. y. Nat. market prices. This is by definition contradictory with the technical analysis and the reason why. io. n. al. er. these two theories are not compatible.. i n U. v. To conclude, it is important and relevant in our literature review to underline the concept of. Ch. engchi. efficient market hypothesis as it has been a major breakthrough in the contemporary market finance and it is directly related with our topic in the way that, the results we will find after our two different studies might show abnormal returns. Nevertheless, we cannot be worried about our future results as this theory has been among time, very controversial and challenged by investors averse to use technical analysis and fundamental analysis to prepare their investment strategies. The aim of the research question is not to refute or support the efficient market hypothesis but instead to show evidence that the risk might be reduced and stock returns increased when we consider the presidential election in both Taiwan and France. The findings of market cycles in the two countries combined with the presence of abnormal returns around 30.
(38) . the presidential elections period would suggest a lower risk for a potential investor to allocate his money.. 3.4.. Previous Findings on Abnormal Returns around Presidential Election in the US. The first part of our study will be trying to identify a pattern of market cycle around presidential elections for France and Taiwan. The analysis we will propose in consequence will be. 政 治 大. applicable form a medium-term point-of-view. This is the reason why, the second part of our. 立. work will be to determine whether or not it is possible to identify abnormal returns around the. ‧ 國. 學. presidential election date, through an event window (as we will realize an event study) that we will determine and explain later in our methodology. This one will focus on the short-term and. ‧. help us to propose investment recommendation that can be described as more speculative for. Nat. sit. y. investors. The purpose of this last part of literature review is then to introduce the previous. n. al. er. io. findings regarding the presence of abnormal returns around the presidential elections. Pantzalis,. i n U. v. Stovall and Turtle provided in 2000 the most complete study realized regarding the analysis of. Ch. engchi. abnormal returns around presidential elections. In their paper, Political elections and the resolution of uncertainty: The international evidence, they study the behavior of stock market indices between 1974 and 1995 and this, for 33 different countries. The authors found results showing there are abnormal returns the two-week period before the presidential election week. The degree of freedom in the countries of study and the success of the incumbent are two factors they identify leading to the presence of abnormal returns in this period. According to their results, it seems that the strongest abnormal returns have been found for countries with a less degree of freedom when the election is lost by the government in power (incumbent). Plus, the closer we are to the election date and the uncertainty is reduced, the higher the abnormal 31.
(39) . returns. The degree of freedom, taken into account in their study, won’t be a factor of explanation in the differences of abnormal returns and market cycle between France and Taiwan (if there are differences), as we previously focused on this factor in the general introduction of our thesis and found that both countries are ranked “free” according to Freedom House, a qualified objective organization on this issue in the world. Then we cannot consider the freedom factor to have any kind of relationship with our future findings. Nevertheless, the win or defeat of the incumbent during the presidential elections will occupy a part of our. 政 治 大. analysis as, we might find outstanding results, in a way or another, and give proper investment. 立. recommendation according to them.. ‧ 國. 學. Before the study of Pantzalis, Stovall and Turtle, different authors have also studied the. ‧. presence of abnormal returns around presidential elections. Those studies have been mostly. sit. y. Nat. conducted in the United States and bring different conclusion on this topic. In 1970,. io. er. Niederhoffer, Gibbs and Bullock published in the Financial Analyst Journal their research paper Presidential Election and The Stock Market, in which they study from 1900 the evolution. al. n. v i n of the Dow Jones index the dayC after election. According to their results the U h ethenpresidential i h gc stock market has raised 8 times out of 9 after a Republican win while it has only risen 4 times. out of 9 after a Democrat win. What the authors called “magnitude of change” seems also to be at the advantage of the Republicans with an average increase of 1.12% while it was -0.82% for the Democrats. The trend observed the day after the election date seem to continue the week and month after, and be “qualitatively” similar. This study shows then that the outcome of a presidential election will have an impact on the stock market for; at least, the month after the result of this one. It brings a different view than the study conducted by Pantzalis et Al. in 2000. Nevertheless, the authors recognize a rising movements of the stock prices in the week prior to. 32.
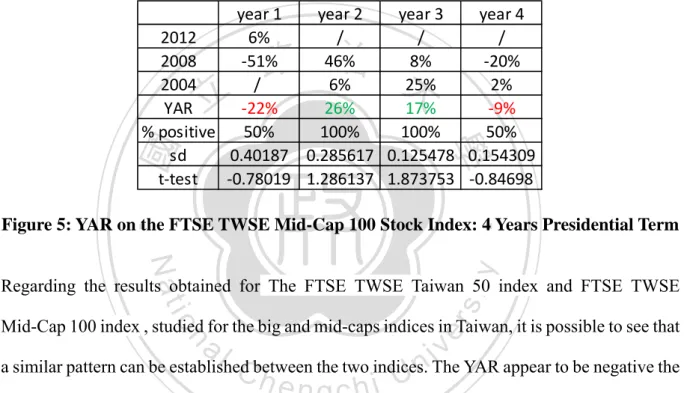
(40) . the election date. Reilly and Luksetich found the same results in 1980: ‘positive cumulative abnormal residuals’ can be found after the election of a Republican president and that those abnormal residuals are ‘always negative’ after a Democrat win. It seems that most of the studies have been conducted in the United States and tend to show the results explained above.. 3.5.. France-Taiwan: A Few Findings. Our literature review has been centered on the United States, mainly because most of the. 政 治 大. studies that have been conducted on this topic were involving this country and its stock market.. 立. Nevertheless, it is still possible to find a very few researches related to the impact of. ‧ 國. 學. presidential election on stock prices linked to the countries we are working with. We will do a brief summary of what has already been found for France and Taiwan. It will give us an insight. ‧. of the kind of impact that presidential elections may have on the stock markets for both. er. io. sit. y. Nat. countries.. In their paper, Chuang and Liu (2013) found for Taiwan that ‘the ruling party win of elections. al. n. v i n C h day and that thisUimpact increases for the great win of lead to higher returns of next-trading engchi elections or the win of central or presidential election’. In 2004, Cho analyze the Taiwanese. stock market from 1989 to 2004 and reach the conclusion that an “election bull-run” exists in Taiwan. It means, according to the writer, that the stock market in Taiwan generates significant and positive abnormal returns. This would be explained by the government intervention on the stock market to raise the stock prices and, as we explained before in our literature review get citizens’ votes (letting them imagine the economy is doing well). On the other way, a paper published by Hung in 2011 states that there is no such proof of the existence of a bull-run before the election in Taiwan. 33.
(41) . Regarding France, a paper written by Cho and Parhizgari shows the presence of strong trade-offs during ‘the election relative to non-election periods’. This result would mean that there are strong differences between the period prior and after the presidential elections, in favor of the 12 months before the election date. An example given is the substantial decrease of the unemployment rate during the 12 month period prior to the election date in France.. 立. 政 治 大. ‧. ‧ 國. 學. n. er. io. sit. y. Nat. al. Ch. engchi. 34. i n U. v.
(42) . 4. Market Cycles Study 4.1.. Data. The purpose of this study will be to analyze first whether or not it is possible to identify the presidential cycle that was observed in the United States for the two countries of my study: France and Taiwan. We will be able to see if a market cycle occurs for a length of approximately 4 years in Taiwan and between 5 and 7 years in France which are the durations of the. 政 治 大. presidential term, in each country respectively. The study will be conducted on the two main. 立. indices of France and Taiwan (CAC 40 and TAIEX) which are the most relevant to reflect the. ‧ 國. 學. economic condition of each country. They are the indices that will be, most probably, affected by the political decisions taken during the presidential term so that they can better reflect the. ‧. pattern of market cycle if they are present in the two countries. Nevertheless, we will also take. io. sit. y. Nat. into account a new variable which was not studied before for the analysis we want to do:. n. al. er. The size effect, in other words, the market capitalization of companies listed on the index. In the. Ch. i n U. v. United States, our literature review showed that the previous studies have been conducted. engchi. mainly with stocks listed on the S&P 500 (big-cap) and the Dow Jones which are the main indices of the country. The mid-cap indices were never taken into account to see whether or not they were impacted by politics and if a four-year presidential cycle could be identified or not for this type of indices. Our literature review showed that only Johnson, Chittenden and Jensen incorporate the size effect (with small-caps) in order to realize a study different that the one we will conduct now: Analyze whether the returns were higher during Democrats or Republicans presidential term including different factors of study (the size factor was one of them), study we won’t do in our thesis for France and Taiwan. This is the reason why we will incorporate in our. 35.
數據
+6
Outline
France-Taiwan: Backgrounds. Specific Focus on Political Rights, General History,
Business and Market Cycles
Presidential Elections and Market Cycles
The Efficient Market Hypothesis: EMH
Methodology
Presentation of Results
Event Study Methodology and Abnormal Returns
Presentation of Our Results
Limitations of Our Model
相關文件
Therefore, the focus of this research is to study the market structure of the tire companies in Taiwan rubber industry, discuss the issues of manufacturing, marketing and
IPA’s hypothesis conditions had a conflict with Kano’s two-dimension quality theory; in this regard, the main purpose of this study is propose an analysis model that can
Through the enforcement of information security management, policies, and regulations, this study uses RBAC (Role-Based Access Control) as the model to focus on different
The main goal of this research is to identify the characteristics of hyperkalemia ECG by studying the effects of potassium concentrations in blood on the
Thus, the purpose of this study is to determine the segments for wine consumers in Taiwan by product, brand decision, and purchasing involvement, and then determine the
The objective is to evaluate the impact of personalities balance in a project management team on the team’s performance.. To verify the effectiveness of this model, two
Therefore, the purpose of this study is to investigate the hospitality students’ entrepreneurial intentions based on theory of planned behavior and also determine the moderating
Then, to determine the putative regulatory elements, we analyze primate promoter sequences using two different methods by PCMC program for primate-specific, position-corresponding,
