行政院國家科學委員會專題研究計畫 成果報告
科技設施工程之設計階段決策流程評估模式(III)
研究成果報告(精簡版)
計 畫 類 別 : 個別型 計 畫 編 號 : NSC 98-2221-E-009-169- 執 行 期 間 : 98 年 08 月 01 日至 99 年 07 月 31 日 執 行 單 位 : 國立交通大學土木工程學系(所) 計 畫 主 持 人 : 王維志 計畫參與人員: 碩士班研究生-兼任助理人員:李奕樺 碩士班研究生-兼任助理人員:陳賜豪 碩士班研究生-兼任助理人員:陳正宜 碩士班研究生-兼任助理人員:潘春秀 博士班研究生-兼任助理人員:鍾楚璿 博士班研究生-兼任助理人員:劉正章 報 告 附 件 : 出席國際會議研究心得報告及發表論文 處 理 方 式 : 本計畫可公開查詢中 華 民 國 99 年 08 月 25 日
行政院國家科學委員會補助專題研究計畫
■成果報告
□期中進度報告
科技設施工程之設計階段決策流程評估模式(III)
計畫類別:■個別型計畫 □整合型計畫
計畫編號:NSC 98-2221-E-009-169-
執行期間:98 年 08 月 01 日至 99 年 07 月 31 日
執行機構及系所:國立交通大學土木工程學系
計畫主持人:王維志教授
共同主持人:無
計畫參與人員:劉正章、鍾楚璿、李奕樺、潘春秀、陳賜豪、陳正宜、
林家立、李明聰
成果報告類型(依經費核定清單規定繳交):■精簡報告 □完整報告
本計畫除繳交成果報告外,另須繳交以下出國心得報告:
□赴國外出差或研習心得報告
□赴大陸地區出差或研習心得報告
■出席國際學術會議心得報告
□國際合作研究計畫國外研究報告
處理方式:除列管計畫及下列情形者外,得立即公開查詢
□涉及專利或其他智慧財產權,□一年□二年後可公開查詢
中 華 民 國 99 年 7 月 31 日
1
行政院國家科學委員會專題研究計畫成果報告
摘要 營建工程之興建過程包括規劃與設計階段,當在概念及可行性研究(先期規劃)階段 時,業主往往只能提供一個初步概念或者若干需求,如何將這些概念與需求轉化成具 體文字或圖表,據以擬定設計準則,以作為建築師競圖之基礎,是此階段中極為重要 之課題。在進入到綜合規劃階段時,設計者依據設計準則,提出數個方案,如何系統 化的評估出符合業主需求之適當方案,以匡列專案工程的預算則是此階段的主要問題。 當到初步與細部設計階段時,如何逐漸地將細微的需求,詳細且有系統地納入設計圖 說,以利最後產出施工標所需之招標文件則是重點。在實務現況中,上述規劃設計階 段涉及需求問題的處理方式主要是透過會議討論並多僅仰賴於經驗,缺少有系統的流 程或方法來協助管理,故而經常造成對於業主需求的分析與決策無法掌控,進而延誤 工程進展。若是涉及到科技設施工程,需求更加繁多且複雜,將使得上述問題之解決 更加困難。 本研究主要目的為建構一個支援決策的流程評估模式,在規劃設計階段執行過程 中,協助評估其需求是否具體化於各種設計產出中。本研究藉由實際案例的專家訪談 及文獻回顧瞭解各階段實務現況中所面臨的需求整合、需求轉化及決策等問題;利用 品質機能展開法、資料流程圖等方法,系統化建構出決策流程評估模式;最後並以電 腦化呈現,並藉由科技設施實際案例進行測試。 另,本計畫亦曾針對一科技設施工程在規劃設計階段的延遲結果進行分析,最後 研擬出設計延遲與四個設計流程構面(需求與規範、組織決策與預算、專案控管與審查 以及設計執行與協調)間的相互影響(支配)關係,以利降低專案設計延遲的發生。此部 分之研究成果亦研擬出 17 個評估準則,並運用決策試驗與實驗評估法來建構影響設計 延遲的網路關聯圖。 關鍵詞:規劃設計階段、科技設施工程、品質機能展開法、資料流程圖、設計延遲、滿 意度重要度分析、決策試驗與實驗評估法 AbstractConstructing a facility includes planning and design phases. From the viewpoint of project management team, materializing the project owner’s needs/requirements into concrete design guidelines is crucial to selecting a capable architect/engineer (A/E) during the conceptual planning and feasibility study phase. Systematically evaluating the design alternatives proposed by the A/E is a major task in the planning phase. Finally, a design review of the selected design alternatives is the focus in the (preliminary and detailed) design phase. In practice, ensuring whether or not the owner’s needs are met frequently is to conduct numerous review meetings and is highly experienced-based. Without a systematic
2
model to step-by-step advice the project management team to take appropriate management actions in the planning and design phases, the deliverables generated in each phase frequently cannot satisfy the owner’s requirements. This practical problem is particularly highlighted for a high-tech facility construction project which involves much complicated owner’s needs and requirements.
The main objective of this research is to develop a process-based evaluation model for supporting the planning and design phase for high-tech facility construction projects. In conducting this research, expert interviews and literature review are used to further understand the problems. Then, the research applies quality function deployment and data flow diagram to build up the model. Eventually, the model is tested using a real-world high-tech facility construction project.
Additionally, this research also investigates the relationships between the design delays and four design-process-related aspects for a high-tech facility construction project. The four design-process-related aspects are user aspect (owner needs and specifications), decision-maker aspect (decision making process and budgets), project management aspect (control and review), and A/E aspect (execution and coordination). Seventeen evaluation criteria under the four aspects are also identified according to several expert interviews and extensive literature review. Then DEMATEL technique is applied to develop network relationships of the delays and criteria. Knowing the relationships between the delays and the aspects should help management to appropriate actions.
Keywords: planning and design phases, high-tech facility construction, quality function deployment, data flow diagram, design delays, satisfaction-importance analysis, DEMATEL technique
1.
前言營建專案工程之執行可分為概念及可行性研究(conceptual and feasibility study)、綜 合規劃(schematic design)、初步設計階段(preliminary design)、細部設計階段(detailed design)、發包施工階段與驗收完工階段,其中,概念及可行性研究、綜合規劃、初步 設計以及細部設計等屬於專案計畫的規劃設計階段(project planning and design phases)。 對於管理一件工程專案的業主執行者(如建廠小組或工程組)、協助業主之顧問或營建管 理顧問公司而言,在這規劃設計各階段的過程中,需求不斷地被討論、確認,甚至推 翻已完成部份而重覆規劃設計的工作。 就目前實務狀況而言,整個設計結果的成敗與進度之掌控,大多僅仰賴於建築師 團隊之經驗,惟建築師主要仍是從設計本身的角度出發,重視的是空間量體的安排、 景觀的感受、法規的檢討。業主的使用者不斷地提出想法或需求,或者無法適當的表 達(或認為建築師本來就應該顧慮到)需求,需求經常是無法收斂或沒有被明確的表達出 來,最後經常發生設計不當(甚至錯誤)無法滿足業主需求外,設計進度落後,更重要的
3 是整個規劃設計階段是在混亂無章法中執行。故對於業主執行者、協助業主之顧問或 營建管理顧問公司而言,必須要能在一有系統或有步驟管理的方式下,在概念及可行 性研究階段,能完整的將業主的需求具體表達,以作為設計師競圖之設計準則;在綜 合規劃階段,能有效地協助業主選出適當的設計方案;在設計階段,將逐步地將細步 需求完整的表達在設計圖說中,並發展成施工招標文件。 本研究主要目的為建立一個整合規劃設計階段之以流程為基礎的決策支援評估模 式(a process evaluation model to support decision makings in the planning and design phases of construction projects),依據概念及可行性研究階段、綜合規劃階段及設計階段 執行時所應考量之不同重點,有步驟地,有層次地(由大綱進入細節),協助業主評估其 需求(包括功能或空間等),整合提供給於建築師,使其能具體落實於各種設計產物中; 又因有步驟地執行,故能主動地掌控設計之進展,最後能有利設計進度之管控。 2. 文獻回顧 本節回顧主要包括:科技設施工程之特性、工程生命週期之定義、及設計管理,以 協助了解過往研究之優缺點,進而更加確立本研究之研究範圍、研究問題與研究方法。 2.1 科技設施之特性 科技設施的工程複雜度以及投入的資金遠比傳統工程高,為了提早投入營運,工程 興建時間總被業主期待能夠越短越好,為達成縮短工期之目標,除了以傳統方法如增加 人力、機具等趕工方式加速施工效率,採用快捷施工法(Fast-track)這種設計與施工並 行的施工法也是目前常用之方法【王維志等人,2001】。透過工作重疊的方式亦相對提 高對設計管理之要求,若設計者和管理者無法清楚掌控業主需求,所造成的損失亦比傳 統工程更嚴重。 2.2 工程生命週期之定義 國內新興公共工程各階段計畫及經費估算作業流程如圖 1 所示,亦即工程生命週期 主要分為:規劃階段、設計階段、發包施工階段、完工驗收階段【工程會,2001】【王 翰翔,2003】。其中,規劃階段細分為先期規劃(即概念與可行性研究)與綜合規劃階段, 設計階段又可細分為初步設計階段及細部設計階段。 圖 1、工程各階段計畫及經費估算作業流程【工程會,2001】【王翰翔,2003】 先期規劃(可 行性研究)階 段編列「工程 經費之概估」 綜合規劃階段 編列之「工程 經費概算」 初步設計(基 本設計)階段 編列之「工程 經費概算」 詳細設計階段 編列之「工程 預算」 工程招標及施 工階段之「執 行預算」 工程結算與 決算 規劃階段 設計階段 施工階段 完工驗收階段 核定計畫與暫匡列 經費,據以檢送民 意機關審議完成法 定程序 覈實所需工程 總經費 擬定發包預算 竣工初驗及驗收 評估開發效益 及興建原則
4 (1)概念及可行性研究階段 - 在此階段(即工程會之先期規劃),設計單位(例如 受委託的顧問公司)經常需面對十分籠統且不清楚(ill-defined)的設計想法【莫國箴, 2003】。設計單位除必須將自己在機能、美感和含意中的理念,透過一些表示的方法 (presentations)明確的表示出來,亦必須將暫時設計成果,拿來與業主作雙向的意見 交換,換言之,此階段之工作主要為如何明確的且清楚的將業主需求轉換成提供設計 者設計之準則。 (2)綜合規劃階段 - 經選定建築師(設計單位)後,便進入綜合規劃階段,之後建 築師須依據現行法規、及其既有之設計理念和專業知識與對現有計畫之了解等,利用 資訊去發展出一符合業主需要之新計畫案,且這計畫案需包含有計畫之初步預算和一 般性之空間規劃與安排【Baldwin et al., 1999】【Rivard and Fenves, 2000】。換言之, 此階段之主要工作內容為設計者配合確定計畫之執行,並提供數個設計執行方案供業 主選擇,待業主選定最適方案,設計者需依此方案完成設計成熟度 30%之圖說,用以 編列「工程經費之概算」【工程會,2001】【王翰翔,2003】。設計者在規劃階段須 將業主之需求項目,具體而明確的呈現,以作為設計的依據。然而業主對於需求項目 的表達,往往是一連串的語意描述詞,如光線要明亮,而且需求項目之重要性及其相 關性亦無法明確的表示。此外,一個完整的設計方案是由眾多的設計要素構成,而各 設計要素又可分為不同的選項。因此有必要建立能將業主需求項目系統明確地呈現, 而且得以尋求最佳設計組合的工程設計決策模式【陳惠娟,2004】。 (3)設計階段 - 進入初步與細部設計階段,必須完成並確定各部份之設計,包 括空間造型設計、平面、立面、剖面、施工圖等設計;並編製特定條款、招標文件, 藉以編列「工程預算」或擬定發包預算【工程會,2001】。然而,在設計階段更需要 明確了解其所需要進行的設計作業項目、關係與可能完成時間,目的在確保後續工作 與工程進行不會因詳細設計延誤而延遲。 2.3 設計管理 設計管理是指計劃開始前依合約時程與資源,擬訂工作計畫與執行設計進度管理, 使設計工作提前完成,有餘裕可以進行品質檢驗的工作【戴期甦、何純平,2000】。已 有越來越多的研究指出設計管理之重要性【Luh et al., 1999】【Chang, 2001】【Austin et al., 1999】【Austin et al., 2000】【Wang and Dzeng, 2005】【Wang et al., 2006】【王思 琳,2005】,有些研究係針對設計流程(design process)進行討論,目的在透過合理之 設計流程管控,使設計排程管理更有效率。例如,Sanvido and Norton (1994) 提出一建 築物設計過程之模型,該模型指出透過對設計項目的確認與安排、設計資源流向和設 計產物的掌控等方式可確保一設計案的成功,一設計案的發展乃因資料流和資訊流的 傳遞。
又,例如在考慮設計循環特性和資訊間的從屬關係後,Austin 等人 (1999 與 2000) 建立一分析設計計畫技術(Analytical Design Planning Technique; ADePT)來建構一建築 物之設計計畫。ADePT 的核心為利用關係矩陣去分析設計流程之循環過程,這個模型
5 能夠將資訊從屬關係予以分級。
過往研究利用數種不同工具,如資訊模式(information modeling methods)、最 佳化(optimization)、數據結構矩陣(data structure matrix)和電腦模擬(simulation)電 腦工具等,研究發展出數種評估模式以利業主掌控規劃設計階段所具有之各種特性(例 如資訊從屬、設計循環的次數和合作環境等),以利改善設計管理作業。換言之,特別 針對科技設施工程,並建立一以業主執行者為主之決策流程評估模式之研究是不足的。 3. 研究方法 本研究所運用之研究方法包括:資料流程圖、品質機能展開方法、決策試驗與實驗 評估法(DEMATEL),分述如下。 3.1 資料流程圖 本研究使用資料流程圖來系統化表達規劃設計階段的過程、資料數據流與資料數 據儲存。資料流程圖(Data Flow Diagram,DFD)為透過一個功能過程的相互作用與邏 輯性的資料來描述一個系統的運作流程,並利用圖表來確認、瞭解運作流程中的衝突與 多餘處,可說是一個幫助模式化的有利工具【Kim,1992】。DFD方法直觀易懂,使用者 可以方便地得到系統的邏輯模型和物理模型,故其為對建立模式的一種有利工具【呂翊 民,2003】。表達DFD的圖形符號分為圓圈、長方形、兩條槓(兩邊開口長方形) 以及箭 頭等四類,如圖2。圖中,圓圈代表資料輸入與輸出的處理或轉換流程(process);長方 形代表資料的目的地或來源(Terminator);兩條槓代表一個資料儲存與提供的地方 (Store);箭頭代表資料流動的方向(Flow)。 圖 2、資料流程圖的符號 3.2 品質機能展開方法
品質機能展開(Quality Function Deployment, QFD)是一套將顧客需求融入產品設計 發展的一種結構方法【Hauser and Clausing, 1988】【Ahmed et al, 2003】【Eldin and Hikle, 2003】。品質機能展開為一系統化之方法,能將業主的需求透過品質屋的轉化成為設計 要素,如圖 3 為品質機能展開的概念圖。
6
圖 3、品質機能展開的概念圖【陳惠娟,2004】
3.3 決策試驗與實驗評估法
根據林家立等人【2009】的研究指出,決策試驗與實驗評估法(DEMATEL)是由日 內瓦 Battelle 紀念協會(Battelle Memorial Institute of Geneva)於 1972~1976 年間為了科學 與人類事務計畫(Science and Human Affairs Program)所發展出來的方法,是用來解決複 雜糾結的問題,決策試驗與實驗評估法可以提升對於特殊問題的瞭解、糾結問題的群組 以及藉由層級結構來提供識別可行方案。 DEMATEL 的計算步驟包括:計算初始平均矩陣、計算直接影響矩陣、計算間接影 響矩陣、算總影響矩陣、進行結構關聯分析。細節可詳林家立等人【2009】或林岳樺等 人【2009】。 4. 模式之建立 本研究參考公有建築物作業手冊,並依據三件國內國家科技設施工程之執行經驗, 以階層式的方式研擬一套整體規劃設計階段流程評估模式,如圖 4 與圖 5 分別為此模式 的階層 1 與階層 2 的各設計階段主要控管作業與產出文件(deliverables)。表 1-~表 4 分 別為各設計階段之各細項設計控管作業內容之說明。 此流程模式的建構作法為:透過設計作業的流程化,將此階段所應進行的工作內容、 依據(政府程序或建築法令規定等)、工作重點目標、與執行的方式(如召開內部會議或邀 請專家審查等)彙整納入電腦表單(computerized check list)之內。
另外,在概念及可行性研究階段,本研究以品質機能展開法為基礎,建立了需求引 導評估流程(詳【林芳如,2007】【林芳如與王維志,2008】);以資料流程圖為基礎, 建構了需求整合流程(詳【李青樺,2007】【林青樺等人,2008】);也建立了應考量之 設計準則項目(詳【林芳如,2007】)。至於在整個規劃設計階段,運用決策試驗與實驗 評估法來建構影響設計延遲的網路關聯圖(詳【林家立等人,2009】【Lin et al., 2010】)。 業主需求 (輸入) 品質機能展開 (品質屋) 設計要素 (輸出)
7 圖 4、設計階段流程評估模式 - 階層 1 空間功能 需求之預估 計畫書 作業 法規/程序 評估 基地規劃 需求功能 確定 興建範圍 確認 功能檢討 空間檢討 結構系統 設備管線 檢討 細部配置 材料檢討 興建內容 確定 製作發包文 件 30%審議 建照申請 計劃書 設計準則 其他計畫相關文件 建築師招標文件 30%審議文件 工作執行計劃書 整體綜合規劃 其他合約要求文件 初步設計結果 結構試算結果 建管初審報告書 細部設計文件 建照申請文件 建造執照 施工標招標文件 先 期 規 劃 階 段 綜 合 規 劃 階 段 初 步 設 計 階 段 細 部 設 計 階 段 設計作業(階層-1) 主要控管文件 甄選建築師 作業 階段 整體評估 初步設計 成果
8 圖 5、設計階段流程評估模式 - 階層 2 先 期 規 劃 階 段 綜 合 規 劃 階 段 初 步 設 計 階 段 細 部 設 計 階 段 設計作業(階層-2) 階段 確認計畫內容 必要分析 (選址、初步法規分析) 基地分析 計畫報核 整體評估 甄選建築師 基地配置 法規分析 量體確認 需求功能 確認 系統選擇 系統計畫 景觀計畫 興建面積 興建預算 審議報告書 需求功能 檢討 系統 選擇與配置 法規檢討 平面檢討 立面檢討 配置檢討 系統供應 動線規劃 P&ID與 昇位圖 系統規格 管線檢討 特殊結構 議題檢討 系統結構 需求檢討 一般結構 檢討 配置檢討 機電細部設計 建築細部設計 材料適用性檢討 機電材料確認 建築材料確認 重要規範與標準 建照申請文件 興建內容確認
9 表 1、概念及可行性研究階段之各細項作業內容 工作大綱 細項作業內容 整體評估 z 進行基地及周圍環境分析-檢討水文氣象資料、土壤地質地形(含地 質鑽探)、生態環境、自然文化景觀、現有公用設施、土地使用現況、 其他等 z 進行工程計畫內容-工程規模決定、主要工作項目及實施期程制定 z 總經費需求上限決定作業-依單位面積成本概估法計算 z 建造方式選擇 z 建築位置初步決定作業 法規 / 程序評 估 z 瞭解相關法規規定-區域計畫、都市計畫及建築法令對基地使用之規 定-確認使用分區、建蔽率、容積率、是否合乎規定 z 地理環境影響評估、山坡地開發許可及都市設計審議,土地取得辦理 作業等 z 原有地上物及地下物之處理作業 空間功能需求之 預估 z 檢討總樓地板面積及用途說明、各房間面積及相關位置等 z 室內外空間之用途及需求量預估(含各類空間面積及總樓地板面積) 作業 計畫書作業 z 彙整基地現況使用說明、位置圖、初步配置圖、公共設施及周邊現況 說明等文件 z 制定整體評估計畫書作業 z 提交業主需求計畫書作業 z 制定先期規劃計畫進度表作業 z 制定其他文件 甄選建築師作業 表 2、綜合規劃階段之各細項作業內容 工作大綱 細項作業內容 基地規劃 z 工程內容;施工佈置;主要項目施工方法; z 預定實施進度;估價基準; z 法令分析-檢討建築、都計法令 興建範圍確認 z 各主要成本項目之編估說明-成本計畫-按公共建設工程經費估算編列 手冊辦理 (或按中央政府總預算編制作業手冊辦裡)
10 表 2、綜合規劃階段之各細項作業內容(續) 工作大綱 細項作業內容 需求功能確定 z 檢討材料、色彩計畫 z 查閱初步配置圖-檢討建築物規模及位置 z 查閱初步平面圖-檢討配置、動線計畫 z 查閱初步立面圖-檢討層高、動線計畫 z 查閱初步剖面圖-檢討層高、動線計畫 z 制定景觀計畫 z 依各審查圖說檢討主要內外裝修配置 z 基礎、結構系統規劃作業-檢討基礎方式、跨距、構架方式、材料、 部材尺寸 z 設備系統規劃書制定-檢討各設備系統設備空間 30%審議文件 z 審議文件之製作 表 3、初步設計階段之各細項作業內容 工作大綱 細項作業內容 功能檢討 z 法令分析-檢討建築、消防法令 空間檢討 z 查閱配置圖-依據基本規劃,檢討尺寸 z 查閱平面圖-依據基本規劃,檢討尺寸 z 查閱立面圖-依據基本規劃,檢討尺寸 z 查閱剖面圖-依據基本規劃,檢討尺寸 z 查閱內外裝修表及裝修材料表-依據基本規劃,檢討材料、色彩 z 查閱景觀圖-依據基本規劃,檢討尺寸 設備管線檢討 z 設備系統計畫書、系統圖、昇位圖等-依據基本規劃,檢討各設備(含 污水處理及消防等)系統負荷、設備容量及數量、設備規格、設備空 間 結構系統檢討 z 基礎、結構系統計畫-依據基本規劃,檢討結構設計條件之整理、初步 概算 初步設計成果 z 利用各圖說進行土建及各設備系統經費計算作業 z 建立初步預算書-包括土建及各設備系統之概算詳細表等文件
11 表 4、細部設計階段之各細項作業內容 工作大綱 細項作業內容 細部配置 z 查閱詳細配置圖-依據基本設計,檢討詳細尺寸 z 查閱詳細平面圖-依據基本設計,檢討詳細尺寸 z 查閱詳細立面圖-依據基本設計,檢討詳細尺寸 z 查閱詳細剖面圖-依據基本設計,檢討詳細尺寸 z 查閱內外裝修表及裝修材料樣品-依據基本設計,檢討材料、色彩 z 查閱景觀圖-依據基本設計,檢討詳細尺寸 z 查閱詳細結構圖、結構計算書-檢討結構詳細尺寸、規格 z 查閱設備規格、系統圖-檢討各設備設備(含污水處理及消防等)規 格、尺寸、各設備間之系統整合 z 查閱建築、結構、各設備系統套合圖-依據建築圖、結構圖及各設備 系統圖,檢討各系統(建築、結構與各設備)間之空間、管線路徑 材料檢討 z 依照圖說、需求,蒐集主要材料、設備參考廠商表及型錄 z 依照圖說、需求,決定主要材料、設備廠商 興建內容確定 z 面積檢討 z 預算檢討 z 發包內容確認 建照申請 z 送審文件確認 z 預審 製作發包文件 z 制定施工說明書-依公共工程施工綱要規範,檢討施工及材料規範 z 查閱建築物維護管理手冊 z 制定工程預定進度表 z 制定施工預算書-依公共工程施工綱要規範與細目編碼及公共工程經 費電腦估價系統(PCCES),檢討工程內容、項目、數量計算、詳細表、 單價分析表 z 設計標單項目、工程契約草案、制定發包文件作業 5. 模式之電腦化 本研究建立一套具有網路平台功能的資訊管理系統,將本研究所發展出之流程模式 (包括工作大綱、細項作業、細項作業執作(管理)方式、配合之表單等),經分類後儲存 至系統資料庫中,再藉由本系統擬開發之相關功能,提供使用者與決策者所需之資訊, 以進行專案計畫的控管功能。整個系統之實際應用如圖 6 所表示。 在系統規劃上,包括五個主要架構,分別為:(1)系統資料庫(Database)、(2)界面處 理模組(Interface Module)、(3)文件管控模組(Document Module)、(4)作業模組(Activity Module)以及(5)管理模組(Management Module)。各模組之功能說明如下:
z z z z z 模 腦系統 後,進 料間之 進行各 台進行 圖 及目前 系統資料 括各類文 及相關管 界面處理 際網路傳 指令,得 文件管控 設計圖說 各作業間 作業模組 時程資訊 專案計畫 管理模組 輸入指令 追蹤項目 模式電腦化的 統開發設計各 進行系統資料 之相對應關係 各模組間之資 行測試。 圖 7 顯示部分 前相關文件清 料庫 - 主 文件、作業 管理資訊等 理模組 - 傳遞至系統 得到所需之 控模組 - 說、會議紀 間作為相關 組 - 主要 訊、所需資 畫流程管理 組 - 主要 令,整理出 目及資源分 的步驟包括 各流程之分 料庫之表單 係。(3)完成 資料串聯。 分功能測試 清單等。 主要功能是儲 業資料及資源 等。 在運作上 統資料庫儲存 之資訊。 主要功能為 紀錄及相關公 關確認執行之 要之功能在定 資源與作業所 理的作業。 要在透過分析 出必要之管理 分配等,作為 圖 6、 括:(1)確認系 分析。(2) 確 單欄位進行設 成系統資料庫 (4) 最後則 試之預覽畫面 12 儲存專案計 源指派等, ,使用者透 存,或應用 為控管專案 公文等,並 之依據。 定義各作業 所必需之資 析整合系統 理資訊,如 為輔助管理 系統架構應 系統平台之 確認系統平台 設計及正規 庫之建立後 則是將開發完 面,包括顯示 計畫之相關 ,而在資訊 透過界面處 用系統開發 案計畫之各類 並就這些文 業之相關參數 資訊等,透 統資料庫中 如目前專案 理及決策之用 應用圖 之架構,並以 台所需之各 規化(Normal 後,接著則 完成之模組 示目前專案 關資料或資訊 訊部分則為整 處理模組,將 發之相關功能 類文件,包括 文件進行分類 數,包括作業 透過此功能模 中的各項資料 案執行進度 用。 以 Data Flo 各類資料與資 lization),並 則是編撰系統 組連同資料庫 案執行進度 訊,在資料 整理後之時 將相關資料 能,透過網 括合約相關 類、整理及 業間之邏輯 模組將可進 料並配合使 、待辦事項 ow Diagram 資訊與其間 並定義各表 統之各功能 庫佈署至伺 、細部作業 料部分包 時程控管 料透過網 網路傳遞 關文件、 及連結至 輯關係、 進行一般 使用者之 項、重點 m 進行電 間的關係 表單及資 能模組並 伺服器平 業狀況以
6. 結論 本 (DFD 質機能 可行性 利實務 經 步一步 意事項 測試過 力等), 外,目
參考文
[1] Au tec 27 [2] Au tec 論與建議 本研究在規劃 D)方法系統 能展開;QFD 性研究階段的 務上之操作。 經以一科技工 步的告知業主 項與相關參考 過程中也發現 並非所有設 目前電腦化尚文獻
ustin, S. B chnique: a 79-296. ustin, S. B chnique (AD 劃設計各階 統化地建立 D)來協助 的設計準則 。 工程為測試 主執行者每 考表單,故 現由於設計 設計問題可 尚未 user-fr aldwin, A. model of aldwin, A. DePT): a de 圖 7 階段建構一個 立兩層級的流 助評估業主的 則)。最後,本 試案例,發現 每一工作的重 故而整個規劃 計問題的多樣 可被管控,於 iendly,此皆 Li, B. an the detaile Li, B. an ependency s 13 、系統測試 個決策支援 流程步驟, 的需求是否 本研究將所 現所建立的 重點與目標 劃設計階段 樣性(包括不 於是本研究 皆建議為後 d Waskett, ed building nd Waskett, structure m 試畫面 援流程評估模 而其中某些 否落實於各階 所提出之決策 的模式能在規 標,並提供執 段之進行能充 不同之業主組 究目前所建立 後續研究的 P. (1999) g design pr P. (2000) matrix tool to 模式,此模 些步驟將運 階段之設計 策流程評估 規劃設計各 執行時可參 充份被有效 組織、業主 立之 check 的方向。 “Analytica rocess,” De “Analytica o schedule t 模式以資料流 運用特定方法 計產出中(即概 估模式電腦化 各階段進行中 參考之作法 效地管理。惟 主文化、設計 klist 未必完整 al design p esign Studi al design p the building 流程圖 法(如品 概念及 化,以 中,一 、應注 惟案例 計者能 整;另 planning ies, 20, planning g design14
process,” Construction Management and Economics, 18, 173-182.
[3] Ahmed, S. M., Sang, L. P. and Torbica, Z. M. (2003) “Use of quality function deployment in civil engineering capital project planning,” Journal of Construction Engineering and Management, ASCE, 129 (4), 358-368.
[4] Baldwin, A. N. Austin, S. A. Hassan, T. M. and Thorpe, A. (1999) “Modeling information flow during the conceptual and schematic stages of building design,” Construction Management and Economics, 17, 155-167.
[5] Chang, S. T. (2001) “Defining cost/schedule performance indices and their ranges for design projects,” Journal of Management in Engineering, 17(2), 122-130.
[6] Eldin, N. and Hikle, V. (2003) “Pilot study of quality function deployment in construction projects”, Journal of Construction Engineering and Management, ASCE, 129(3), 314-329.
[7] Hauser, J.R. and Clausing, D (1988).The house of quality, Harvard Business Review. [8] Kim, J. J. (1992) A Work Package-based Process Model for Petrochemical Construction
Planning, PhD Dissertation, University of Illinois, Urbana-Champaign, Illinois.
[9] Luh, P. B. Liu, F. and Moser, B. (1999) “Scheduling of design projects with uncertain number of iterations,” European Journal of Operational Research, 113, 575-592.
[10] Rivard, H. and Fenves, S. J. (2000) “A representation for conceptual design of building,” Journal of Computing in Civil Engineering, 14(3), 151-159.
[11] Sanvido, V. E. and Norton, K. J. (1994) “Integrated design-process model,” Journal of Management in Engineering, 10(5), 55-62.
[12] Wang, W. C. and Dzeng, R. J. (2005), "Applying cluster identification algorithm and simulation to generate probabilistic network schedules for design projects," Construction Management and Economics, 23(2), 199-213.
[13] Wang, W. C. Liu, J. J. and Liao, T. S. (2006) “Modeling of design iterations through simulation,” Automation in Construction, 15(5), 589-603.
[14] Wang, W. C., Lin, C. L. and Lee, M. T. (2010), “Using SIA and DEMATEL to identify the factors affecting design delays,” Proceedings of the 27th International Symposium on Automation and Robotics in Construction (ISARC 2010), 25-27 June, Bratislava, Slovakia. [15] 工程會(2001),行政院公共工程委員會,各機關辦理公有建築物作業手冊。 [16] 王維志、林俊昌、及張書萍 [2001],“高科技廠房營建工程特性之探討”,營建管 理季刊,第 48 期,第 10-19 頁。 [17] 王翰翔(2003),“新興公共建築工程計畫審議與經費核定模式”,碩士論文,國立 交通大學土木工程研究所。 [18] 王思琳 [2005],“從資訊流建立規劃設計程序最佳化之模式”,碩士論文,國立成 功大學土木工程研究所。 [19] 呂翊民(2003),“「公共工程技術資料庫整合計劃」整合性之探討”,碩士論文,
15 國立交通土木工程研究所。 [20] 林芳如(2007),“「需求引導評估流程模式之建構 - 以科技設施廠房為例”,碩 士論文,國立交通土木工程研究所。 [21] 林芳如、王維志 (2008),“需求引導評估流程模式之建構”,第十二屆營建工程與管 理學術研討會論文集,台灣高雄。 [22] 李青樺(2007),“「運用資料流程圖建構先期規劃需求整合流程模式”,碩士論文, 國立交通土木工程研究所。 [23] 李青樺、楊智斌、王維志 (2008),“運用資料流程圖建構先期規劃需求整合流程模 式”,第十二屆營建工程與管理學術研討會論文集,台灣高雄。 [24] 林家立、李明聰、王維志 (2009),“以 SIA-NRM 模式建構專案設計延遲改善策略”, 第十三屆營建工程與管理學術研討會論文集,台灣屏東。 [25] 莫國箴 [2003],“建築設計條件訊息傳遞對建築師認知效果影響之研究-以大學圖 書館為例”,碩士論文,國立台灣大學土木工程研究所。 [26] 陳惠娟 [2004],“結合QFD及模糊基因演算法於工程設計之應用”,碩士論文,國 立成功大學土木工程研究所。 [27] 戴期甦、何純平 [2000],“設計管理之模式與技術”,營建管理季刊,12 月,第 50 頁至 57 頁。
1
國科會補助專題研究計畫項下出席國際學術會議心得報告
日期 99 年 07 月 31 日計畫編號
NSC 98-2221-E-009-169-
計畫名稱
科技設施工程之設計階段決策流程評估模式(III)
出國人員姓名 王維志
服務機構
及職稱
國立交通大學土木工程學
系 / 教授
會議時間 99 年 6 月 25 日至
99 年 6 月 27 日
會議地點 斯洛伐克-布拉發提斯拉發
(Bratislava, Slovakia)
會議名稱 2010 年第 27 屆營建工程自動化與機械化國際會議
(The 27
thInternational Symposium on Automation and
Robotics in Construction, ISARC 2010)
發表論文題目 運用 SIA 與 DEMATEL 技術以決定影響設計延遲之因素
(Using SIA and DEMATEL to identify the factors affecting
design delays)
註:Wang, W. C., Lin, C. L. and Lee, M. T. (2010), “Using
SIA and DEMATEL to identify the factors affecting design
delays,” Proceedings of the 27
thInternational Symposium on
Automation and Robotics in Construction (ISARC 2010),
25-27 June, Bratislava, Slovakia. (NSC98-2221-E-009-169)
2
The 27
thInternational Symposium on Automation and Robotics in Construction
(ISARC 2010)
Bratislava, Slovakia, 25-27 June, 2010
王維志 國立交通大學土木系
一、參加會議經過
2010 年第 27 屆營建工程自動化與機械化國際會議(ISARC,International Symposium on Automation and Robotics in Construction)是由國際工程自動化與機械化協會(The International Association for Automation and Robotics in Construction, I.A.A.R.C.)所主辦。 從 1984 年開始,ISARC 就在全球各地舉辦,本次會議從 2010 年 6 月 25 日至 6 月 27 日在斯洛伐克的布拉發提斯拉發(Bratislava, Slovakia)舉辦。
ISARC 國際研討會每年均吸引許多營建專家、學者與會參與發表及討論。本次研 討會除地主國之外,參與學者專家來自世界各國,包括德國、美國、英國、芬蘭、西班 牙、荷蘭、台灣、義大利、印度、捷克、韓國、澳洲、加拿大、日本等國家。本次 ISARC 會議主要內容包括(1)主要演說(keynote speech)與(2)論文發表。主要演說包括加拿大 Carl Haas 教授的「An international perspective on technology and productivity in construction」 以及 IAARC 的主席 Ronie Novon 教授所發表的「How can monitoring and control be automated」。
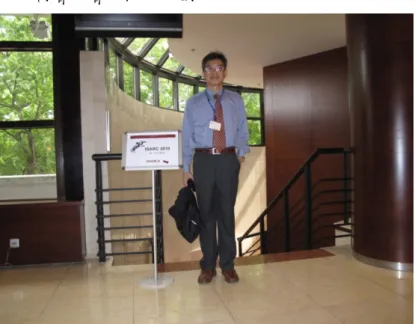
論文發表則分兩個場地依序進行,主要分為自動化與機械人之運用(automation and robotics application) 、 機 械 人 科 技 (Robot technology) 、 自 動 化 資 料 之 搜 索 與 監 控 (Automated data acquisition and monitoring) 、 資 訊 與 計 算 科 技 (Information and computational technology)、管理方面(Management and social issues)以及自動化之歷史 (Robotics history)。研討會大會之照片如圖 1。
3
二、與會心得
本人所發表之論文(運用 SIA 與 DEMATEL 技術以決定影響設計延遲之因素,using SIA and DEMATEL to identify the factors affecting design delays)於 6 月 26 日上午 10:45 至 11:00 進行。報告過程極為順利,當場並有美國學者提問,並也回應得宜。圖 2 與圖 3 為本人於現場報告的情況。 圖 2 論文發表情形-1 圖 3 論文發表情形-2 此次研討會所發表之論文摘要如下:本研究主要乃因專案設計延遲往往會導致工程 竣工時程的延宕,也會造成相關資源投入的虛耗,因此找出專案延遲的原因一直是專案 設計參與者所關注的,本研究試圖從設施使用、預算決策、專案管理與設計執行四個專
4 案設計流程主體來進行分析,找出彼此的相互關聯關係,倘若能夠釐清專案設計流程之 間的相互影響(支配)關係就可以有效降低專案設計延遲的發生,本研究透過專家訪談與 文獻回顧整理出使用需求與規範、組織決策與預算、專案控管與審查以及設計執行與協 調之四個構面與 17 個評估準則,並運用決策試驗與實驗評估法來建構設計延遲的網路 關聯圖,研究發現組織決策與預算是主要的影響專案設計遲延的構面。詳細內容可參考 發表之全文。
(英文摘要如下:Design delays can adversely affect the total completion time of a construction project. Factors affecting the delays of design duration are complicated and interrelated. This study proposes a methodology to support identify key driving factors affecting design delays and sieve out the initiating delay factors for improvement. The core of the methodology is to integrate a “satisfied importance analysis” and a “decision making trial and evaluation laboratory technique”. A real-world design project in Taiwan is applied to examine the benefits of the methodology. In this case study, four first-level delay factors and 17 second-level delay sub-factors are defined. The “organization’s decision makings and budget constraints” is identified as the key driving factor causing design delays in this case project. Top management of the case project appreciates the application results.)
本次參加 ISARC 會議,台灣約有 10 多位教授與博士生出席參與,人數應算不少, 對於增加台灣在國際上的能見度應有所助益。由於個人過去幾年曾參與此會議多次,與 一些國外學者熟識,此次亦有機會見到舊識,並做交流,就學術研究本身而言,此次參 與國際研討會在某種程度上瞭解國外類似研究的進展,應有助益。另,整體上,也發現 其實台灣在營建管理上之研究並不會落後國際的,且台灣應有一些經驗值得提供給國外 參考。當然,積極持續對外宣傳(包括在期刊與研討會上發表)應會是好的作法。
三、攜回資料名稱及內容
本次會議攜回會議論文集一本(記載此次研討會的所有發表文章之全文)、會議的議 程表(記載此次研討會的議程和時間)一本以及會議發表論文的光碟片。四、其他
明(2011)年 ISARC 國際研討會預定於韓國漢城舉行。27th International Symposium on Automation and Robotics in Construction (ISARC 2010)
USING SIA AND DEMATEL TO IDENTIFY THE FACTORS
AFFECTING DESIGN DELAYS
Wei-Chih Wang
National Chiao Tung University, Hsin-Chu, Taiwan [email protected]
Chia-Li Lin and Ming-Tsung Lee
National Chiao Tung University, Hsin-Chu, Taiwan [email protected]; [email protected]
Abstract
Design delays can adversely affect the total completion time of a construction project. Factors affecting the delays of design duration are complicated and interrelated. This study proposes a methodology to support identify key driving factors affecting design delays and sieve out the initiating delay factors for improvement. The core of the methodology is to integrate a “satisfied importance analysis” and a “decision making trial and evaluation laboratory technique”. A real-world design project in Taiwan is applied to examine the benefits of the methodology. In this case study, four first-level delay factors and 17 second-level delay sub-factors are defined. The “organization’s decision makings and budget constraints” is identified as the key driving factor causing design delays in this case project. Top management of the case project appreciates the application results.
KEYWORDS: design delays, satisfied importance analysis (SIA), decision making trial and evaluation laboratory technique (DEMATEL), influence-relations (IR) map
INTRODUCTION
The design of a facility includes conceptual design, schematic design and detailed design. During the conceptual and schematic design phases, a prime designer (architect / engineer or A/E) seeks to incorporate information from a wide range of disciplines; represent candidate solutions, and generate new states from the current ones based on the available information to meet the owner’s requirements. In the detailed design phase, the design deliverables must be met to prevent future construction work from being delayed.
However, numerous factors (such as clarity of user needs and timely decisions) can affect the duration performance of the abovementioned design phases. The design delays not only can
27th International Symposium on Automation and Robotics in Construction (ISARC 2010)
postpone the completion time of a construction project, but also they result into a waste of project resources. Unfortunately, identifying the right delay factors may not be easy because these factors are interrelated with each other. Especially, in practice, when delays arise, project participants (such as facility users, decision-makers, project management, and designers) frequently blame with each other and the delays remain.
This research proposes a methodology to identify the key factors affecting design delays and trace the initiating factors which dominate the key factors. Taking corrective actions on those initiating factors should be much effectively in preventing design delays. A real-world facility design project located in northern Taiwan is used as a case study. The following paper is organized as follows: First, the literature on design management is reviewed. Second, the proposed methodology is presented. Third, the case project is described. Fourth, the details of each methodological step are demonstrated using the case project. Finally, the conclusions and future work are provided.
LITERATURE REVIEW ON DESIGN MANAGEMENT
The importance of efficient design management to ensuring the smooth running of a project is being increasingly appreciated (Luh et al., 1999; Austin et al., 2000; Wang et al., 2006). Much research has been undertaken to better control the design process, and thus increase the effectiveness of the management of design duration. For example, Sanvido and Norton (1994) proposed a building design process model and identified the flow of information and knowledge that supports the development of the design. Some researchers have addressed the design process problems in a collaborative environment, including for example, miscommunication among designers and incompatibility of design data caused by changes to the design (Peng 1994, Hegazy et al 2001). So far, little research is related to identifying the key factors causing design delays.
PROPOSED METHODOLOGY
This work proposes a methodology to identify the delay factors and sub-factors for a design project. The steps of this methodology are as follows: (1) Step 1: defining the factors and sub-factors that may affect the performance of design duration. (2) Step 2: using the “satisfied importance analysis (SIA)” to assess the importance degree and satisfaction degree of each factor. A factor results into a delay when it is considered to perform unsatisfactorily. (3) Step 3: applying the “decision making trial and evaluation laboratory technique (DEMATEL)” to construct a cause-effect influence-relations (IR) map between factors. (4) Step 4: Integrating the evaluation results using the SIA and DEMATEL methods. That is, the
27th International Symposium on Automation and Robotics in Construction (ISARC 2010)
SIA indicates the key factors that are highly important and highly unsatisfactory to design delays. Then, DEMATEL traces initiating factors dominating those key factors. (5) Step 5: Further investigating the problematic sub-factors under the initiating factors. (6) Step 6: Improving the identified delay factors and sub-factors.
DESCRIPTION OF CASE PROJECT
The case project is the construction of a high-tech facility located in northern Taiwan. Total floor area is about 53,000 m2. The construction budget is approximately $84.2 million US dollars. The project client established a task force to manage the project throughout the project phases. The research team of this paper has worked closely with this task force. Currently, the project is in the construction phase. Construction duration is 950 calendar days.
FACTORS AFFECTING DESIGN DELAYS
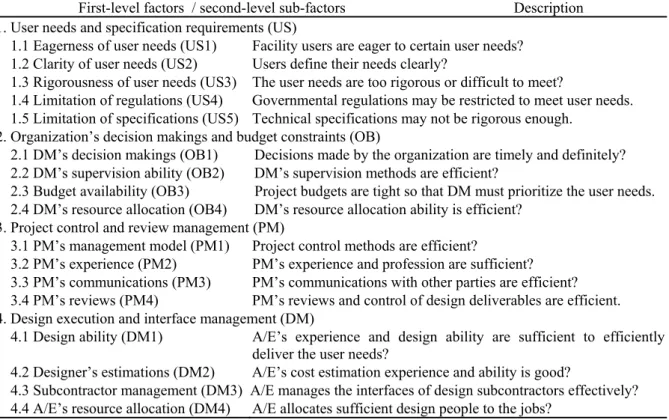
By interviewing with three project engineers and one project manager who are involved in the case project, four first-level delay factors and 17 second-level sub-factors are defined corresponding to four project participants (namely, users, decision-makers, project management, and designers). See Table 1.
Table 1: Factors and sub-factors affecting design delays
First-level factors / second-level sub-factors Description 1. User needs and specification requirements (US)
1.1 Eagerness of user needs (US1) Facility users are eager to certain user needs? 1.2 Clarity of user needs (US2) Users define their needs clearly?
1.3 Rigorousness of user needs (US3) The user needs are too rigorous or difficult to meet?
1.4 Limitation of regulations (US4) Governmental regulations may be restricted to meet user needs. 1.5 Limitation of specifications (US5) Technical specifications may not be rigorous enough.
2. Organization’s decision makings and budget constraints (OB)
2.1 DM’s decision makings (OB1) Decisions made by the organization are timely and definitely? 2.2 DM’s supervision ability (OB2) DM’s supervision methods are efficient?
2.3 Budget availability (OB3) Project budgets are tight so that DM must prioritize the user needs. 2.4 DM’s resource allocation (OB4) DM’s resource allocation ability is efficient?
3. Project control and review management (PM)
3.1 PM’s management model (PM1) Project control methods are efficient?
3.2 PM’s experience (PM2) PM’s experience and profession are sufficient? 3.3 PM’s communications (PM3) PM’s communications with other parties are efficient? 3.4 PM’s reviews (PM4) PM’s reviews and control of design deliverables are efficient. 4. Design execution and interface management (DM)
4.1 Design ability (DM1) A/E’s experience and design ability are sufficient to efficiently deliver the user needs?
4.2 Designer’s estimations (DM2) A/E’s cost estimation experience and ability is good?
4.3 Subcontractor management (DM3) A/E manages the interfaces of design subcontractors effectively? 4.4 A/E’s resource allocation (DM4) A/E allocates sufficient design people to the jobs?
27th International Symposium on Automation and Robotics in Construction (ISARC 2010)
APPLYING SIA AND DEMATEL TO THE CASE PROJECT
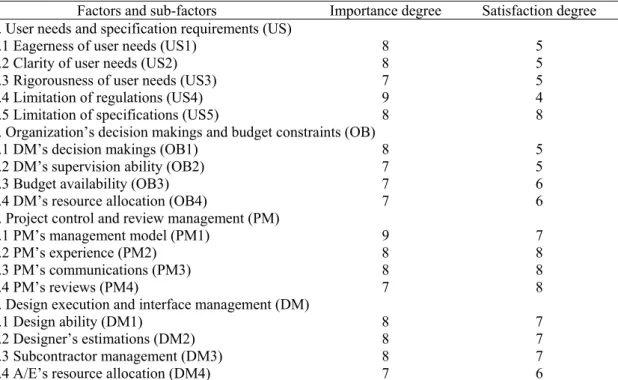
Collection of input dataThe data required to execute the SIA and DEMATEL are a set of questionnaires. 36 experts (engineers, section managers or managers who are involved in this case project) are asked to fill out each questionnaire. Table 2 presents an example of the questionnaire of SIA. Table 3 shows an example of questionnaire for executing DEMATEL. A respondent is asked to indicate the direct influence (or dominance) that he believes a factor exerts on each of the other factors based on an integer scale (ranging from 0 to 4). A high score indicates a belief that improvement in factor i is required to improve factor j. In Table 3, for example, suppose factor i (PCM) has little direct influence on factor j (US), then a score of “1” is given. Additionally, Cronbach’s α is used to test the reliability of the data collected from the questionnaires. The test results show that these data are reliable.
Table 2: An example of questionnaire for executing SIA
Factors and sub-factors Importance degree Satisfaction degree 1. User needs and specification requirements (US)
1.1 Eagerness of user needs (US1) 8 5 1.2 Clarity of user needs (US2) 8 5 1.3 Rigorousness of user needs (US3) 7 5 1.4 Limitation of regulations (US4) 9 4 1.5 Limitation of specifications (US5) 8 8 2. Organization’s decision makings and budget constraints (OB)
2.1 DM’s decision makings (OB1) 8 5 2.2 DM’s supervision ability (OB2) 7 5 2.3 Budget availability (OB3) 7 6 2.4 DM’s resource allocation (OB4) 7 6 3. Project control and review management (PM)
3.1 PM’s management model (PM1) 9 7
3.2 PM’s experience (PM2) 8 8
3.3 PM’s communications (PM3) 8 8
3.4 PM’s reviews (PM4) 7 8
4. Design execution and interface management (DM)
4.1 Design ability (DM1) 8 7
4.2 Designer’s estimations (DM2) 8 7 4.3 Subcontractor management (DM3) 8 7 4.4 A/E’s resource allocation (DM4) 7 6
Note: The scores of importance degree and satisfaction degree range between 10 (highest importance or satisfaction) and 0 (lowest importance or satisfaction).
Table 3: An example of questionnaire for executing DEMATEL
Factor i Factor j 1. US 2. OB 3. PM 4. DM 1. US 3 2. OB 3. PM 1 4. DM
27th International Symposium on Automation and Robotics in Construction (ISARC 2010)
Evaluation of SIA
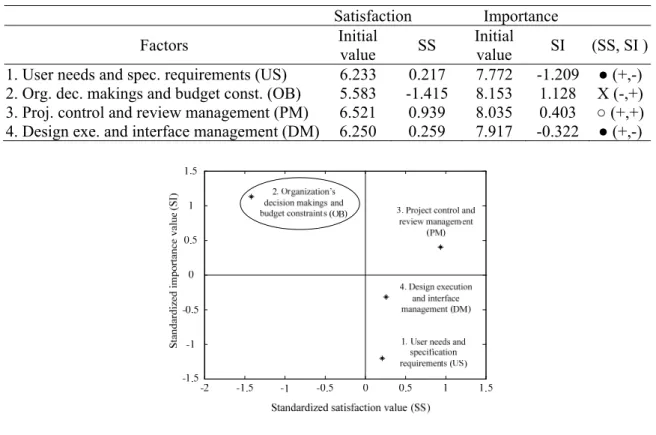
The input data (i.e., the satisfaction degree and importance degree of each factor and sub-factor) collected from the questionnaires will be normalized into the same measuring scales. The results classify the factors into four categories: (1) ○ (+,+) indicates a factor with high satisfaction and high importance, (2) ● (+,-) indicates a factor with high satisfaction and low importance, (3) (△ -,-) indicates a factor with low satisfaction and low importance, and (4) X ,+) indicates a factor with low satisfaction and high importance. The fourth category, X (-,+), should receive the highest attention. Table 4 presents the evaluation results of SIA for the case study. Additionally, the OB factor falls into the fourth category (high importance, low satisfaction). Hence, the OB factor deserves for improvement immediately. Figure 1 graphically presents the SIA evaluation results.
Table 4: Satisfaction and importance degrees of factors
Satisfaction Importance Factors Initial value SS Initial value SI (SS, SI )
1. User needs and spec. requirements (US) 6.233 0.217 7.772 -1.209 ● (+,-) 2. Org. dec. makings and budget const. (OB) 5.583 -1.415 8.153 1.128 X (-,+) 3. Proj. control and review management (PM) 6.521 0.939 8.035 0.403 ○ (+,+) 4. Design exe. and interface management (DM) 6.250 0.259 7.917 -0.322 ● (+,-)
Figure 1: SIA analysis of the factors
Evaluation of DEMATEL
The DEMATEL method was developed for a Science and Human Affairs Program by the Battelle Memorial Institute of Geneva to solve complex and interrelated problems (Gabus and Fontela, 1973; Tzeng et al., 2007; Wu and Lee, 2007; Li, 2009; Lin and Tzeng, 2009). The steps to execute the DEMATEL are (Li 2009; Lin and Tzeng, 2009): (1) finding the average matrix,
27th International Symposium on Automation and Robotics in Construction (ISARC 2010)
(2) calculating the direct influence matrix, (3) calculating the indirect influence matrix, (4) deriving the total influence matrix, and (5) obtaining the influence-relations map.
Step D1: Finding the average matrix
Suppose there are h experts available to solve a complex problem and there are n factors to be considered. The scores given by each expert give a n × n non-negative answer matrix Xk, with 1 ≤ k ≤ h. Thus X1, X2… Xh are the answer matrices for each of the h experts, and each element of Xk is an integer denoted by k
ij
x . The diagonal elements of each answer matrix Xk are all set to zero. We can then compute the n×n average matrix A by averaging the h experts’ score matrices. The (i, j) element of average matrix A is denoted by aij,
∑
= = h k k ij ij x h a 1 1 (1)Table 5 displays an average matrix (average matrix A) of the factors.
Table 5: Average matrix A of the factors
Factors US OB PM DM Sum 1. User needs and spec. requirements (US) 0 3.111 2.972 2.861 8.944 2. Org. dec. makings and budget const. (OB) 3.167 0 3.056 2.750 8.973 3. Proj. control and review management (PM) 2.500 2.361 0 2.861 7.722 4. Design exe. and interface management (DM) 2.583 2.361 2.778 0 7.722
Sum 8.250 7.833 8.806 8.472
Step D2: Calculating the direct influence matrix
A direct influence matrix D is obtained by normalizing the average matrix A. That is, D = s A, where ] max 1 , max 1 [ 1 1 1 1≤≤
∑
= ≤ ≤∑
= = n i ij n j n j ij n i a a Min s (2)Table 6 shows the direct influence matrix D for the factors.
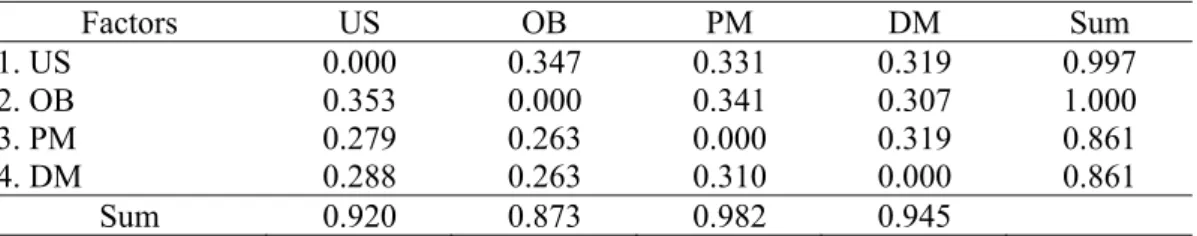
Table 6: Direct influence matrix D for the factors
Factors US OB PM DM Sum 1. US 0.000 0.347 0.331 0.319 0.997 2. OB 0.353 0.000 0.341 0.307 1.000 3. PM 0.279 0.263 0.000 0.319 0.861 4. DM 0.288 0.263 0.310 0.000 0.861 Sum 0.920 0.873 0.982 0.945
27th International Symposium on Automation and Robotics in Construction (ISARC 2010)
Step D3: Calculating the indirect influence matrix
A continuous decrease of the indirect effects of problems is along the powers of matrix, e.g.,
2
D , D3… D∞. This guarantees convergent solutions to the matrix inversion. The indirect influence matrix ID can be obtained based on the values of direct influence matrix D. That is,
2 1 2 ( ) i i ∞ − = =
∑
= − ID D D I D (3)where I is the identity matrix. Table 7 presents the indirect influence matrix ID for the factors.
Table 7: Indirect influence matrix ID for the factors
Factors US OB PM DM Sum 1. US 3.196 2.984 3.283 3.195 12.658 2. OB 3.115 3.083 3.290 3.211 12.699 3. PM 2.783 2.680 2.995 2.836 11.294 4. DM 2.782 2.682 2.924 2.915 11.303 Sum 11.876 11.429 12.492 12.157
Step D4: Deriving total influence matrix
The total influence matrix T is defined as follows:
= + T D ID (4) 1 1 ( ) i i ∞ − = =
∑
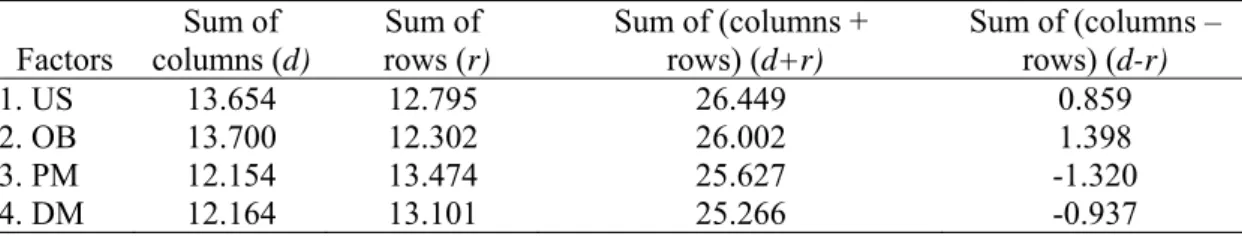
= − T D D I D (5) [ ],tij i j, 1, 2,...,n = = T (6)Table 8 presents the total influence matrix for the factors. Additionally, suppose di denotes the row sum of the i-th row of matrix T. Then d can represent the sum of direct and indirect i influences of factor i on the other factors. If rj denotes the column sum of the j-th column of matrix T, then rj indicates the sum of direct and indirect influences that factor j has received from the other factors. Furthermore, when j = i, di+ri provides an index of the strength of influences given and received. If di-ri is positive, then factor i influences other factors more than it is influenced. Conversely, if di-ri is negative, then factor i is influenced by other factors (Tzeng et al., 2007). Table 9 shows the results of d+r and d-r for the factors.
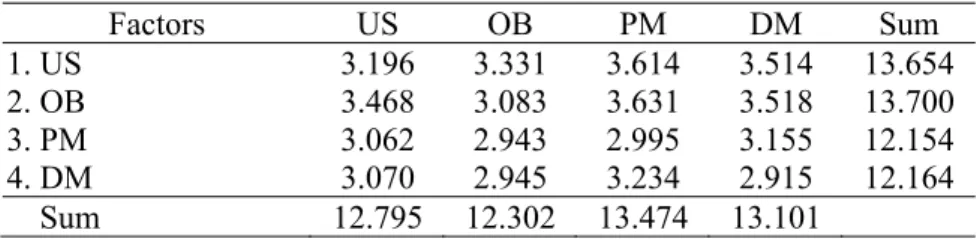
Table 8: Total influence matrix T for the factors
Factors US OB PM DM Sum 1. US 3.196 3.331 3.614 3.514 13.654 2. OB 3.468 3.083 3.631 3.518 13.700 3. PM 3.062 2.943 2.995 3.155 12.154 4. DM 3.070 2.945 3.234 2.915 12.164 Sum 12.795 12.302 13.474 13.101
27th International Symposium on Automation and Robotics in Construction (ISARC 2010)
Table 9: Degree of total influence for the factors
Factors Sum of columns (d) Sum of rows (r) Sum of (columns + rows) (d+r) Sum of (columns – rows) (d-r) 1. US 13.654 12.795 26.449 0.859 2. OB 13.700 12.302 26.002 1.398 3. PM 12.154 13.474 25.627 -1.320 4. DM 12.164 13.101 25.266 -0.937
Step D5: Obtaining the influence-relations map
An influence-relations map can be developed using the values of d+r and d-r to be the x axis and y axis, respectively. Figure 2 presents the IR map for the case project. Additionally, a net influence matrix N can also be calculated as follows:
ij ij ji
N=nt = −t t (7) For example, based on the total influence matrix T for the factors (Table 8), the net influence of the OB factor on the US factor is calculated to be 0.137 (=3.468-3.331).
Figure 2: Influence-relations map of the factors
Integration of SIA and DEMATEL
Figure 3 integrates the evaluation results of applying the SIA and DEMATEL methods. The left of the figure (SIA) shows that the “organization’s decision makings and budget constraints (OB)” factor has a positive value of importance (i.e., a high influence on the performance of design duration) and a negative value of satisfaction (i.e., unfavorable performance of design duration). That is, the performance of the OB factor requires to be improved immediately. Management then should trace which factor dominates the OB factor from the right of the figure (DEMATEL). The DEMATAL suggests that improving the performance of the OB factor must improve itself because the performance of the OB factor is only dominated by itself.
27th International Symposium on Automation and Robotics in Construction (ISARC 2010)
Figure 3: Integration of SIA and DEMATEL for the factors
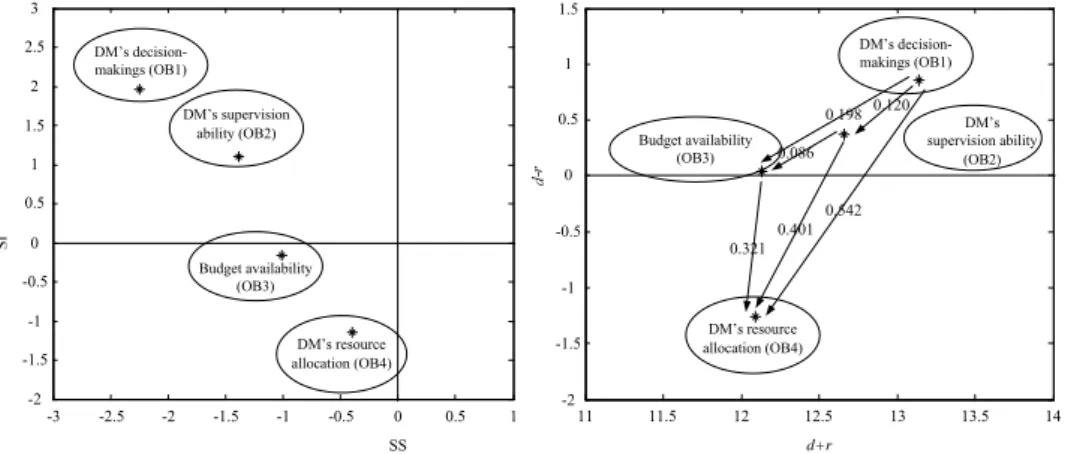
Tracing to the second-level sub-factors
The next step is to further find out which sub-factors under the OB factor are the most influential factors that cause the design delays. Using the similar steps of SIA and DEMATEL methods, the results found that sub-factors OB1 (DM’s decision makings) and OB2 (DM’s supervision ability) need to be improved immediately under the OB factor. Figure 4 displays the IR map for the sub-factors under the OB factor.
Figure 4: IR map for the sub-factors under the OB factor
CONCLUSIONS
Based on a real design project, this work proposes a methodology to support analyze and solve design delay problems. In the case study, the SIA analysis indicates that the OB factor is the key delay factor. Additionally, suggested by the DEMATEL analysis, improving the performance of the OB factor is to improve itself. Next, using the similar steps of SIA and DEMATEL, the results found that the OB1 and OB2 sub-factors of the OB1 factor must be improved immediately. Top management of the case project appreciates the application results. Future research is to computerize the proposed methodology for expediting the
-2 -1.5 -1 -0.5 0 0.5 1 1.5 -1.5 -1 -0.5 0 0.5 1 1.5
Standardized satisfaction value (SS)
1. User needs and specification requirements (US) 2. Organization’s
decision makings and
budget constraints (OB) 3. Project control and review management (PM) 4. Design execution and interface management (DM) 25 25.2 25.4 25.6 25.8 26 26.2 26.4 26.6 26.8 27 -2 -1.5 -1 -0.5 0 0.5 1 1.5 2 d+r 0.137 0.552 0.444 0.573 0.668 0.080 4. Design exe. & interface manage. (DM) 3. Project control and review management (PM) 2. Organization’s decision makings
and budget constraints (OB)
1. User needs and specification requirements (US) 11 11.5 12 12.5 13 13.5 14 -2 -1.5 -1 -0.5 0 0.5 1 1.5 d+r 0.120 0.198 0.542 0.086 0.401 0.321 DM’s resource allocation (OB4) Budget availability (OB3) DM’s supervision ability (OB2) DM’s decision-makings (OB1) -3 -2.5 -2 -1.5 -1 -0.5 0 0.5 1 -2 -1.5 -1 -0.5 0 0.5 1 1.5 2 2.5 3 SS DM’s supervision ability (OB2) DM’s resource allocation (OB4) DM’s decision-makings (OB1) Budget availability (OB3)
27th International Symposium on Automation and Robotics in Construction (ISARC 2010)
evaluations such that proper actions can be taken in time for supporting design duration management.
ACKNOWLEDGEMENT
The authors would like to thank the National Science Council of Taiwan for financially supporting this research under Contract No. NSC98-2221-E-009-169. Those respondents and experts involved in the case study are appreciated for their collaboration.
REFERENCES
Austin, S., Baldwin, A., Li, B., and Waskett, P. (2000) Analytical design planning technique (ADePT): a dependency structure matrix tool to schedule the building design process. Construction Management and Economics, 18, 173-182.
Gabus, A., and Fontela, E. (1973) Perceptions of the world problematique: communication procedure, communicating with those bearing collective responsibility. DEMATEL Report No. 1, Geneva, Switzerland, Battelle Geneva Research Center.
Hegazy, T., Zaneldin, E., and Grierson, D. (2001) Improving design coordination for building projects. I: information model. Journal of Construction Engineering and Management, ASCE, 127(4), 322-329.
Li, C. W. (2009) A Structure Evaluation Model for Technology Policies and Programs, PhD Dissertation, Institute of Management of Technology, National Chiao Tung University, Taiwan.
Lin, C. L., and Tzeng, G. H. (2009) A value-created system of science (technology) park by using DEMATEL. Expert Systems with Applications, 36 (6), 9683-9697.
Luh, P. B., Liu, F., and Moser, B. (1999) Scheduling of design projects with uncertain number of iterations. European Journal of Operational Research, 113, 575-592.
Peng, C. (1994) Exploring communication in collaborative design: cooperative architectural modelling. Design Studies, 15, 19-44.
Sanvido, V. E., and Norton, K. J. (1994) Integrated design-process model. Journal of Management in Engineering, 10(5), 55-62.
Tzeng, G. H., Chiang, C. H., and Li, C. W. (2007) Evaluating intertwined effects in e-learning programs: a novel hybrid MCDM model based on factor analysis and DEMATEL. Expert Systems with Applications, 32 (4), 1028-1044.
Wang, W. C., Liu, J. J., and Liao, T. S. (2006) Modeling of design iterations through simulation. Automation in Construction, 15(5), 589-603.
Wu, W. W., and Lee, Y. T. (2007) Developing global managers' competencies using the fuzzy DEMATEL method. Expert Systems with Applications, 32 (2):499-507.
98 年度專題研究計畫研究成果彙整表
計畫主持人:王維志 計畫編號: 98-2221-E-009-169-計畫名稱:科技設施工程之設計階段決策流程評估模式(III) 量化 成果項目 實際已達成 數(被接受 或已發表) 預期總達成 數(含實際已 達成數) 本計畫實 際貢獻百 分比 單位 備 註 ( 質 化 說 明:如 數 個 計 畫 共 同 成 果、成 果 列 為 該 期 刊 之 封 面 故 事 ... 等) 期刊論文 0 0 100% 研究報告/技術報告 1 1 100% 研討會論文 3 3 100% 篇 論文著作 專書 0 0 100% 申請中件數 0 0 100% 專利 已獲得件數 0 0 100% 件 件數 0 0 100% 件 技術移轉 權利金 0 0 100% 千元 碩士生 4 3 100% 博士生 1 2 100% 博士後研究員 0 0 100% 國內 參與計畫人力 (本國籍) 專任助理 0 0 100% 人次 期刊論文 0 0 100% 研究報告/技術報告 0 0 100% 研討會論文 1 1 100% 篇 論文著作 專書 0 0 100% 章/本 申請中件數 0 0 100% 專利 已獲得件數 0 0 100% 件 件數 0 0 100% 件 技術移轉 權利金 0 0 100% 千元 碩士生 0 0 100% 博士生 0 0 100% 博士後研究員 0 0 100% 國外 參與計畫人力 (外國籍) 專任助理 0 0 100% 人次其他成果
(
無法以量化表達之成 果如辦理學術活動、獲 得獎項、重要國際合 作、研究成果國際影響 力及其他協助產業技 術發展之具體效益事 項等,請以文字敘述填 列。)一篇投稿國際期刊(審查中):Chia-Li Lin, Wei-Chih Wang, Ming-Tsung Lee, Chu-Hsuan Chung, Jang-Jeng Liu, and Yu-Kun Tsui. (2010) ""Application of SIA and IRM to Evaluate Design Delay Factors in a High-tech Facility Design Project,"" Journal of Management in Engineering, ASCE, (NSC98-2221-E-009-169) (in reviewing)
成果項目 量化 名稱或內容性質簡述 測驗工具(含質性與量性) 0 課程/模組 0 電腦及網路系統或工具 0 教材 0 舉辦之活動/競賽 0 研討會/工作坊 0 電子報、網站 0 科 教 處 計 畫 加 填 項 目 計畫成果推廣之參與(閱聽)人數 0