行政院國家科學委員會專題研究計畫 期中進度報告
持久性有機污染物在河口生態系統之暴露途徑受生地化作
用影響之研究(1/3)
計畫類別: 個別型計畫
計畫編號: NSC92-2211-E-002-027-
執行期間: 92 年 08 月 01 日至 93 年 07 月 31 日
執行單位: 國立臺灣大學環境工程學研究所
計畫主持人: 吳先琪
共同主持人: 張美玲
計畫參與人員: 傅崇德, 謝明凱
報告類型: 精簡報告
處理方式: 本計畫可公開查詢
中 華 民 國 93 年 5 月 31 日
The Exposure Route of POPs in the Estuarine Ecosystems and the
Effects of the Biogeochemical Factors –
Effect of Habitat deviation on the PCBs Accumulation of Liza affinis
Chung-Te Fu
a,b,* Shian-Chee Wu
aa
Graduate Institute of Environmental Engineering, National Taiwan University, 71 Zhou Shan St. Taipei city, 106 Taiwan Tel (Fax):886-2-23629435 tedfu@msa.vnu.edu.tw
b
Department of Environmental Engineering, Vanung University, 1 Vanung Rd. Chungli city, 325 Taiwan, Tel:886-3-4515811 ext 705, Fax:886-3-4622232
Abstract
This study investigated the Polychlorinated biphenyls (PCBs) contamination level of mullet fish (Liza
affinis) resided in the Er-Jen estuary, the Ann-Ping Harbour and nestled costal fish farms, and that of
surface sediments in this estuary were also examined to verify the seasonal fluctuation on the dietary source of PCBs in the estuarine mullet fish. The PCB body burdens of collected fish samples are proportional to the contamination level of their habitats and rank in sequence from the Er-Jen estuary, the Ann-Ping harbour to the fish farms. PCB content of the estuarine mullet has been approximately depleted to one half of that of 1990’s peak value. Although the farmed fish inhabiting near the two hot spots and whose PCB burden is higher than that of the average of local fish markets, no particularly high contamination level was observed in their bodies. Applying light PCB fraction ((triCB + tetraCB) / total PCBs) as the indicator of the origins of PCB, mullet fish near the former contamination hot spot performed higher body burden with lower light PCB fraction, while the farmed fish exhibited the PCB pattern more likely that originated from air-water exchange. Preliminary study on the transformation of PCB burden from mother mullet to their next generation through reproduction indicated that congener-specific characteristics dominate this transformation. Higher fraction of heavy-chlorinated PCBs, rather than light-chlorinated congeners, observed in the eggs indicated that resistance to PCB biotransformation of heavy congeners led to this result. Although the PCB contamination has been stopped for a decade, the residual contaminants, supposedly existing in soil and sediments, still contributes to the body burden of fish resided in the estuary and the harbour.
摘要
本研究藉由分析安平港航道,二仁溪口及分布其間之漁塭中的前鱗鯔體內以及二仁
溪口底泥中多氯聯苯之分布,以探討昔日重金屬回收行為所釋出之多氯聯苯在生物體內
之累積影響及其暴露途徑。研究結果顯示生長於較高污染潛勢棲地之魚體內累積有較高
之多氯聯苯,其污染程度依序為二仁溪河口,安平港航道及魚塭。而魚體內多氯聯苯同
源物之形態分析則透露出暴露途徑之差異。生長於污染潛勢較高之棲地的魚類樣本,由
於其主要暴露途徑為昔日底泥中殘存之多氯聯苯,所以其體內低氯數物種之比例愈低;
反之漁塭的魚體內則具有較高之低氯數物種比例,所以推斷其暴露途徑較可能是來自於
大氣與水相之傳輸作用。針對母代與子代間多氯聯苯之傳遞效應的初步研究結果顯示,
較高氯數之同源物因為較不易為生物所代謝及轉換,所以較高氯數之同源物便有較高之
傳遞比例。特定同源物之傳遞效率對
logK
ow之線性關係的相關係數為
0.77,表示傳遞效
率和多氯聯苯之物化特性相關。
1. Introduction
Polychlorinated biphenyls (PCBs) were highly stable chemicals that had been introduced to the environment from various industrial applications such as the production and uses of transformers and capacitors starting several decades ago. PCBs were widespread in the world and were transported among different environmental media such as water bodies, atmosphere, soils and even biota. Bioconcentration and biomagnification of these persistent organic pollutants in biota have been considered as a global problem. A great number of researches have demonstrated the exposure routes how PCBs were sorbed into the biota. Habitat deviations were one of the most dominant factors for the spatial distribution differences in concerned regions. The Er-Jen River as the most contaminated water body of Taiwan area, the biota in this area was unavoidable to be contaminated by the surface sediment and river water. However, the PCB contamination level of the biota resided in the nearby harbour and coastal fish farms still left unknown. Were these fish also polluted by former metal recovery operation or escaped from this disaster? The contamination level and exposure route of the biota live in the concerned habitats deserved more investigation. Additionally, transformation rate of PCBs toward next generation through reproduction process, which dominated the contamination level of further generation and sink of PCBs in the contaminated region has never been examined in these region. Therefore, elucidation on the contamination level and exposure of concerned habitats and transformation of further generation need further investigation.
Ann-Ping was built by the Netherland colonial occupants as the first economical and political center of Taiwan in 1624. The Ann-Ping harbour had been one of the most important trading throats in southern Taiwan for the past three centuries. During the latest century, however, the deposition of silt from upstream erosion clogged the water canals, cut the loading capacity and finally limited her trading operation. Then, at the early 1980s’, ship dismantling industry came into this harbour and soon became one of the prevalent business in this harbour. Ships were dismantled in this harbour and recovered for steel, electrical devices, and other valuable parts. Some of these devices such as capacitors and transformers were delivered to the nearby Er-Jen estuary for further recovery of valuable metal. The on-site open burning and acid washing operations held for the metal recovery at the esturine region heavily polluted her ecosystem. Additionally, the on-site destruction of transformers and capacitors in the river shore led to the leakage of transformer oil into surrounding media and seriously contamination of the soil, river water, river sediment and even the biota residing in this estuary. Extremely high PCB content was found in the topsoils of the estuary river shore in early 1990’
(Huang et al, 1992). High PCB body burdens were also detected in the biota inhabiting this estuary (Chen et al, 1994, Ling et al, 1995) and nearby costal farms (Lu et al, 1995).
Nevertheless, without authoritative restriction on fishing in the harbor and the estuary, commercial fishing and sport fishing still prevails in these two regions. Fishes caught in these areas may have the possibility to threaten the health of the consumers for whose long-term intake of the contaminated fishes. Furthermore, a number of coastal fish farms nestled to the harbor and the estuary were suspected exposed to the contamination through air-water exchange and atmospheric deposition due to former larger scale recovering operation (Ling et al, 1995; Lu et al, 1995). Fish in these farms, though; are considered not to contact with the former contaminated sediment directly, still have the potential to accumulate PCBs from water and airborne particles deposited. Until now these farms are still providing the majority of fish supply for local fish markets.
The predominant species in the concerned area (Kuo and Shao, 1999), mullet fish (Liza affinis), is a benthic feeder, for which sediment detritus comprised 98 % of its dietary source (Horinouchi and Sano, 2000). Therefore, the PCBs retained in the sediments were presumed to be the dominant source of the fish that resided in these two suspected hot spots. On the other hands, the fish that inhabited the nearby coastal fish farms without direct contact with the
contaminated sediments are supposedly to experience PCBs through the water rather than the sediment. Thus, PCB concentration profile of these concerned fish may exhibit different shape, and the PCB body burden may also vary significantly according to their
life experience.
In the past, most of the studies were focused on the fishes residing in this estuary. There is lack of understanding on the extent of PCB accumulation and exposure route of fishes that inhabited and the fish farms. Therefore, the bioaccumulation potential of PCBs toward to the fish inhabiting these regions deserves further investigation and detail inspection. By investigating the PCB content and congener profiles of fish samples from the estuary, the harbour and the fish farm, this study will elaborate the contamination level and exposure pathway of PCBs toward to the organism that resided in these regions.
2. Material and Methods
2.1 Sample collection.
Eleven sampling sites for surface sediments were situated along the estuary and were named EJ1 to EJ11 in the direction from upstream to the river mouth. EJ1 was located most upstream as the background reference. EJ2 was at the intersection of the mainstream and the heavily polluted main branch
Sanyekon Creek, which contributes more than 60% of the total pollutant load to Er-Jen River. EJ6 was in front of the sewage and storm water combined sewer outlet. EJ4 was near the former metal recovery-processing site, Nan-Din Bridge; and EJ9, EJ10and EJ11 were situated around the river mouth. Sediment samples were collected in September 2003. Surface sediments were collected with a sediment grabber and were sent to the laboratory within 5 hours.
Mullet fish were chosen to be the target species for its highly accumulation potential as observed in previous studies (Cheng et al, 1994, Wang et al, 2000). Nineteen mullet fish samples of the Ann-Ping harbour were collected in May (n = 9) and September (n = 10) 2003 from the main sport fishing region near Billion-year Fortress, a famous touring attraction of official certificated first-class heritage. The fish samples of the Er-Jen estuary were collected in May (n = 35) and September (n = 16) 2003. Eight fish confirmed to be raised in the local fish farm near the Er-Jen estuary were purchased in September 2003 from the local fish market. Due to inappropriate collection season of mullet fish, no available sample from local fish market in spring. All samples were refrigerated and delivered to laboratory for further processing.
2.2 Sample preparation and analyses.
The sediment and fillet of fish samples were freeze-dried for 100 hours and ground or crumbled into fine powder and mince. About 10.0 gram of sediment or 5.0 grams of dry mince were transferred into a soxhlet apparatus and extracted by 300 mL of the mixture of the residue grade acetone and n-hexane (1:1, v/v) in a 70℃ water bath for 36 hours. The extracts were then concentrated to 1mL on a rotary evaporator (Büchi) and cleaned by 5 mL concentrated sulfuric acid (Merck), then back extracted with hexane three times and concentrated to 1 mL by nitrogen purging. The 1 mL concentrate then passed through one 30 cm long pipette (10mm ID) packed with sulfuric acid (Merck) treated silica gel (70-230 mesh, for column chromatography, Macherey-Nagel), silver nitrate (J.T. Baker) coated silica gel and florisil (Merck). This extract was finally eluted with 70 mL n-hexane and rotary-evaporated to 1 mL for GC analysis. Fish lipid content analyses were determined through weighing after rotary evaporation prior to the purification with concentrated sulfuric acid.
PCB contents were quantitatively analyzed by a high resolution gas chromatograph (Agilent 6890N)
equipped with a 63Ni electron capture detector (ECD)
and a 30 m×0.25 mm×0.25μm, 5% phenyl phase fused silica capillary column (RT-5mx, J&W ). The column flow was set at 1 mL/min with a linear velocity of 27 cm/min. The oven temperature program was as following : 80℃ for 4 min, to 160℃
at 20℃/min, to 265℃ at 2℃/min, to 295℃ at 25℃ /min and hold for 5 min. The injector was set at 250 ℃ with splitless mode, and the detector was set at 295℃. A mixture of Aroclor 1242/1254/1260 (1:1:1) was introduced as the quantification standard (Supelco). Forty-two peaks (IUPAC NO. 18, 16, 28/31, 33, 52, 49, 48/47, 41, 70, 66/95, 56, 92, 101, 99, 83, 97, 110, 151, 135, 149, 118, 146, 153, 105, 141, 163, 138, 158, 187, 183, 128, 185, 174, 177, 171, 180, 170, 201, 203, 195 and 194) were identified and summarized as ΣPCB. Decachlorobiphenyl CB209 (Supelco) was spiked into the sample before the extraction as a surrogate of the target compounds. The internal standard of GC performance was 2,4,6-Trichlorobiphenyl CB30 (Supelco). One additional mixed congener standard (CB18, 28, 31, 52, 44, 101, 149, 118, 153, 138, 180 and 194, Supelco) was applied to evaluate the selected congeners’ quantities of Aroclor mixture standard, the deviation between these two standards was
% 7
15± . The recovery of surrogate CB209
was78±7% of all fish samples and 83 of
sediment samples. All data were not corrected to the recovery.
% 10 ±
3. Results and Discussion
3.1 Sediment samples
3.1.1 PCBs in sediment
The PCBs of surface sediment were in the range of 4.3 to 109 ng/g dw with the average of
32 2
41. ± ng/g. The highest concentration was found
in the former PCB contaminations hot spot, the Nandin bridge (EJ4). The lowest concentration located in the upstream site of this river, which were chosen as the background site. The concentration deviations were mostly depended on the spatial characteristics of their origins. Surface sediment in the former PCB contaminations hot spots performed higher content than the others.
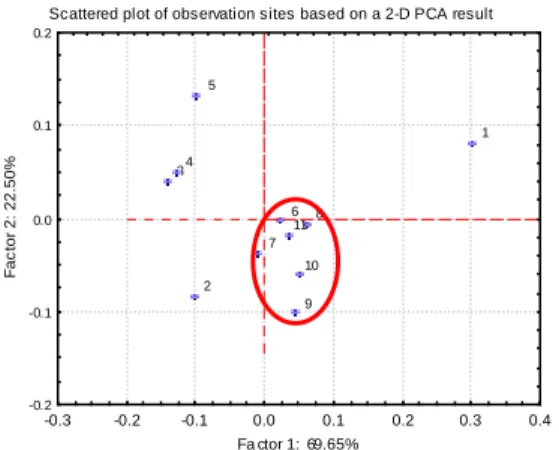
PCA analysis, as shown in Figure 1, exhibited the distribution of PCB content in different estuarine sector. Apparently, river mouth zone, from the sewage outlet to the river mouth, possessed similar congener profile, while that of the other sectors are distinct to the mouth zone. This result exhibited the influence of external contamination source to this estuary. This result is coincident to our previously study which precipitation event was most responsible for the seasonal variation of estuarine sediment.
The congener profiles deviated significantly in the upstream sites of the sewage outlet, while that of the downstream sites after the outlet performed more similar patterns. Main congeners in the most upstream site EJ1 were low chlorinated members such as PCB 52, 49 and 70. That of the EJ2 distributed more evenly that no particular high congeners in its profile. The esturine sector exhibited higher heavy chlorinated content than the other sites did, while the main congeners of the river mouth area
were PCB52, 28 and 18, not the CB 153, 138 and 180 that most appeared in the estuarine sector.
Scattered plot of observation sites based on a 2-D PCA result
1 2 3 4 5 6 7 8 9 10 11 -0.3 -0.2 -0.1 0.0 0.1 0.2 0.3 0.4 Fa ctor 1: 69.65% -0.2 -0.1 0.0 0.1 0.2 F a c tor 2: 22. 50%
Figure 1. Case distribution of PCA analysis on PCB content of surface sediment in the Er-Jen estuary
EJ1 EJ2 EJ3 EJ4 EJ5 EJ6 EJ7 EJ8 EJ9 EJ10 EJ11
P C B f ra c ti on ( % ) 0.0 0.1 0.2 0.3 0.4 0.5 0.6 0.7 light PCB fraction medium PCB fraction heavy PCB fraction
Figure 2. PCB homologue distribution of surface sediment in the Er-Jen estuary
3.1.2 PCB congeners profile deviation
Using the multi statistical analysis method, principal component analysis, to identify the deviation and similarity between these sites got the case distribution diagram as shown in fig.2. Apparently these sites were divided to four clusters: the upstream site (EJ1), the individual site located at the inlet of the Sanyekon creek to the Er-Jen estuary (EJ2), the esturine sector (EJ3 to 5) and the sewage outlet to the river mouth area (EJ6 to EJ11). TetraCB and HexaCB were the dominant factors for these variations and explained more than 90% of total variances. Simplified homologue distribution involved light PCBs (triCB + tetraCB), medium PCBs (pentaCB + hexaCB) and heavy PCBs (heptaCB + octaCB) were applied to the characterizing of these sampling sites. The homologue distribution of these sites was displayed in fig. . The ascending fraction of medium PCBs and descending fraction of light PCBs crossed at EJ2, while crossed again at EJ6 with inverse trend of these two homologues. The turning points observed in EJ2 and EJ6 reflected the influences from external contamination of these two introducing water channel. This region within the two channel performed distinct
pattern than the other sites. The esturine sector performed higher medium PCBs than the others did, while the downstream sites exhibited higher light PCB fraction. This phenomenon has been observed in year 2002 and discussed in the annual report for the NSC. Similar result found in year 2003 verified our observation and hypothesis on the distribution of PCBs in this area.
3.2 Fish samples
3.2.1 General information of fish samples
The general information of size, weight and lipid content of the collected samples are shown in Table 1. The average size and weight of the fish raised in the fish farms were larger than the wild ones. The lipid content of these samples deviated significantly within different habitats and seasons with the fish from the coastal farms ranked highest, followed by the harbour and the estuary. This could be attributed to the sufficient food supply in fish farms, while the fish grown in natural habitat were believed to have limited food supply and gain less as
comparing with the farmed ones
.
Through fish scale identification, the age of these fish samples were identified to ranged within one to two years old. No apparently deviation of the age was observed in these wild samples, however, the farmed ones are supposed to be older than the wild ones from their size and mature characteristics.
3.2.2 PCB concentration
3.2 PCB concentration
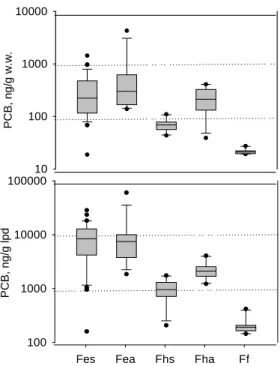
The average wet weight and lipid adjusted PCB contents of the mullet fish sample are displayed in Figure3. Apparently, the fish collected in the heavily contaminated Er-Jen estuary exhibited the highest PCB content (718 ± 1118 ng/g wet wt (ww) of autumn samples, and 338±304ng/g ww of spring samples), followed by those in the harbour (224 ± 122 ng/g ww of autumn samples, and 69 ± 18 ng/g ww of spring samples) and in the fish farm (22 ± 3 ng/g ww). Lipid adjusted PCB content exhibited similar result. Two extremely values in autumn as high as 4273 ng/g ww (60192 ng/g lpd) and 2544 ng/g ww (24700 ng/g lpd) significantly deviated from the autumn average value.
The habitat differences were believed to be the dominating factor for the deviation of these samples. Fish inhabiting the harbour and the estuary had exposed to higher PCB contamination level than the farmed ones had. The higher level was resulted from the residual PCBs sorbed in the suspended solids and sediments of the estuary and harbour, which were originated from former dismantling and recycling processes held in these regions.
The ever-published highest level (3400±470 ng/g dw) in Taiwan was observed in mullet fish in the Er-Jen estuary1994, and followed by tarpon
hybrids) at the same location in the same year (Table
2). The PCB content of the Er-Jen’s tilapia was 130 ng/g ww or was approximately equivalent to 500 ng/g dw (Wang et al., 2000), which was already 60% of the 1994’ peak value (825±451ng/g dw). It seemed a descending trend of PCB content in fish in the Er-Jen River after banning the use of PCBs for near a decade. Similarly, in our study, the average PCB content of the mullet fish was 1918 ng/dw, which was only 56 % of the 1994’s observed peak. Both studies reveal that approximate one half of the environmental source has been eliminated after one decade’s attenuation. However, there still PCB content as high as either 4273 ng/g ww or 18972 ng/g dw of the fish collected, which was four times higher than the national dietary standard. This value is much higher than the previously results observed from the river Seine (Chevreuil, et al., 1995, Blanchard et al., 1997), San Francisco bay (Fairey et al., 1997), German bight (Hühnerfuss et al., 1995), and almost close to the 1985’s peak value of the serious contaminated Hudson River (Brown et al., 1985). The reason for these extremely high PCB content in the mullet fish in this study is not clear yet.
The PCB contents of the fish samples from the Ann-Ping harbour in autumn and spring were 267 and 69 ng/g ww, respectively. In the past, no observation has ever been reported on the contamination level and exposure sources. Although the ship dismantling industry has been faded out for more than a decade, it is believed that the residues are still retained in this region and accumulated in the body of biota inhabiting there.
The PCB content was 22 ± 3 ng/g ww or 171 ± 23 ng/g lpd (lipid) in the fish from the fish farms, which was far less than those of the samples from the other two hot spots, and was in the same magnitude of the samples from other slightly contaminated local rivers as shown in Table 2. However, comparing with the farmed fish reported locally and abroad (Table 2) including the tilapia samples (0.18 ng/g wet wt.) in
Taiwan (Lung et al., 2003),the pooled fresh water
fish samples (7.8 ng/g wet wt.) collected from different supermarkets in the U.S. (Schecter et al., 1995), the PCB level is slightly higher and is in the range as the farmed bass in Portugal, 155 to 294 ng/g lpd (Antunes et al., 2004). In general, fish lived in the farms that nestled within the two hot spots did not show particularly high PCB content than other studies. However, the average PCB content of the studied fish in the concerned fish farms is still higher than those of the fish samples from other local fish markets. Though the content is far lower the dietary standard, the tendency of PCB accumulation in these fish farms deserves prolonged monitoring.
3.2.3 Congener profile
Total forty-two peaks, from
trichlorobiphenyls to octachlorbiphenyls, were identified as shown in Figure 5. In respect of the main congeners of these profiles, samples from the harbour and the estuary were different from that of the farmed ones. The main congeners of the former
two profiles were CB138, CB180, CB 153, and CB118, in which hexachlorobiphenyls and
pentachlorobiphenyls comprised major portion of the total PCBs; while those of the farm were CB52, CB118 and CB138, and tetrachlorobiphenyls and hexachlorobiphenyls were the most abundant congeners of the farmed samples.
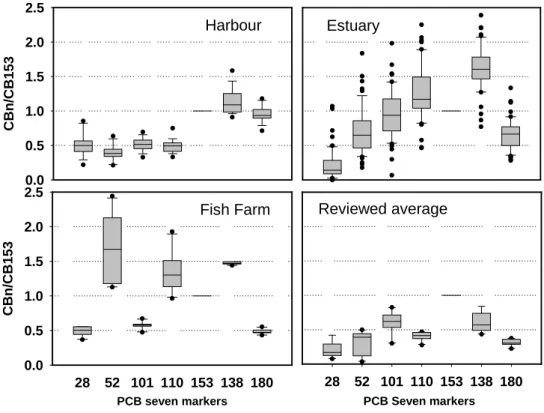
The higher ratio of CB138/CB153 and CB180/CB153 of the estuary and harbour’s fish, as shown in Figure 6, indicated that CB 138 and CB180 were the dominant congeners, However, the
dominant congener was CB52 in fish of the fish farm which is similar to what was found in the fish samples such as milkfish, white pomfret and hailtail that purchased from local fish markets of Taiwan (Lung et al., 2003), in which CB52 was the highest congener, followed by CB138 and CB153.
Additionally, in Lung’s study, the ratio of
CB52/CB153 of the hailtail samples from southern coast of Taiwan was even much higher than our observation. However, some observations reported in the literatures have shown CB153 is the highest one instead CB52 or CB138.
The fractions of individual congeners to Σ PCBs showing distinct deviation as observed in Figure 5 also imply that contamination situation of the habitats should have been different, and had even deviated in different season. The homologue
distributions of light PCBs (triCB + tetraCB), medium PCBs (pentaCB + hexaCB) and heavy PCBs (heptaCB + octaCB) in the concerned habitats are displayed in Figure 7. Medium PCBs is the main homologue of all the samples and comprises near 50% of the total content, while light and heavy PCBs share the other half. This chlorine-shift also correlates to the contamination origins. Samples from the Er-Jen estuary possessed the highest contamination level and exhibited the highest medium PCBs with lowest light PCBs, while the farmed fish exhibited lowest medium PCBs and highest light PCBs. The homologue distribution of the samples from the harbour that possessed medium contamination level ranged between the other two habitats. Such deviation was attributed to the contamination level and congener distribution of habitats where these fish samples came from.
Ashly and Baker (1999) has shown that sediments near emission source contained
heavy-chlorinated PCBs, while sediment far away hot spots exhibited light-chlorinated PCBs. The PCB content of the estuarine surface sediments was in the range of 706 to 7463 ng/g organic matter (Fu et al., unpublished data). Therefore, if surface sediments were assumed as the dietary source of benthic feeder such as our target fish, mullet, then fish samples from the contaminated estuary and the harbour should have carried higher chlorinated PCBs in their body, and fish raised in the farms should have exhibited more light chlorinated PCBs than the other habitats. In this study, the chlorination characteristics of studied samples in different habitats were exactly reflecting their origins.
have long been recognized as the hot spots of PCB contamination. Fish residing in these regions would unavoidably contact with the contaminated water and sediments. PCBs, retained in the sediments and dissolved in the water, were sorbed and accumulated in the fish body through gill exchange and dietary uptake. However, since light PCBs comprised major fraction of total PCB content in water, the exposure route of PCBs for farmed fish was most probably from the air-water exchange. The deviation of the congener profiles and chlorine shift in the homologue distribution also reflect either the local-contaminant
origin or the global long-range transport origin.
chlorination
light (tri+tetra) medium(penta+hexa) heavy(hepta+octa)
hom olo gue fract io n , % 0.0 0.2 0.4 0.6 0.8 Er-Jen. Spring Er-Jen. Autumn Harb. Spring Harb. Autumn Farm
Figure 6 Homologue distributions of fish samples in concerned habitats. PC B, n g /g w .w . 10 100 1000 10000
Fes Fea Fhs Fha Ff
PC B, ng/ g lp d 100 1000 10000 100000
3.2.4 Mother fish and their eggs
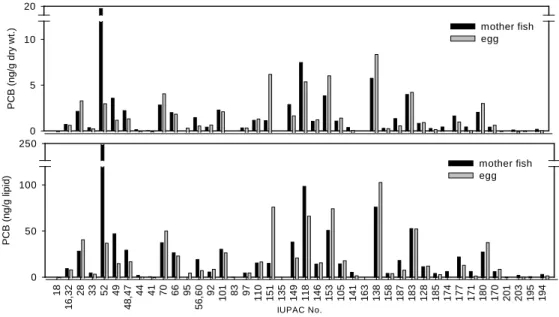
The dry tissue and lipid adjusted PCB concentration of the mother mullet and their eggs were 77, 69 ng/g dw, and 1010, 841 ng/g lpd, respectively. No significant difference of PCB content was observed in these samples. If the ratio of the eggs to their mother were expressed as the transfer rate, then the rate is 83% (lipid adjusted) and 90% (dry tissue), respectively. Less PCB content in the eggs and the rates were less than one reflected that PCB was transferred to the eggs through reproduction process, but no observed bioaccumulation transformed from the mother to the eggs.
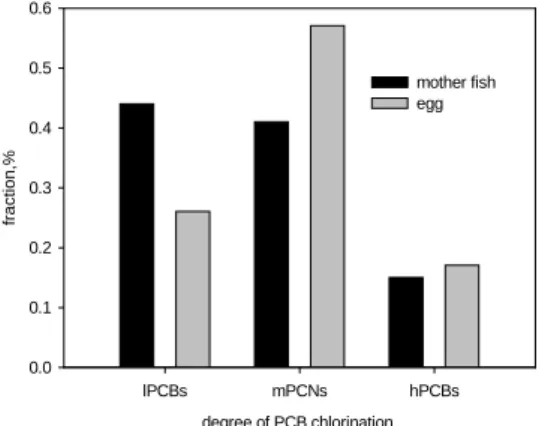
However, the completely congener profiles of the mother mullet and their eggs, as shown in Fig.7, were distinct in different specific congeners and homologues. PCB contents of some lower chlorinated congeners such as PCB52, PCB48, PCB44 and PCB66 in eggs were lower than their mother, while the PCB contents of some higher chlorinated congeners such as PCB153, PCB138, PCB183 and PCB180 in eggs were than their mother. As the medium chlorinated congeners such as PCB70, PCB101, PCB110, PCB149 and PCB118, no apparent ascending or descending trend found between the mother and their eggs. One simplified light, medium and heavy homologue fractions of these samples were shown in fig. .The main homologue of the mother mullet is light PCBs that comprise more than 40% of total PCBs, and the medium and heavy PCBs share the remaining. On the other hands, the main homologue of the eggs is medium PCBs that comprise more than 55% of total PCBs, and the light and heavy PCBs contribute less than one half of total PCBs. Obviously, chlorine shift from light chlorinated homologue to heavy ones was observed in the mother and their eggs.
Figure 3 PCB content of fish sample in concerned habitats in spring and autumn
-12 -10 -8 -6 -4 -2 0 2 4 6 8 10 12 Factor 1 -8 -6 -4 -2 0 2 4 6 8 10 Fa c to r 2 Fea Ff Fhs & Fha Fes
Figure 5 Case distribution of PCA analysis on PCB content of fish samples in concerned habitats.
The reason of this shift might be attributed to the PCBs transformation in the mother mullet. As discussed previously on the deviation of PCBs biotransformation in the juvenile and adult fish, light PCBs were much more readily for biotransformation
in the adult fish, while heavy PCBs are more resistant to such transformation. Those mother fish that possessed full-developed biotransformation of light PCBs were believed to have the potential to transform light PCBs, but were unable to metabolize the heavy ones. When PCBs were sorbed into the mother mullet, no matter through gill exchange or dietary uptake, light PCBs and heavy PCBs were all ingested into the body. During the embryo developing period, PCBs in their body were accompanied with metabolism of other essential building compound. It was assumed that light PCBs were eliminated during this reproduction process, but heavy PCBs were recalcitrant in this process and transferred directly to the eggs. On the other hand, light PCBs were continuingly sorbed into the mother mullet whenever they still resided in the contaminant region. Therefore, the eggs should exhibit higher heavy PCBs content than their mother did.
degree of PCB chlorination lPCBs mPCNs hPCBs fra c tion,% 0.0 0.1 0.2 0.3 0.4 0.5 0.6 mother fish egg
Figure 8. Homologue distribution of mother fish and their eggs. y = -4.40 + 0.68 logkow R = 0.77 log Kow 5.6 5.8 6.0 6.2 6.4 6.6 6.8 7.0 7.2 7.4 trasf e r fract ion, % -1.0 -0.8 -0.6 -0.4 -0.2 0.0 0.2 0.4 0.6 0.8
Figure 9. Correlation of transfer rate of PCB
congener and logKow between mother mullet and
their eggs.
The relationship of physicochemical characteristics of PCBs and transfer rate between the mother and their eggs were estimated by the log octanol-water partitioning constant, as shown in fig.9. The correlation coefficient (r = 0.77) was not larger
enough to fully support our hypothesis on above mentioned metabolism theory. Highly fluctuation of medium PCBs in the correlation shortened our assumption. However, transfer rate of descending of light PCBs and ascending of heavy PCBs in the eggs somewhat reflected the hypothesis we made on the mother fish and their eggs.
Literature cited
Antunes P., and Gil O., 2004, “PCB and DDT contamination in cultivated and wild sea bass from Ria de Aveiro, Portugal”,
Chemosphere, 54, 1503-1507
Ashley J.T.F. and Baker J.E 1999, “Hydrophobic organic contaminants in surficial sediment of Baltimore harbor: Inventories and sources” Environ. Toxicol. Chem. 18, 838-849 Berglund, O.; Larsson, P.; Ewald, G.; Okla, L 2001, “Influence of
trophic status on PCB distribution in lake sediments and biota”
Environmental Pollution, 113, 199-210
Blanchard M., Teil M. J., Carru A. M., Chesterikoff A. and Chevreuil M. 1997, “Organochlorine distribution and
mono-orthosubstituted PCB pattern in the roach (Rutilus rutilus) from the River Seine”, Wat. Res., 31, 1455-1461
Brown Mark P., Warner Mary B., Sloan Ronald J., 1985, “Polychlorinated Biphenyls in the Hudson River” Environ Sci
and Technol. 19, 656-661
Chen W. F., Wang H. C., and Liu C. Z.,” Fish species and PCBs concentration in the Er-Jen River “ Ann. Rept. of Nat. Inst.
Environ. Anal., Taiwan R.O.C. 1994 (in Chinese)
Chevreuil, M; Carru, A. M.; Chesterikoff, A.; Boet, P.; Tales, E., 1995, “Contamination of fish from different areas of the river Seine (France) by organic (PCB and pesticides) and metallic (Cd, Cr, Cu, Fe, Mn, Pb and Zn) micropollutants “, Sci Total
Environ, 162, 31-42
Fairey, R.; Taberski, K.; Lamerdin, S.; Johnson, E.; Clark, R. P.; Downing, J. W., 1997, “Organochlorines and Other Environmental Contaminants in Muscle Tissues of Sportfish Collected from San Francisco Bay” Marine Pollution Bulletin, 34, 1058-1071
Garcia Luz M., Porte Cinta and Albaiges Joan. 2000 “Organochlorinated Pollutants and Xenobiotic Metabolizing Enzymes in W. Mediterranean Mesopelagic Fish” Marine
Pollution Bulletin,,40, 764-768
Green N. W. and Knutzen J., 2003, “Organohalogens and metals in marine .sh and mussels and some relationships to biological variables at reference localities in Norway” Marine Pollution
Bulletin, 46, 362-377
Harding G. C., LeBlanc R. J., Vass W. P., Addison R. F., Hargrave B. T., Pearre S., Dupuis A., and Brodie P. F., 1997
“Bioaccumulation of polychlorinated biphenyls (PCBs) in the marine pelagic food web, based on a seasonal study in the southern Gulf of St. Lawrence, 1976-1977” Marine Chemistry, 56(3-4), 145-179
Huang C.W., Miyata H., and Lu Jr., 1992, “Levels of PCBS, PCDDS and PCDFS in soil samples from incineration sites for metal reclamation in Taiwan.” Chemosphere, 24 (11): 1669-1676 Huang H. Z. “Analysis of PCBs in the fishes of Tansui River,
1999 ”Ann. Rept. Nat. Inst. Environ. Anal., Taiwan R.O.C. (in Chinese)
Huang H. Z. “ Analysis of PCBs in the fishes of
Taiwan,1999 ”Ann. Rept. Nat. Inst. Environ. Anal., Taiwan R.O.C. (in Chinese)
Hühnerfuss, H.; Pfaffenberger, B.; Gehrcke, B.; Karbe, L.; König, W.A.; Landgraff, O. 1995, “Stereochemical Effects of PCBs in the Marine Environment: Seasonal Variation of Coplanar and Atropisomeric PCBs in Blue Mussels (Mytilus edulis L.) of the German Bight” Marine Pollution Bulletin, 30, 332-340 Hsu D. P., 1997 “ Measuring the concentration of PCBs congeners
with bioaccumulation toxicity analysis method.” Ann. Rept. of
Nat. Inst. Environ. Anal, Taiwan R.O.C. (in Chinese)
Liu C. Z and Huang H. Z. 1999 “ Analysis of PCBs content in fishes of Taiwan area with GC/MS “Ann. Rept. Nat. Inst.
Environ. Anal., Taiwan R.O.C. (in Chinese)
Loizeau V., Abarnou A., and Menesguen A. 2001 “ A steady-state model of PCB bioaccumulation in the sea bass (Dicentrarchus labrax) food web from the Seine estuary, France ‘ Estuary, 24(6B) 1074-1087
Lung, S. C., Chen, C.F., Hu, S. C. and Bau, Y. P., 2003 ‘Exposure of Taiwan residents to polychlorinated biphenyl congeners from farmed, ocean-caught, and imported Fish” Environ. Sci. Technol., 37,4579-4585
Manirakiza P., Covaci A., Nizigiymana L., Ntakimazi G. and Schepens P., 2002, “Persistent chlorinated pesticides and polychlorinated biphenyls in selected fish species from Lake Tanganyika, Burundi, Africa”, Environmental Pollution, 117, 447-455
Schecter A, Cramer P., Boggess K., Stanley J. and Olson J. R. 1997, “Levels of dioxins, dibenzofurans, PCB and DDE congeners in pooled food samples collected in 1995 at supermarkets across
the United States”, Chemosphere, 34, 1437-1447
Sijm D.T. H.M, Seinen W. and Opperhulzen A. 1992 “ Life-Cycle biomagnification study in fish” Environ Sci Technol, 26(11) 2162-2174
Stapleton, H.M., Skubinna, J. and Baker J.E., 2002 “Seasonal dynamics of PCB and toxaphene bioaccumulation within a Lake Michigan food web” J. Great lakes Res. 28(1) 52-64
Teil M. J., Blanchard M., Carru A. M., Chesterikoff A., and Chevreuil M. 1996 “ Partition of metallic and organochlorinated pollutants and monoorthosubstituted PCB pattern in the trophic web from different areas of the river Seine” Sci Total Environ. 181, 111-123
Wang C. H., Huang H. Z, and Hong W. C. “Analysis of PCBs in the fishes in Taiwan river, 2000 ”Ann. Rept. Nat. Inst. Environ.
Anal., Taiwan R.O.C. (in Chinese)
Wiklund A.K.E, Wiklund S.J., Axelman J. and Sundelin B. 2003 “Dynamics of lipids and polychlorinated biphenyls in a Baltic amphiod (Monoporeia affinis): A field study “Environ. Toxicol.
0 .0 0 0 .0 4 0 .0 8 0 .1 2 0 .1 6 E r - J e n ( s p r in g ) E r - J e n ( a u t u m n ) congener fraction % 0 .0 0 0 .0 4 0 .0 8 0 .1 2 0 .1 6 h a r b o r ( s p r in g ) h a r b o r ( a u tu m n ) IU P A C N o 18 16 ,3 2 28 33 52 49 48 ,4 7 44 41 70 95 ,6 6 56 ,6 0 92 101 99 83 97 110 151 135 149 118 146 153 105 141 163 138 158 187 183 128 185 174 177 171 180 170 201 203 195 194 0 .0 0 0 .0 4 0 .0 8 0 .1 2 0 .1 6 F is h f a r m
Figure 4. PCB congener profiles of mullet fish collected in different habitats in different season
Harbour CBn /CB153 0.0 0.5 1.0 1.5 2.0 2.5 Reviewed average PCB Seven markers 28 52 101 110 153 138 180 Estuary Fish Farm PCB seven markers 28 52 101 110 153 138 180 CBn /CB153 0.0 0.5 1.0 1.5 2.0 2.5
PCB (ng /g dry wt.) 0 5 10 20 mother fish egg IUPAC No. 18 16 ,32 28 33 52 49 48 ,47 44 41 70 66 95 56 ,60 92 101 83 97 110 151 135 149 118 146 153 105 141 163 138 158 187 183 128 185 174 177 171 180 170 201 203 195 194 P C B (n g/ g l ip id ) 0 50 100 250 mother fish egg
Figure 7. PCB congener profiles of mullet fish and their egg
Table 1 General information of fish samples
Sample description Size, cm Weighta, g Lipidb, %
Ann-Ping harbour spring meanc 18.0±1.36 68±15.2 6.23.2 (n=9) range 17.5-21 51-98 4.3-9.5 autumn mean 17.1±1.2 70.5±16.8 10.7±2.0 (n=10) range 16-19 67-72 8.5-14 Er-Jen estuary spring mean 17.6±2.3 65.0±19.0 4.4±2.8 (n=35) range 15-23.5 45-106 1.8-13 autumn mean 19.0±1.0 84.1±17.0 5.6±2.7 (n=18) range 17.3-20.5 74-106 2-10 Fish farm autumn mean 21.0±0.9 149.5±12.0 13.3±3.0 (n=8) range 21-23 141-166 9-16
a The weight of the whole fish,
b The lipid contents were based on the fillets.
Table 2
Location species content, ng/g reference note
Taiwan area
Er-Jen River Liza affinis 3400 ± 470 Cheng et al, 1994 dw
Er-Jen River Oreochromis hybrids 825 ± 451 Cheng et al, 1994 dw
Er-Jen River Megalops cyprinoides 918 ± 67 Cheng et al, 1994 dw
Er-Jen River Liza affinis 0-172 Hsu, 1997 dw
Keelung River Oreochromis hybrids 0.1-0.43 Hsu, 1997 dw
Keelung River Oreochromis hybrids 73 Liu & Huang, 1999 dw
Tansui River Liza affinis 13 Huang, 1999 ww.
Keelung River Oreochromis hybrids 17.7 Wang et al. 2000 ww
Tansui River Oreochromis hybrids 13.2 Wang et al. 2000 ww
Er-Jen River Oreochromis hybrids 130 Wang et al. 2000 ww
Donkang River Oreochromis hybrids 26.1 Wang et al. 2000 ww
Average of fish markets. Oreochromis hybrid 0.18 Lung et al. 2003 ww, *
Foreign area
Seine river Rutilus rutilus 1300-16000 Chevreuil, et al, 1995 dw
Seine river Rutilus rutilus 2083-7500 (autumn) 1847-3600 (spring) Blanchard et al, 1997 dw
Supermarket, US Pool sample 7.8 Schecter et al,1995 ww, §
German bight Mytilus edulis 356-285(autumn) 498-604(spring) Hühnerfuss et al, 1995 #
San Fran. Bay white croaker halibut
shiner surfperch
340 55 160
Fairey et al, 1997 ww
Lake Tanganyika seven species 35-166 Manirakiza et al, 2002 lpd
Fish farm Dicentrarchus labrax 155-294 Antunes,et al, 2004 lpd
ww: PCB content is represented as ng/g wet weight dw: PCB content is represented as ng/g dry weight lpd: PCB content is represented as ng/g lipid
#: PCB content is represented as ng/g edible organic matter
*: Selected congeners (PCB 28/31, 52, 66, 77, 105/153, 118, 126, 128, 138,156, 157, 167, 169, 170, 180, and 189) §: monoortho and nonortho substituted congeners selected